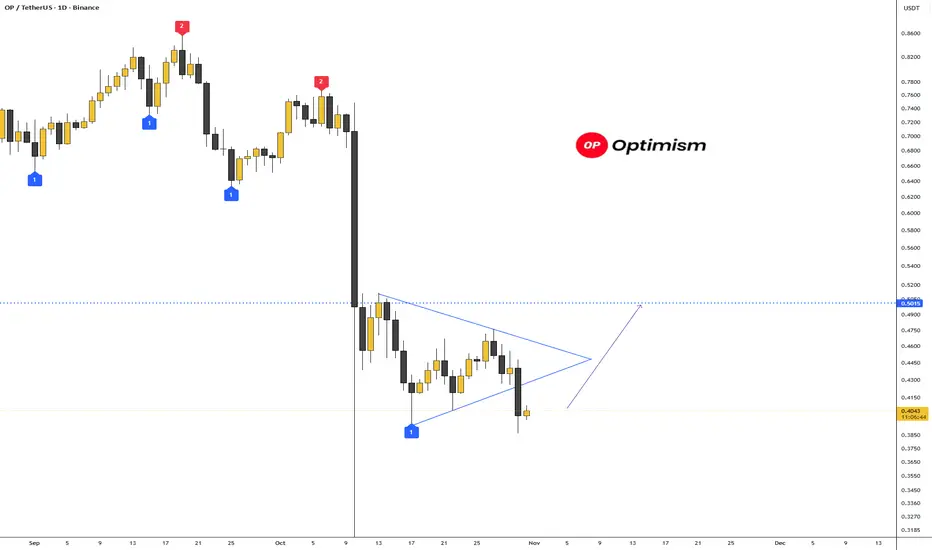
There's also an interesting entry point on OptimismThere's also an interesting entry point on NASDAQ:OP #Optimism.
The trade is almost 1 to 5.
Entry: $0.4059
Take Profit: $0.5015
Stop Loss: $0.3849
It looks a lot like a false breakdown downward and growth along with Bitcoin and Ethereum is quite possible.
Short traders' liquidity has already accumulated.
#Crypto #Trading #DayTrading
Ethereum (Cryptocurrency)
#ETH/USDT Ethereum at a Crossroads: Accumulation vs. Profit-Tak#ETH
The price is moving within an ascending channel on the 1-hour timeframe and is adhering to it well. It is poised to break out strongly and retest the channel.
We have a downtrend line on the RSI indicator that is about to break and retest, which supports the upward move.
There is a key support zone in green at the 3663 price, representing a strong support point.
We have a trend of consolidation above the 100-period moving average.
Entry price: 3720
First target: 3750.45
Second target: 3815.15
Third target: 3885.60
Don't forget a simple money management rule:
Place your stop-loss order below the green support zone.
Once the first target is reached, save some money and then change your stop-loss order to an entry order.
For any questions, please leave a comment.
Thank you.

Bitcoin: from Pet Rock to Loan CollateralCME: Micro Bitcoin Futures ( CME:MBT1! ) and Micro Ether Futures ( CME:MET1! )
Last week, JPMorgan Chase Chairman and CEO Jamie Dimon acknowledged that crypto, blockchain, and stablecoins are "real”, and “we’ll all use them". This marks a notable shift in tone from the longtime Bitcoin critic.
I can’t help but recall the most notable quotes over the years:
• “Cryptos are decentralized Ponzi scheme”.
• Bitcoin is “fraud” and "worse than tulip bulbs".
• “I’d fire in a second any employee trading Bitcoin”.
• "Bitcoin itself is a hyped-up fraud, it's a pet rock".
Why the big change of heart? It has a lot to do with the sweeping changes in the regulatory landscape. The biggest US bank has to adapt and meet new customer demands.
• On January 10, 2024, the SEC approved Bitcoin ETFs for the first time.
• On May 24, 2024, Ethereum ETFs were also approved by the SEC.
• On November 4, 2024, Donald Trump won the US presidential election.
• On January 21, 2025, the SEC, under a new Chairman, created a Crypto Task Force.
• In May 2025, JPMorgan announced that it would accept shares of BlackRock’s iShares Bitcoin Trust (IBIT) as loan collateral from its clients.
• On July 18, 2025, US Congress passed the “GENIUS Act”, setting up new regulatory framework for the issuance and use of stablecoins.
• On August 7, 2025, an Executive Order calls for the Department of Labor to re-examine its guidance on alternative assets like cryptocurrencies in 401(k) plans.
• Last week, JPMorgan announced that it would accept Bitcoin and Ethereum as collateral for institutional loans by the end of 2025.
The latest two events could have profound impact. Two butterflies have flapped their wings in Washington, D.C. and at Wall Street. These actions, in my opinion, will unleash the biggest tornado to sweep up the entire crypto world. So far, the market has not put much thought around it. Bitcoin lost 7% since August.
In my trade idea published on August 12th, I discussed how the crypto market would benefit from the new pool of capital infusion from the $8.7 trillion 401(k) plans.
What is Securities-based Lending?
Securities-based lending, also known as portfolio lending, enables borrowing against the value of their marketable securities without having to liquidate them. It is primarily offered to high-net-worth individuals by large financial institutions. How it works:
1. Collateral Assessment: Borrowers pledge their investment portfolios as collateral for the loan. The lender evaluates the portfolio to determine eligible securities and establishes a loan-to-value (LTV) ratio.
2. Loan Amount: The amount available for borrowing is based on LTV. For example, lenders may allow borrowing up to 70% of the value of stocks and more than 90% of certain government securities.
3. Access to Funds: Once the loan is approved, borrowers can access the funds through checks or wire transfers. The loan can be used for almost any purpose.
According to its annual report, JPMorgan has total loans outstanding of $586 billion at the end of 2024. Of which, Banking & Wealth Management accounted for $33B (5.7%).
JPMorgan accepts the following as collateral: Stocks (liquid Large-cap stocks), Bonds (U.S. Treasury securities), Mutual Funds (large mutual funds and ETFs), and Other Securities (Hedge funds, private equity positions, and certain alternative investments).
• In May, JPMorgan started accepting shares of BlackRock’s iShares Bitcoin Trust (IBIT) as loan collateral. IBIT has net asset value of $87.6B as of October 31st.
• By the end of the year, JPMorgan will accept bitcoin (market cap $2.9 trillion) and Ethereum (market cap $463 billion) as collateral for its securities-based lending.
How big is the securities-based lending market overall?
At a 2024 report, the Federal Reserve estimates the total size of securities-based lending from the Top 100 US banks at $138B by Q1 2024.
Private research (Growth Market Reports) estimates that the global securities-backed lending market size reached $540.2B in 2024. The market is currently expanding at a CAGR of 8.7%, with expectations to attain a value of $1,134.9B by 2033.
This growth is fueled by heightened demand for liquidity solutions, the proliferation of wealth management services, and the rising adoption of flexible credit facilities.
In my opinion, the JPMorgan actions will kick off a trend. As financial assets increasingly become tokenized, the demand for Bitcoin and Ethereum will grow exponentially. Securities-based lending is one of the many uses in mainstream financing.
Unlike the Fed, we can’t print new Bitcoin and Ethereum at will. New demands, from 401k and loan collateral alike, could reach hundreds of billions. This will be the catalyst to lift up the digital gold and silver to the next level.
Riding the ride with Micro Bitcoin and ETF Futures
Traders who share the bullish view on Bitcoins and Ethereum could explore CME Micro Bitcoin Futures ( PSE:MBT ) and Micro ETH Futures ( NYSE:MET ).
The MBT contract has a notional value of 0.10 bitcoin, as defined by the CME CF Bitcoin Reference Rate (BRR). On October 31st, the December contract (MBTZ5) is settled at $110,910. Each contract has a notional value of $11,091. To buy or sell one contract, CME Group requires an initial margin of $2,662. By design, this futures contract has a built-in leverage of 4.2-to-1. When bitcoin goes up, futures positions could enhance the return by four times compared to spot bitcoin positions.
MET has a notional value of 0.10 ETH. On October 31st, the December contract (METZ5) is settled at $3,932.5, putting the contract value at $393.25. The initial margin is $126, implying a built-in leverage of 3.1-to-1. When Ethereum goes up, futures positions could enhance the return by three times compared to spot ETH positions.
What happens if Bitcoin or Ethereum drops? For price protection, traders could enter a buy order with a stoploss. For example:
• A long MBTZ5 order at 110,910 with a stoploss of 95,000 limits the maximum loss to $1,591 (= (110910-95000) x 0.1).
• A long METZ5 order at 3,935.5 with a stoploss of 3,500 limits the maximum loss to $43.25 (= (3932.5-3500) x 0.1).
In addition to margin (leverage) and stoploss (loss protection), both Micro Bitcoin and Micro ETH have a daily price limit at 10%. This feature is particularly helpful when the market is panicky. Price Limit or Circuit slows down the irrational price movements until cooler heads prevail.
Happy Trading.
Disclaimers
*Trade ideas cited above are for illustration only, as an integral part of a case study to demonstrate the fundamental concepts in risk management under the market scenarios being discussed. They shall not be construed as investment recommendations or advice. Nor are they used to promote any specific products, or services.
CME Real-time Market Data help identify trading set-ups and express my market views. If you have futures in your trading portfolio, you can check out on CME Group data plans available that suit your trading needs www.tradingview.com

SHELL/USDT — at the Critical Zone: Breakout or Deadly Rejection?The price of SHELL is currently walking on a tightrope — right at the confluence between the key support zone of 0.120–0.108 and the descending trendline that has been suppressing every bullish attempt for months.
The chart now enters a make-or-break phase where the next major direction will soon be decided.
---
Technical Structure Overview
The current setup forms a Descending Triangle Pattern, where:
The horizontal base (yellow zone) acts as the last line of defense for buyers,
While the descending trendline serves as the main wall for sellers.
In recent months, every breakout attempt has been rejected from this trendline — but this time, momentum looks stronger, and volume is starting to build up.
---
Bullish Scenario
If the price breaks and closes above 0.142 with strong volume confirmation:
The descending triangle could invalidate and turn into a bullish breakout reversal,
Upside targets will likely be at:
0.185 → 0.205 → 0.226 → 0.260 → 0.330,
Such a move may signal the start of a medium-term trend reversal, especially if the broader crypto market gains strength.
Main confirmation: a daily close above 0.142 followed by a successful retest of the breakout zone as new support.
---
Bearish Scenario
However, if momentum fails and the price gets rejected from the trendline and then breaks below 0.108,
The descending triangle will confirm as a bearish continuation pattern,
The next downside target sits around 0.085–0.075, the previous demand area.
Losing 0.108 support may trigger a panic sell and extend the bearish cycle significantly.
---
Key Takeaway
The 0.120–0.108 zone is the lifeline for buyers right now.
A breakout above it could reshape the entire medium-term structure,
while a breakdown below it could open the path for a deeper selloff.
Moments like this are often golden opportunities for technical traders — where the risk is tightly controlled, but the reward potential is substantial if confirmation appears.
---
Conclusion
SHELL stands at the final equilibrium between buyers and sellers.
The longer price stays under the descending trendline, the more pressure builds up for a decisive move.
Once the breakout or breakdown happens, a volatility expansion is inevitable.
The key is simple:
Watch the daily close, monitor the volume, and follow the confirmation.
#SHELLUSDT #CryptoAnalysis #BreakoutZone #TechnicalAnalysis #DescendingTriangle #CryptoSetup #PriceAction #SupportResistance #TrendReversal #CryptoTrader #ChartOfTheDay

EtHUSD M30 | Bullish Bounce Off Key SupportETH/USD has bounced off the buy entry, which is a pullback support that aligns with the 50% Fibonacci retracement and could potentially rise from this level to the upside.
Buy entry is at 787.96, which is a pullback support that aligns with the 50% Fibonacci retracement
Stop loss is at 3,679.04, which is a swing low support.
Take profit is at 3,4.94, which his an overlap resistance that is slightly above the 40% Fibonacci retracement.
Stratos Markets Limited (tradu.com ):
CFDs are complex instruments and come with a high risk of losing money rapidly due to leverage. 68% of retail investor accounts lose money when trading CFDs with this provider. You should consider whether you understand how CFDs work and whether you can afford to take the high risk of losing your money.
Stratos Europe Ltd (tradu.com ):
CFDs are complex instruments and come with a high risk of losing money rapidly due to leverage. 70% of retail investor accounts lose money when trading CFDs with this provider. You should consider whether you understand how CFDs work and whether you can afford to take the high risk of losing your money.

Bearish drop off?The Ethereum (ETH/USD) could rise to the pivot and could reverse to the 1st support, which is an overlap support.
Pivot: 4,270.27
1st Support: 3,471.82
1st Resistance: 4,852.38
Disclaimer:
The above opinions given constitute general market commentary, and do not constitute the opinion or advice of IC Markets or any form of personal or investment advice.
Any opinions, news, research, analyses, prices, other information, or links to third-party sites contained on this website are provided on an "as-is" basis, are intended only to be informative, is not an advice nor a recommendation, nor research, or a record of our trading prices, or an offer of, or solicitation for a transaction in any financial instrument and thus should not be treated as such. The information provided does not involve any specific investment objectives, financial situation and needs of any specific person who may receive it. Please be aware, that past performance is not a reliable indicator of future performance and/or results. Past Performance or Forward-looking scenarios based upon the reasonable beliefs of the third-party provider are not a guarantee of future performance. Actual results may differ materially from those anticipated in forward-looking or past performance statements. IC Markets makes no representation or warranty and assumes no liability as to the accuracy or completeness of the information provided, nor any loss arising from any investment based on a recommendation, forecast or any information supplied by any third-party.

ETH Repeating Last Weekend's PA?This weekend's PA is very similar to last weekend, and I think we are roughly near the circled areas with respect to progression. BITSTAMP:ETHUSD is at high risk area to open new positions and it would be safer once the 3900 level is broken on volume. If we break 3900, then it should be fairly easy to reach 4000 but there is a confluence of resistance there, so I expect a pause/temporary reversal.
Current Trades
Spot
Entry: 3700
TP: ~4030 (.618 fib) unless it breaks on volume, then ~4130 (.768 fib)
SL: 3795
Perps (20x long)
Entry: 3842
TP: same as above
SL: 3830

My doodle predictions for EthereumIt's crazy how strong this level is, my idea is we might have to scare some people to drop their ETH buy from them and then long upwards, if it was up to me I would go with scenario D.

ETH Weakening Near Support, Big Move Loading?CRYPTOCAP:ETH is currently trading near a key support zone, which has held strong multiple times in the past. The price has been consolidating between this support and the mid S/R zone, showing that both bulls and bears are battling for control.
If ETH manages to break and sustain above the mid S/R zone, we could see a potential upside continuation toward higher levels. However, if the price fails to hold this key support and closes below it, a deeper correction toward the lower support zone could be on the table.
For now, ETH looks weaker day by day, so it’s important to keep a close eye on how the price reacts around this zone, a decisive move could set the tone for the next big trend.
DYOR, NFA

ETH/USDT Swing Trade | Heikin Ashi Confirmation + Pullback Plan🚀 ETH/USDT: The Great Crypto Heist — Swing/Day Trade Wealth Strategy! 🤑
Ladies and Gentlemen, welcome to the Thief’s Master Plan for ETH/USDT (Ethereum vs. Tether)! 🎩 This is a fun, professional, and calculated swing/day trade setup designed to catch the bullish wave while dodging the traps. Let’s break down this heist with style, precision, and a sprinkle of humor! 😎
📊 Asset: ETH/USDT (Ethereum vs. Tether)
Market: Crypto (High Volatility, High Reward!)
Strategy: Swing/Day Trade with a Thief’s Layered Entry approach
Vibe: Bullish, sneaky, and ready to outsmart the market! 🦹♂️
🧠 The Plan: Bullish Breakout with Technical Confirmation
✅ Bullish Confirmation: We’re riding the bullish wave with a Triangular Moving Average (TMA) pullback. This confirms the trend direction and filters out noise.
✅ Heikin Ashi Magic: A strong bullish Heikin Ashi candle signals momentum. Watch for smooth green candles to confirm the trend’s strength! 📈
🔑 Key Insight: The TMA pullback combined with Heikin Ashi gives us a high-probability setup for a breakout. Stay sharp, Thieves!
🚪 Entry: The Thief’s Layered Approach
🕵️♂️ Strategy: Use a layered entry (multiple buy limit orders) to scale into the trade like a true market bandit!
📍 Entry Levels:
Buy Limit @ $4250
Buy Limit @ $4300
Buy Limit @ $4350
Buy Limit @ $4400
💡 Pro Tip: Feel free to add more layers based on your risk appetite! Stack those orders like a master thief stacking loot. 💰
⚠️ Note: You can enter at any price level within this range if you spot momentum. The layered approach maximizes flexibility!
🛑 Stop Loss: The Thief’s Escape Route
🚨 Stop Loss: Set at $4150 to protect your loot.
⚠️ Thief’s Disclaimer: This is my suggested stop loss, but you’re the boss of your own heist! Adjust based on your risk tolerance. Don’t get caught by the market cops! 👮♂️
🎯 Target: Steal the Profits, Dodge the Trap!
🏦 Target Price: Aim for $4700 as our primary profit zone.
🚨 Resistance Alert: A police barricade (strong resistance) lurks around $4800. This level is overbought and a potential trap for greedy thieves. Cash out early to secure your gains!
💡 Pro Tip: Don’t get too greedy — take profits at your own discretion. The market is full of traps, so escape with your loot! 🏃♂️
👀 Related Pairs to Watch
Keep an eye on these correlated pairs to confirm market sentiment and strengthen your setup:
BTCUSDT ($): Bitcoin often leads the crypto market. If BTC is pumping, ETH is likely to follow. Watch for BTC breaking key resistance at $60,000 for added bullish confirmation.
ETHBTC: This pair shows ETH’s strength relative to BTC. A rising ETH/BTC ratio suggests ETH is outperforming, reinforcing our bullish bias.
SOLUSDT ($): Solana often moves in tandem with ETH. A breakout in SOL above $150 could signal broader altcoin strength.
Key Correlation: ETH’s price action is tightly linked to BTC and overall market sentiment. Monitor BTC’s trend and crypto market cap for context.
🔍 Key Points & Why This Setup Works
TMA Pullback: Acts as a dynamic support zone, ensuring we enter after a healthy retracement.
Heikin Ashi Confirmation: Filters out choppy price action, giving us clear bullish signals.
Layered Entries: Spreads risk and allows flexibility in volatile markets.
Risk Management: Tight stop loss at $4150 keeps the risk-reward ratio attractive.
Market Context: Crypto markets are volatile, but ETH’s bullish structure and correlation with BTC make this a high-probability trade.
📝 Thief’s Code: Risk Management
Dear Ladies and Gentlemen (Thief OGs), this is a fun strategy, but trading is serious business! 🕴️
Set your own stop loss and take profit based on your risk tolerance.
Never risk more than you can afford to lose — this is a heist, not a gamble!
Stay disciplined, and don’t let the market cops catch you off guard! 🚓
“If you find value in my analysis, a 👍 and 🚀 boost is much appreciated — it helps me share more setups with the community!”
Disclaimer: This is a Thief-Style trading strategy crafted for fun and educational purposes. Always do your own research and trade at your own risk. The market is a wild place — stay sharp, Thieves! 🦹♂️
#ETHUSDT #CryptoTrading #SwingTrading #DayTrading #ThiefStrategy #Bullish #TechnicalAnalysis #HeikinAshi #TradingView

ETHUSDT: Short-Term Pullback Toward Trendline Before PotentialHi guys!
On the current 1h chart, Ethereum shows a clear structure of recovery following a liquidity sweep marked as “Hunting happened.” This move indicates that liquidity below the previous lows has already been collected, creating a potential base for a short-term bullish correction.
Price is currently consolidating above a minor support zone (highlighted in pink), showing a possible accumulation phase. The projected path suggests a potential bullish move toward the major supply zone around $4,080–$4,180, which aligns with the descending trendline acting as dynamic resistance.
However, given the overall bearish market structure and the dominance of the descending trendline, the area around $4,100 could serve as a strong reaction zone. A rejection from this level would likely confirm continuation of the broader downtrend, with a possible retracement toward the $3,700–$3,750 area.

the real question is what happens to $ETH at ATH?eth is currently holding above the quarter channel with resistance above between 3500-ATH
there is a potential moonshot to 7k and beyond (13k?), if the markets are indeed in the infant stage of a bull run.
for now eth is heading towards the golden pocket of the move down with support from ath avwap
as htf bullish market structure never broke this could mean that the highs are ran, rsi has bounced the mid point and could be cruising towards the cook zone again, its here i will watch to see a divergence form when the 3M OB and yearly level is approached.
upside 3500, 4500/ATH, 7000, 130000
downside 1900, 1200, 800
its quite possible that we put in a long term range drifting between 5k and 1k before we see expansion upwards
nfa, just food for thought on the htf but most of the volume is supporting price.

ETH/USD Short Setup: Bearish Reversal Toward $3,830 TargetA short (sell) trade setup for Ethereum (ETH/USD).
The entry zone is around $3,870–$3,880.
The stop loss is set at $3,909.71, protecting against upside breakouts.
The target is $3,830.85, suggesting a downside move of about $40.
The price action and drawn arrow indicate expectations of a bearish move after a small consolidation

ETHUSDT.P - November 1, 2025ETHUSDT.P is forming a corrective pullback within an intraday bullish structure, maintaining higher lows from the recent swing base. A buy limit order is positioned near $3,850, anticipating continuation toward the $3,891 resistance target. The stop-loss is set around $3,828 to manage downside risk. A rebound from the order zone would confirm bullish momentum resumption, while sustained price action below $3,828 would invalidate the setup.

ETHEREUM HIGH PROBABILITY SETUP SOON!!!🚨 ETHER HIGH PROBABILITY SELL/BUY SETUP 🚨
* Here We Can See Clearly The Next Potential Moves For ETHUSD Coming Hours/Days.
* Keep Your Eyes Close On Your Trading Positions.
* Happy PIP Hunting Traders.
FXKILLA.

Can Ethereum’s Capital Flow Blueprint Target 4600 Next?🎯 ETH/USD "The Liquidity Thief" Strategy 💰
Weighted MA Pullback + Manipulation Grab Blueprint
📊 TRADE SETUP OVERVIEW
Asset: ETH/USD (Ethereum vs USD) | Timeframe: Swing Trade
Market Structure: Bullish Confirmation with WMA Pullback Recovery
Strategy Type: Multi-Layer Accumulation (Thief-Style Entry Method)
🎪 THE GAMEPLAN
Bias: 🟢 BULLISH — Confirmed via:
Weighted Moving Average (WMA) acting as dynamic support
Liquidity pool identification on pullback zones
Institutional accumulation patterns detected
This setup thrives on pullback retracements where smart money accumulates before the next leg up. We're essentially "stealing" liquidity at discount prices during these inefficiency windows.
🚀 MULTI-LAYER ENTRY STRATEGY (The Thief Approach)
Instead of FOMO market orders, we deploy calculated limit order layers at strategic support zones:
Entry Levels (Layer-by-Layer Accumulation):
Layer 1: $3,700 USD
Layer 2: $3,800 USD
Layer 3: $3,900 USD
(Pro Tip: Scale these layers based on your risk tolerance and account size. Tighter layers = more fills; wider layers = better average price)
Position Building: Fill partial positions at each layer, building your total exposure gradually. This reduces average entry cost and maximizes probability of initial profit.
🛑 STOP LOSS (Risk Management)
Hard Stop: $3,500 USD
⚠️ Important Disclaimer: This is YOUR trading decision. No strategy guarantees profits. Position sizing and risk management are YOUR responsibility. Never risk capital you can't afford to lose.
🎯 TARGET & EXIT STRATEGY
Primary Target: $4,600 USD
Exit Rationale:
Strong resistance zone confluence
RSI/Stochastic overbought divergence
Liquidity trap zone (potential reversal catalyst)
💡 Golden Rule: Lock in profits at $4,600 or take partial profits at resistance. Never hold through key resistance on swing trades—greed kills thief traders.
⚠️ Disclosure: Risk management and profit targets are trader-dependent. Adjust based on your strategy framework, market conditions, and account allocation.
📈 CORRELATED PAIRS TO WATCH
Monitor these assets for confluence signals and capital flow indicators:
BITSTAMP:BTCUSD (✅ High Positive Correlation) — Bitcoin sets market sentiment; ETH typically follows in lockstep. When BTC rallies, altcoins like ETH amplify the move upward.
BINANCE:ETHBTC (⚖️ Relative Strength) — ETH strength against BTC equals altseason confirmation. Rising ETHBTC ratio means Ethereum is outperforming Bitcoin—bullish for our setup.
$SPY/ IG:NASDAQ (📊 Risk Appetite) — Traditional equity weakness creates crypto pullback risk. If stocks dump, crypto usually follows. Monitor US market opens for confirmation signals.
TVC:DXY (Dollar Index) (⚖️ Inverse Correlation) — Strong dollar = crypto headwind; weak dollar = tailwind for ETH. A declining DXY supports crypto rally scenarios.
COINBASE:USDTUSD (🔒 Stablecoin Flow) — USDT accumulation signals capital waiting for entry. Rising USDT on exchanges = dry powder ready to deploy into altcoins like ETH.
Capital Flow Blueprint: When BTC holds above support AND USDT shows inflow, altcoins like ETH enter "hunter mode."
🔑 KEY TRADING PRINCIPLES (Thief OG Edition)
✨ Patience — Wait for pullback confirmation before layering in
✨ Position Sizing — Risk only 1-2% per trade; 3% absolute maximum
✨ Confluence — Entry + Support + Volume + Correlation = Green Light
✨ Discipline — Exit at target or stop loss; no emotional HODL mode
✨ Adaptation — Markets evolve; update bias if structure breaks
If you find value in my analysis, a 👍 and 🚀 boost is much appreciated — it helps me share more setups with the community!
#ETH #ETHUSD #Ethereum #CryptoTrading #TechnicalAnalysis #SwingTrading #CryptoDCA #TradingStrategy #LayerEntry #LiquidityZones #AltSeason #CryptoAnalysis #TradeSetup #RiskManagement #Thief #CommunityDriven

Will Ethereum’s tight range lead to a breakout? | Day 34☃️ Welcome to the cryptos winter , I hope you’ve started your day well.
⏰ We’re analyzing BTC on the 1-Day timeframe .
👀 Ethereum on the daily timeframe. Ethereum is currently inside a box-like structure in a trading range format. The top of this trading range is in the $4,161 area, and the bottom of this trading range is in the $3,801 price area, where by breaking these zones, Ethereum can start a stronger and more impulsive leg of movement.
🧮RSI oscillator, which has now formed two important oscillation zones for us — one around 54, which overlaps with our long trigger, and the other around 40, which overlaps with our short trigger. The fluctuation limit crossing these zones can give more momentum to Ethereum’s next move on the daily timeframe.
🕯 Ethereum’s volume, after the flash crash the market experienced, has increased sharply, but the tendency has been pushed toward selling pressure, which has caused Ethereum’s corrections to always come with selling pressure.
📈 For Ethereum positioning, the specified zones have high price action validity, where you can set alerts so that if the price reaches these zones, you can open a position. Or, in the multi-timeframe, you can find the identified support and resistance zones and open positions with lower risk around these areas, moving toward anticipating higher or lower levels, so that in each level, you can add some risk to your position.
❤️ Disclaimer : This analysis is purely based on my personal opinion and I only trade if the stated triggers are activated .

ETH Ethereum Analysis: Waiting for Confirmation at a Key Level📊 Currently analyzing Ethereum (ETH) — on the 4H timeframe, price action has broken structure and tapped into a major external range high, aligning perfectly with a significant resistance zone. ⚡
When we zoom into the 30-minute chart, applying tools like the Anchored VWAP and Volume Profile, we can clearly observe a deep retracement beneath both the VWAP and a key value area. This suggests a period of indecision where price could break in either direction — 🚀 a clean breakout above may trigger a long opportunity, while a rejection and move lower could present a short setup.
At this stage, patience is key — we’re simply waiting for the market to reveal its hand before committing to a bias. 🎯
📉 Disclaimer: This analysis is for educational purposes only and not financial advice. Always conduct your own research before trading.

Ethereum Analysis (2H)In the lower timeframes, after the major dump forming wave A, it seems that wave B has developed as a diametric pattern, with one remaining leg wave g. Wave g is bullish and could target the levels marked on the chart:
targets : 3920$ - 4038$ _ 4142$
The green zone represents the entry area, which is likely to be retested.
For risk management, please don't forget stop loss and capital management
When we reach the first target, save some profit and then change the stop to entry
Comment if you have any questions
Thank You

CORRECTION ON ETHmy take on ETH H1,
possibly a complex correction before turning down to minuette c as impulse. wil monitor tomorrow

EthereumEthereum's price was rejected at support at 3700, now in an uptrend heading towards the 0.5 Fibonacci level, favoring continuation of the long movement to the resistance at 4100.

My November and December expectations.According to my possible wave counts the first week of November may be a sell-off, then the direction may be upwards, and declines may occur after the Christmas holiday.
* The purpose of my graphic drawings is purely educational.
* What i write here is not an investment advice. Please do your own research before investing in any asset.
* Never take my personal opinions as investment advice, you may lose your money.

ETHUSD Neutral bias remains intact above 3,723The ETHUSD remains in a neutral trend, with recent price action indicating a corrective pullback within the broader trading range.
Support Zone: 3,723 – a key level from previous consolidation. Price is currently testing or approaching this level.
A bullish rebound from 3,723 would confirm ongoing upside momentum, with potential targets at:
4,020 – initial resistance
4,118 – psychological and structural level
4,210 – extended resistance on the longer-term chart
Bearish Scenario:
A confirmed break and daily close below 3,723 would weaken the bullish outlook and suggest deeper downside risk toward:
3,620 – minor support
3,520 – stronger support and potential demand zone
Outlook:
Neutral bias remains intact while the ETHUSD holds above 3,723. A sustained break below this level could shift momentum to the downside in the short term.
This communication is for informational purposes only and should not be viewed as any form of recommendation as to a particular course of action or as investment advice. It is not intended as an offer or solicitation for the purchase or sale of any financial instrument or as an official confirmation of any transaction. Opinions, estimates and assumptions expressed herein are made as of the date of this communication and are subject to change without notice. This communication has been prepared based upon information, including market prices, data and other information, believed to be reliable; however, Trade Nation does not warrant its completeness or accuracy. All market prices and market data contained in or attached to this communication are indicative and subject to change without notice.
