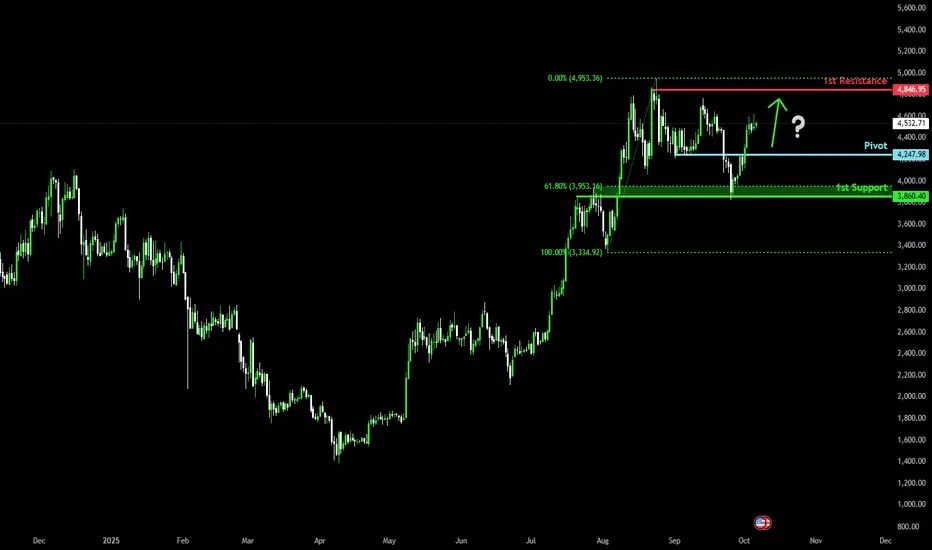
Bullish bounce from support?The Ethereum (ETH/USD) is falling towards the pivot which acts as a pullback support and could bounce to the 1st resistance.
Pivot: 4,247.98
1st Support: 3,860.40
1st Resistance: 4,846.95
Disclaimer:
The above opinions given constitute general market commentary, and do not constitute the opinion or advice of IC Markets or any form of personal or investment advice.
Any opinions, news, research, analyses, prices, other information, or links to third-party sites contained on this website are provided on an "as-is" basis, are intended only to be informative, is not an advice nor a recommendation, nor research, or a record of our trading prices, or an offer of, or solicitation for a transaction in any financial instrument and thus should not be treated as such. The information provided does not involve any specific investment objectives, financial situation and needs of any specific person who may receive it. Please be aware, that past performance is not a reliable indicator of future performance and/or results. Past Performance or Forward-looking scenarios based upon the reasonable beliefs of the third-party provider are not a guarantee of future performance. Actual results may differ materially from those anticipated in forward-looking or past performance statements. IC Markets makes no representation or warranty and assumes no liability as to the accuracy or completeness of the information provided, nor any loss arising from any investment based on a recommendation, forecast or any information supplied by any third-party.
Ethereum (Cryptocurrency)
Ethereum - too big to failIf you try to find top100 coinmarketcap coin list, you will be amazed by how many cryptocurrencies are now forgotten or even dead. Even 100M+ mcap coins die because they turn out to be merely speculative or scammy ventures. But one of the few that stayed on top of all the garbage was Ethereum.
It stayed on top of everything because it was the first crypto which created an ecosystem hosting multiple
"protocols" and tokens, which also helped crypto market grow not only in terms of market cap but infrastructurally.
So I believe it is now too big to fail, but not just because of ~400B. market cap but also due to how many project are based on top of EVM.
I think it might reach at least ~700B market cap during this cycle but later it will be among trillion mcap assets

Bitcoin Makes New All Time Highs!Bitcoin dominance is being observed as its lifting the crypto market.
We just briefly saw BTC make new intra day all time highs, but its has yet to close on the daily chart above the previous all time high.
Short traders will be using the recent daily topping tail as a level to short against.
Long traders will be using the 7MA to buy the dip.
If we close above the daily topping tail it does suggest we are heading to 129k - 130k.
This would be one nasty double top of it turns out to be a liquidity sweep.
Crypto stocks tomorrow will likely gap up...watch for clues intra day. Will they hold their gains or see selling / reversals?

ETHEREUM WILL GROW|LONG|
✅ETHUSD price is respecting the demand area and forming bullish structure. A reaction from this level could fuel continuation toward the 4,560$ target zone. Time Frame 4H.
LONG🚀
✅Like and subscribe to never miss a new idea!✅

BTC/USDT | BTC Uptober Begins – Massive Rally Loading!By analyzing the Bitcoin chart on the 4-hour timeframe, we can see that the price moved exactly as expected — it hit the $118,000 target and even rallied up to $123,900 . After reaching this key supply zone, which we had marked earlier, BTC faced selling pressure and is now trading around $121,800.
If Bitcoin can hold and stabilize above $120K , we could see a new ATH soon ! “Uptober” has just begun, and it looks like we’re in for a strong bullish month. The next upside targets are $125K, $132K, and $138K.
Please support me with your likes and comments to motivate me to share more analysis with you and share your opinion about the possible trend of this chart with me !
Best Regards , Arman Shaban

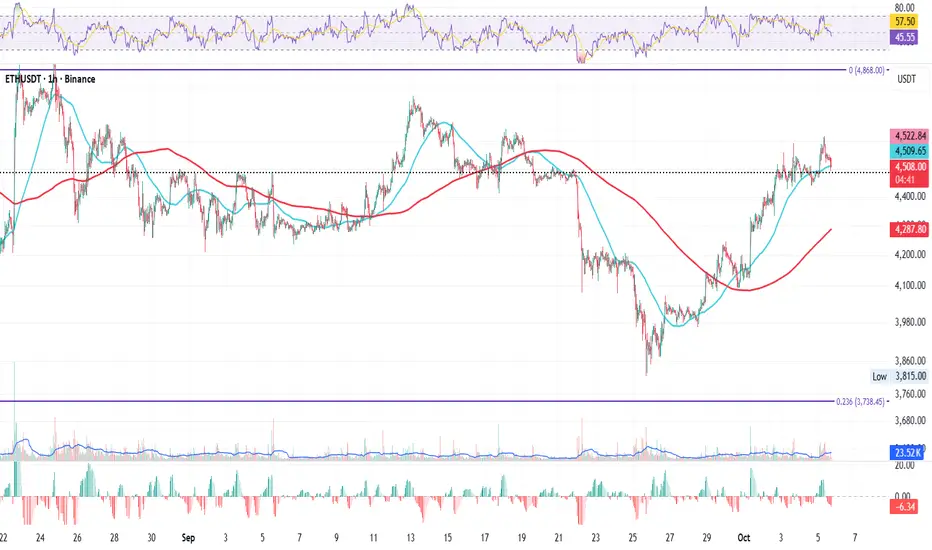
ETH 1H – Holding the Line or Breaking It?ETH 1H – Holding the Line or Breaking It?
Just like BTC, ETH on the 1H is currently testing the 50MA, the short-term line between strength and weakness.
The question now: will it hold as support, or will price break below and look for shelter near the 200MA?
Right under the 50MA sits yesterday’s close, adding an extra layer of support for the short-term structure.
Today’s close could be decisive for next week’s momentum. 👀
Key notes:
ETH testing the 50MA on 1H
200MA below as next support
Yesterday’s close acting as buffer
Close today could shape next week’s direction
Bias:
Neutral-bullish — momentum intact as long as the 50MA holds.
Always take profits and manage risk.
Interaction is welcome.
ETHUSD: Target Is Down! Short!
My dear friends,
Today we will analyse ETHUSD together☺️
The price is near a wide key level
and the pair is approaching a significant decision level of 4,503.3 Therefore, a strong bearish reaction here could determine the next move down.We will watch for a confirmation candle, and then target the next key level of 4,483.8.Recommend Stop-loss is beyond the current level.
❤️Sending you lots of Love and Hugs❤️
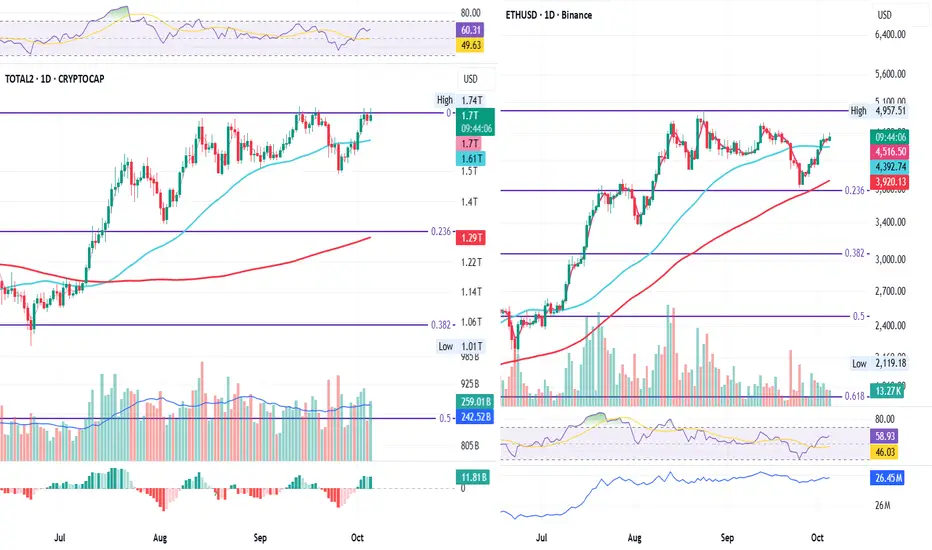
TOTAL2 Battles ATH While ETH Lags BehindTOTAL2 & ETH Daily – Testing the Edge of Structure
On the daily chart, TOTAL2 and ETH are showing a slight divergence.
TOTAL2 is battling its all-time high, while ETH is lagging slightly, hovering just above the 50MA.
If ETH manages to hold this level, it could build strength for another attempt at the highs. But if it loses the 50MA, this current high might turn into a lower high, risking a short-term break in bullish structure.
Today’s close will be key, it might offer the first clue about where momentum wants to flow next.
Key Notes:
TOTAL2 retesting all-time high
ETH consolidating over the 50MA
A hold could fuel another push up
A break below risks a lower high formation
Daily close likely to set short-term direction
Bias:
Cautiously bullish, structure holds, but confirmation depends on ETH defending the 50MA.
Always take profits and manage risk.
Interaction is welcome.
ETHUSDT.P - October 5, 2025This is a conservative set up for a potential continuation of the bullish trend.
Risk: Medium
Chance of Success: Medium to High
Entry Price: 4511.11
Profit Level: 5802.66
Stop Level: 3213.07

$ETH going to $10k The major downtrend breakout and retest that began at the 2021 ATH level has been successfully completed.
Ethereum position yourself

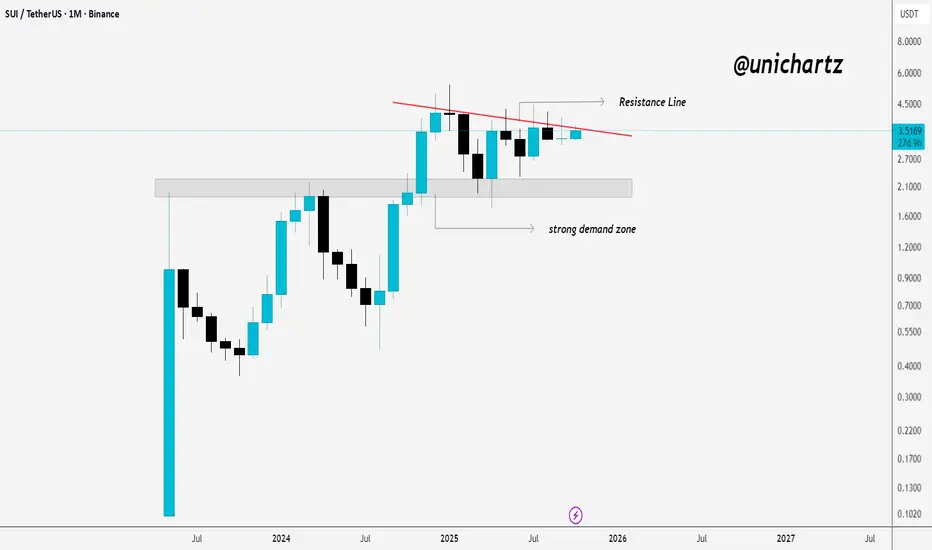
SUI Testing Monthly Resistance$SUI/USDT Monthly Chart
SUI is holding firm above the demand zone near $2.2, showing solid buyer interest. Price is now testing a descending resistance line that has capped previous rallies.
A monthly close above $3.8–$4 would signal a potential breakout and shift momentum toward the $5 zone. Until then, pullbacks to the demand area remain healthy for accumulation.
DYOR, NFA
ETHSimple chart :
- Don’t fight the trend, just stick to your strategy.
- follow the signs.
- Never go all in and always DCA.
Only this way we will learn to master our emotions.
Happy Tr4Ding !

Ethereum Not Dead- i know some peoples think ETH will go to 250$ or 500$, so wait for it...
- I've always maintained that I'm not a fan of ETH because of its scalability limitations and centralization, for that reason ETH needs some messy L1...L2...etc..
- That said, my opinion doesn’t matter much, ETH is here to stay. The Ethereum ecosystem hosts thousands of projects; I’d say it’s too big to fail.
- i used Bitstamp exchange to look further back in the chart's history.
- i simplified this monthly chart so much that even a 10 year old kid could understand it, just check the RSI low levels and compare it with previous years. Again, check the max RSI level for the previous ATHs.
- i won't discuss where to buy because, whether you get ETH at $1,800 or $1,500, the bull run for ETH and Altcoins hasn't started yet.
Happy Tr4Ding !

ETH 2020\2025Ethereum Parabolic run is coming.
same vibes \ same setup \ different cycle
CRYPTOCAP:ETH ⟠

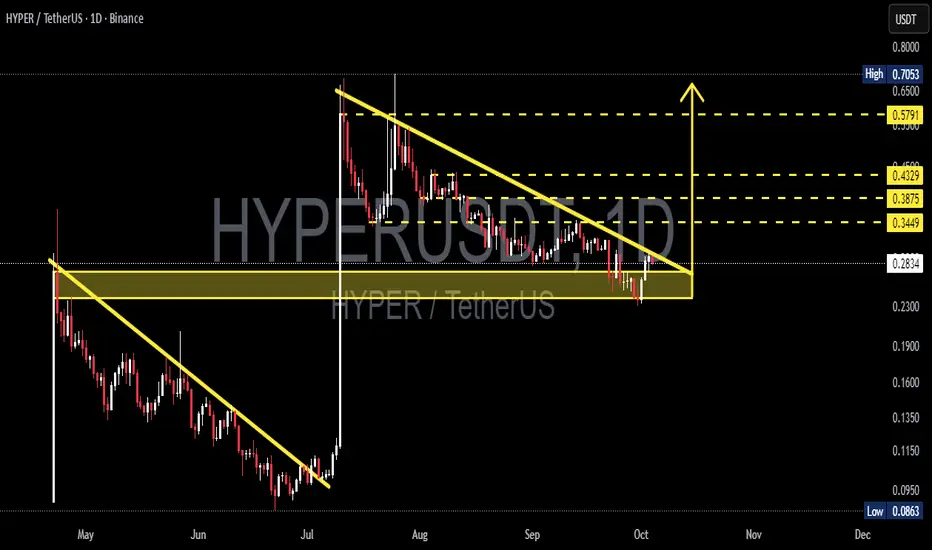
HYPER/USDT — Descending Triangle: Breakout or Breakdown?🔎 Overview
HYPER/USDT is currently trading inside a crucial consolidation zone (0.23–0.29 USDT) while being compressed by a descending trendline.
This setup forms a descending triangle pattern, typically a bearish continuation, but in some cases (especially after a strong rally), it can act as an accumulation phase before another bullish leg.
The market is now at a decision point — waiting for either a confirmed breakout to the upside or a breakdown below support.
---
📌 Pattern & Market Structure
Previous Trend: Strong pump in early July → followed by consolidation with selling pressure.
Main Pattern: Descending Triangle = flat horizontal support + descending trendline of lower highs.
Support Zone: 0.23 – 0.29 (highlighted yellow box on the chart).
Key Resistance Levels (if breakout occurs):
0.3449 → initial target
0.3875 → mid resistance
0.4329 → major resistance
0.5791 → extended target if momentum continues
Historical High/Low: High 0.7053 / Low 0.0863.
---
🚀 Bullish Scenario
1. Confirmation: A strong daily close above the descending trendline, ideally above 0.31.
2. Retest: Breakout gains strength if price retests the trendline and holds as new support.
3. Upside Targets:
TP1: 0.3449
TP2: 0.3875
TP3: 0.4329
TP4: 0.5791 (if rally extends)
4. Invalidation: A daily close below 0.23 invalidates the bullish setup.
---
🐻 Bearish Scenario
1. Confirmation: A daily close below 0.23 with strong volume confirms breakdown.
2. Downside Targets:
0.16 – 0.135 zone → historical support area
0.0863 → previous cycle low, major bearish target
3. Invalidation: If price reclaims and sustains above 0.34, the bearish outlook fails.
---
⚖️ Conclusion & Outlook
Neutral Zone: As long as price stays between 0.23 – 0.30, the market remains sideways without clear direction.
Bullish Outlook: Needs confirmation with daily close above trendline.
Bearish Outlook: Breakdown below 0.23 would shift momentum clearly bearish.
Best Strategy: Wait for confirmation on daily close & volume before entering, since descending triangles are prone to false breakouts.
---
📝 Notes for Traders
Apply strict risk management (1–2% risk per trade).
Take partial profits at each resistance level.
Focus on daily closes and volume spikes for confirmation, not intraday wicks.
---
#HYPERUSDT #Crypto #TechnicalAnalysis #Altcoin #PriceAction #ChartPattern #DescendingTriangle #Breakout #Bearish #Bullish #SupportResistance
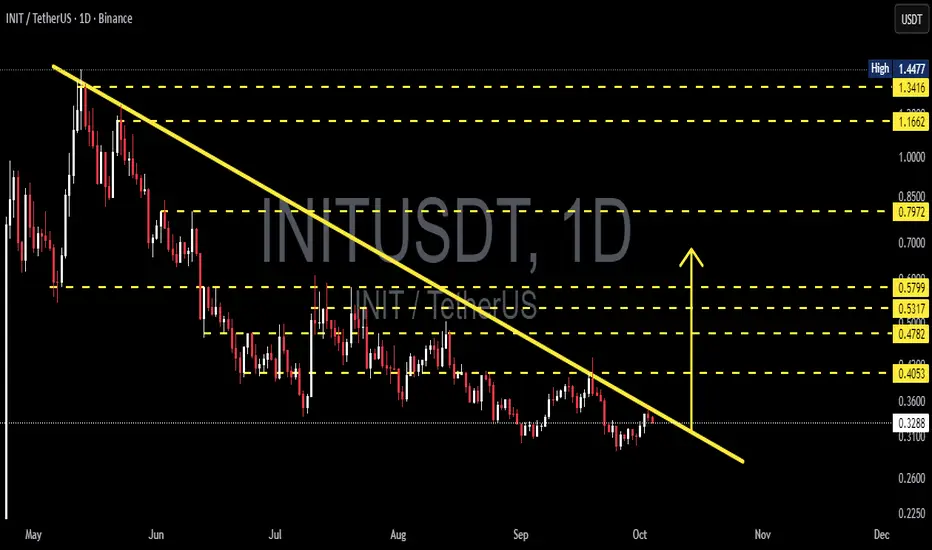
INIT/USDT — Breakout or Continuation of Downtrend?🔎 Chart Analysis
INIT/USDT has been in a clear downtrend since its peak earlier this year. The yellow descending trendline connecting the series of lower highs continues to act as a major dynamic resistance. Current price is trading around $0.3295, right at a critical decision zone.
Key elements on the chart:
Main Trend: Bearish (lower highs & lower lows).
Dynamic Resistance: Descending trendline (yellow).
Horizontal Resistances: $0.4053 – $0.4782 – $0.5317 – $0.5799 – $0.7972 – $1.1662 – $1.3416 – $1.4477.
Nearest Support: Consolidation zone around $0.3000 – $0.3100.
The price is now pressing against the trendline. A decisive move (breakout or rejection) will determine the next major direction.
---
📈 Bullish Scenario
1. Breakout Confirmation: Daily close above the descending trendline is required.
2. Retest Validation: A successful retest of the broken trendline turning into support would strengthen the bullish case.
3. Upside Targets:
First target: $0.4053 (+23%)
Next levels: $0.4782 (+45%), $0.5317, $0.5799
Extended targets: $0.7972, $1.1662, $1.3416, up to $1.4477 if a trend reversal solidifies.
4. Risk Management: Stop loss can be placed slightly below the retest level or below the $0.31 support zone.
---
📉 Bearish Scenario
1. Rejection at Trendline: If price gets rejected at the yellow line, the downtrend remains intact.
2. Breakdown of Support: A daily close below $0.30–$0.31 support zone could trigger a move to new lows.
3. Trading Plan: Aggressive traders may short at trendline rejection with stops above the rejection candle; conservative traders may wait for a breakdown + retest confirmation.
---
📊 Pattern & Structure
The chart highlights a descending trendline pattern, typical of bearish market conditions. However, the longer the price tests this resistance, the higher the chance of a breakout. At this stage, INIT is clearly at a make-or-break level.
---
📝 Conclusion
A confirmed breakout above the trendline could trigger a trend shift to bullish.
A rejection at the trendline confirms further downside pressure.
Horizontal levels act as step-by-step targets/resistances.
Risk management is crucial here due to the high probability of false breakouts.
---
#INITUSDT #INIT #Crypto #Breakout #Downtrend #BullishScenario #BearishScenario #TechnicalAnalysis #SwingTrading
$PUDGY: Watching for Flag Breakout
The CSECY:PENGU is still contained within the flag pattern, following a strong rally. While there’s upward momentum, the breakout hasn’t fully occurred yet.
Key points:
Resistance: Watch the 0.032 area as the flag's upper boundary. A breakout here could confirm a continuation of the bullish trend.
Support: The 0.026 support zone remains crucial. If price holds here, it could set up for another push higher.
For now, the price is stuck in the flag pattern, with the breakout above resistance being the next key move.
Follow us and stay tuned for more updates.
#PEACE
DYOR, NFA

SOL: Ready for a Big MoveWe can see CRYPTOCAP:SOL is currently in a period of accumulation, just like it was back in 2021 before a massive rally . The key rising support line has been holding up strong, and after periods of accumulation, the price has consistently exploded upwards, reaching new highs.
Right now , the price is approaching its previous all-time high (ATH), and if history repeats itself, we could be in for another "boom" phase. The price is holding well above the key support, which strengthens the bullish outlook.
Keep an eye on the price action around the ATH level, if we break through, it could signal the next major leg up. This setup looks very similar to past accumulation phases that led to significant price jumps.
#PEACE
Stay tuned for more updates

BNB Soars Above Key SupportLooking at this $BNB/USDT chart, here's a more concise breakdown:
Rising Support: The red line shows a strong support level that has held up since 2018, with the price bouncing off it several times, confirming its importance.
Accumulation Zone: Between 2020 and 2021, BNB traded sideways, building up buying pressure before the next move.
Breakout: After the accumulation phase, BNB broke out sharply, signaling the start of a strong upward trend.
Current Trend: The price is now above the rising support line, and the bullish momentum seems to be continuing, suggesting further potential upside.
In short , BNB is in a solid uptrend, with a key support line holding strong. The breakout indicates more gains ahead if the trend continues.

Price Poised for Bullish Flag Surge!$XRP/USDT chart shows an accumulation phase from April to June, followed by a breakout in July. Price is now testing a key zone, acting as support. If it holds, we could see more bullish momentum, especially with the triangle breakout. A break above 3.20 signals further upside.
If not, a retest of lower levels like the accumulation zone is possible. Watch for confirmation at this level.
DYOR, NFA

ETHUSD falling resistance retest?The ETHUSD remains in a bullish trend, with recent price action showing signs of a breakout within the broader uptrend.
Support Zone: 4,395 – a key level from previous consolidation. Price is currently testing or approaching this level.
A bullish rebound from 4,395 would confirm ongoing upside momentum, with potential targets at:
4,670 – initial resistance
4,770 – psychological and structural level
4,860 – extended resistance on the longer-term chart
Bearish Scenario:
A confirmed break and daily close below 4,395 would weaken the bullish outlook and suggest deeper downside risk toward:
4,330 – minor support
4,250 – stronger support and potential demand zone
Outlook:
Bullish bias remains intact while the ETHUSD holds above 4,395. A sustained break below this level could shift momentum to the downside in the short term.
This communication is for informational purposes only and should not be viewed as any form of recommendation as to a particular course of action or as investment advice. It is not intended as an offer or solicitation for the purchase or sale of any financial instrument or as an official confirmation of any transaction. Opinions, estimates and assumptions expressed herein are made as of the date of this communication and are subject to change without notice. This communication has been prepared based upon information, including market prices, data and other information, believed to be reliable; however, Trade Nation does not warrant its completeness or accuracy. All market prices and market data contained in or attached to this communication are indicative and subject to change without notice.

Ethereum Beautiful RetestQuick Update :
- Remember what i always insist on :
" Resistances often tend to become supports, and supports often turn into resistances "
- You don’t need ten indicators to find the way, keep your chart simple. Indicators are just supplements, helping confirm when you already have a good chance of being right.
- The target for ETH remains unchanged, it could reach around 15,000 or even higher accordling to Fibonnacci.
Be Ready for Uptober
Happy Tr4Ding !

ETH/USDT | ETH Weekly Setup – Strong Demand Pushes Toward $6K!By analyzing the Ethereum chart on the weekly timeframe, we can see that after entering the $3,800 demand zone, ETH gained strong buying pressure and reached the $4,200 and $4,600 targets.
Currently, Ethereum is trading around $4,500, up about 19%, and I expect further bullish movement soon. The next upside targets are $4,950, $5,500, and $6,000.
THE LATEST TA :
Please support me with your likes and comments to motivate me to share more analysis with you and share your opinion about the possible trend of this chart with me !
Best Regards , Arman Shaban
