MYX: History Repeats – Will We See Another Boom?LSE:MYX has been following a clear accumulation pattern, with a sharp rally after each phase. Currently in a similar setup, the price is consolidating, and if history repeats, we could see another breakout soon.
Keep an eye on this, as the next move could be significant.
DYOR, NFA
#PEACE
Ethereum (Cryptocurrency)

Why Gen X Struggles with Crypto?Why does Gen X struggle with crypto?
Because they’re used to the stock market system, where ownership is recorded by a central registry and trades that are tied to a specific exchange.
In their world, you typically should buy through Nasdaq in this example and expect to sell through Nasdaq. But with Bitcoin or other cryptocurrencies, the blockchain itself is the registry, which means you can buy on one platform and sell on another freely. That shift—from centralized exchanges to decentralized settlement—is what makes crypto hard to grasp.
Mirco Bitcoin Futures and Options
Ticker: MBT
Minimum fluctuation:
$5.00 per bitcoin = $0.50 per contract
Disclaimer:
• What presented here is not a recommendation, please consult your licensed broker.
• Our mission is to create lateral thinking skills for every investor and trader, knowing when to take a calculated risk with market uncertainty and a bolder risk when opportunity arises.
CME Real-time Market Data help identify trading set-ups in real-time and express my market views. If you have futures in your trading portfolio, you can check out on CME Group data plans available that suit your trading needs www.tradingview.com

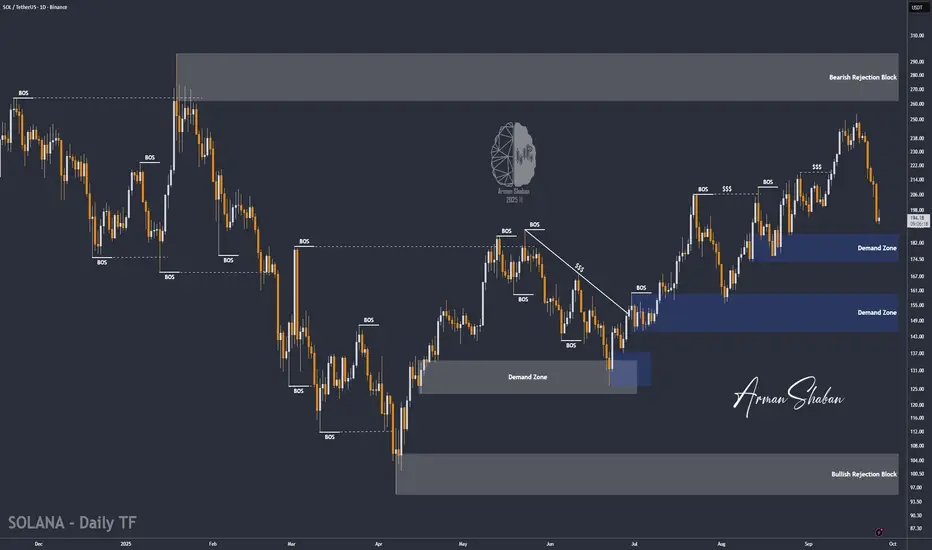
SOL/USDT | Solana Correction Could Spark Rally to $262 (READ)By analyzing the Solana chart on the daily timeframe, we can see that the price has continued its correction and is now trading around $194. As you can see, it’s getting close to the $173–$186 demand zone, and we need to watch whether this zone can trigger new buying pressure.
Personally, I expect a strong reaction from this area. If the price stabilizes here and shows the first signs of growth, the possible upside targets will be $205, $230, $242, $254, and $262.
Please support me with your likes and comments to motivate me to share more analysis with you and share your opinion about the possible trend of this chart with me !
Best Regards , Arman Shaban
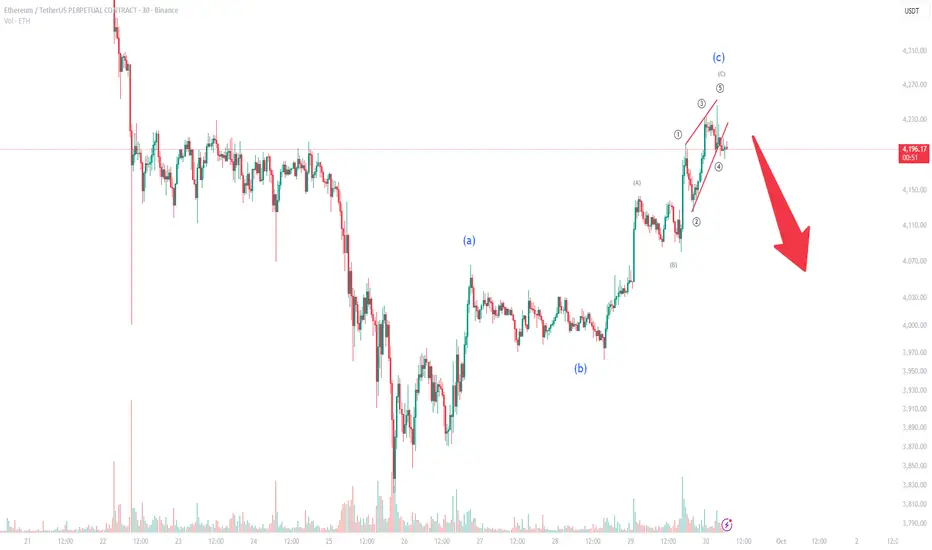
Ethereum Elliott Wave Update: Correction Ahead?Ethereum has recently completed the final leg of its ABC corrective structure, with the C-wave forming as a clear ending diagonal. This technical pattern often signals exhaustion in the current upward move and hints at a potential reversal.
With the structure now completed, a corrective move is likely. Current price action suggests that Ethereum could retrace toward the $4,000 support region, which aligns with both technical targets and key psychological levels.
📉 Trading Outlook:
Short-term traders should be cautious of potential downside volatility.
A corrective wave into the $4,000 zone may offer opportunities for repositioning or new entries depending on market reaction.
Risk management remains essential, as invalidation of the diagonal would occur if ETH pushes significantly higher without correction.
In summary, Ethereum’s Elliott Wave count points toward a possible short-term pullback before the broader trend becomes clearer. Traders should keep a close eye on the $4,000 level for signs of support and potential bullish re-engagement.
Eth/Usd - Bearish Reversal After Resistance Rejection This chart shows the recent price movement of Ethereum (ETH) against the U.S. Dollar on the 15-minute timeframe. The market initially found strong support in the green zone at the bottom, where price reversed and started moving upwards. This area marked the beginning of a bullish trend, confirmed by breaks of structure (BOS) and a change of character (CHoCH)—indicating a shift from bearish to bullish momentum.
Following this, ETH made a strong bullish move, breaking past previous highs and entering a resistance zone marked in blue. However, once price entered this resistance area, it began to slow down and form what is labeled a “Weak High”, meaning buyers were losing strength and struggling to push price higher.
The chart highlights a potential short trade setup: If a candle closes below the marked support level just under the resistance zone, it would suggest the start of a bearish move. In that case, the suggested trade is to enter a short position and aim for the lower support area (target zone) where the price may again find demand.
This setup reflects a possible trend reversal from bullish to bearish in the short term, especially if price fails to maintain above the resistance and breaks the nearby support.

EtherFi ETH.fi price analysis⁉️ Increased trading volumes, shrinking growth candlesticks, and a trend line "overhang" - for us, these factors indicate the likelihood that a correction is near.... And for you?
The #ETHfi price shot up nicely thanks to promising updates to the #Ethereum ecosystem, about which we write a few posts early.
🟢 And of course, there are further prospects for the growth of the #Etherfi project, because now the capitalization is only $375 million.
🔴 But still, in our opinion, the price of OKX:ETHFIUSDT would still be suitable to slightly correct to $0.84-0.74-0.64, whoever likes which figure)
🔝 And from there, with new strength, break through the trend to new heights.
_____________________
Did you like our analysis? Leave a comment, like, and follow to get more

ETH 1H Analysis - Key Triggers Ahead | Day 29❄️ Welcome to the cryptos winter , I hope you’ve started your day well.
⏰ We’re analyzing ETH on the 1-Hour timeframe .
👀 On the 1-hour chart , After breaking lower resistance zones, ETH started a strong bullish leg toward higher resistance. It reacted to these levels but moved upward with micro-buyer support. Currently at $4323, a key seller ticker zone—breaking this could push ETH higher. Note: Trend shows some weakness; sell candles are engulfed but smaller. Over 90% of holders are in profit, causing frequent stop-hunts on selling pressure.
🧮 RSI: After moving from near oversold to overbought, RSI is cooling near the 70 level. With increased long volatility, multiple buy positions could form, but rejection here may lead to a correction. Key static resistance is 70; swing support is at 50.
🕯 Volume & Candles: Recent candle size and volume surged as buyers entered, but approaching $4300 resistance shows trend weakness. Candle size decreased; profit-taking and minor pullbacks are possible. For trend continuation, higher volume and repeated buying pushing ETH toward overbought are needed.
📊 Liquidation Heatmap : Unlike BTC, long and short orders cluster sparsely, forming max-pain zones. ETH approaching $4380 could trigger a short squeeze and remove the seller ticker, pushing toward $4500. Next long max-pain is $4246, with lower support around $4100. ETH is in a near-decision zone with one bullish leg.
💸 ETHBTC Pair Currently in a trading range; the floor is Maker Buyer Zone , the ceiling is Taker Seller Zone. Price bounced well from the floor. High concentration of longs and shorts makes range boundaries critical—breaking either could trigger a sharp move. Price is near 0.037 resistance, RSI close to swing resistance. Buyer and whale support could enable another bullish leg; rejection may slightly increase risk of range breakdown.
🧠 Focus on BINANCE:ETHBTC wait for exit from the trading range, then check ETH/USDT. Often aligns with BTC dominance drops. Selling volume in ETHBTC is decent; if whales add volume, this setup provides optimal trade duration.
↗️ Risky Long Scenario: Break 0.037 resistance ETHBTC, BTC dominance drop, breaking ETH/USDT seller ticker, RSI stabilizes in overbought. Small stop-loss; trade is risky but viable.
📉 High-Risky Short Scenario: Rejection from current zone, ETH/BTC rejection, swing rejections, indecision candles multi-timeframe, SMA7 touch, and rising sell volume could signal short positions.
❤️ Disclaimer : This analysis is purely based on my personal opinion and I only trade if the stated triggers are activated .

This month Will Define This Entire Crypto Cycle🎯 October Just Started — And It Might Define This Entire Crypto Cycle 📈
Happy October, everyone — a month with a powerful pattern.
If history repeats, this could be a defining moment:
2017 saw a 5x BTC rally in 60 days,
2021 delivered a 2.5x in just 45 days.
Now it’s 2025 , and we’re watching the charts line up once again. 🔁
We’ve been long Bitcoin since two days ago, right off the support at the bottom of the channel — a level we’ve tracked since March 14, 2023 .
That same chart gave us:
42K (hit summer 2023)
46K (initial rejection, later support)
And now, we’re targeting 127,370 → 138K–140K as part of the final macro wave. 🚀
Ethereum is showing strength too. From a solid buy zone near 4,000 , I still believe the next key levels are 6,443 and 10,364 .
Altcoins? Let’s talk dominance:
Bitcoin Dominance is still high (~58%) but could drop toward 56.91 — giving room for alts to breathe.
Ethereum Dominance remains in a clear descending channel, with a clean target of 18.29% dominance.
📊 We’ve revisited Ethereum vs. BTC charts, and I remain long ETH here with a 0.06 BTC target.
Other setups:
Solana support at 204.81 , targets 240 and 276 .
XRP ? I remain cautious — still preferring ETH over XRP based on recent cycles.
Total Market Cap still shows bullish structure, aiming for 4.8T and later 6.5T .
We’ve seen the October pattern repeat across cycles. While the exact altcoin winners change (XLM & XRP in 2017, ETH in 2021), the macro truth remains:
Bitcoin tends to lead — and October tends to explode.🔥
Thought of the Day 💡
“Cycles evolve, but the rhythm remains. Each October is a chance — not a promise. But charts give us a map, and right now, the map points up.”
Disclaimer
I share market views for educational and entertainment purposes only. This is not financial advice. I am not a licensed advisor. Trade at your own risk and always manage your capital responsibly.
One Love,
The FXPROFESSOR 💙
ps. it's a video..watch it and let me know your thoughts

U.S. Government shuts down; Crypto rallies on uncertaintyU.S. Government shuts down; Crypto rallies on uncertainty
The U.S. government officially shut down on October 1, 2025, after Congress failed to agree on a budget. Disputes over spending and healthcare left agencies including the Fed, SEC, and CFTC paralyzed, delaying jobs and inflation data as well as ETF approvals for Solana and XRP.
Bitcoin, Ethereum, and other cryptocurrencies gained on Wednesday, with ETH up 4.2% to $4,330. Analysts said digital assets may be benefiting from pressure on the U.S. dollar, often seen as a trigger for crypto inflows.
Still, a prolonged shutdown could stall Fed rate-cut hopes by blocking key data releases. With borrowing costs already high, cryptos could face headwinds if the impasse drags on.

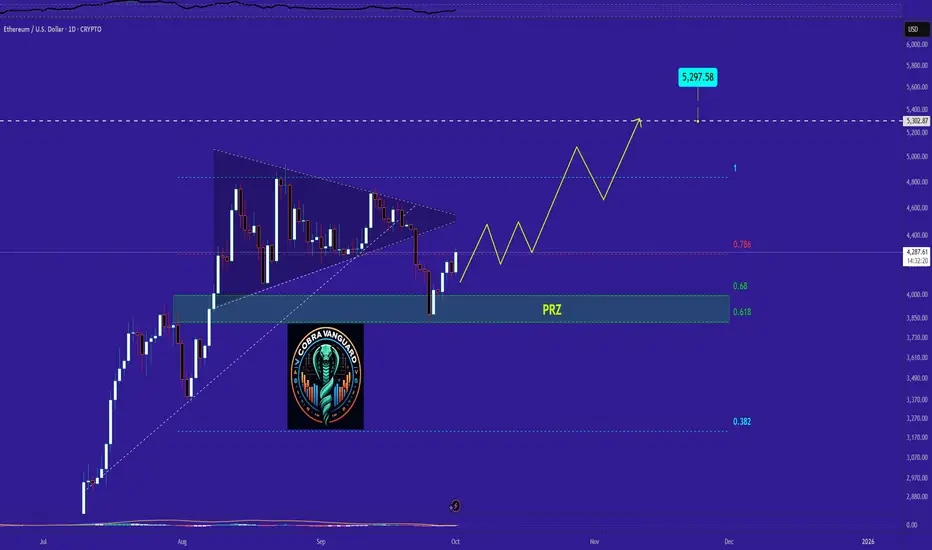
"ETH Analysis" (Update)The price can easily reach the shown targets from here.
Best regards CobraVanguard.💚
PREVIOUS ANALYSIS
Symplegades Part II – Ethereum at the Threshold of Breakout or B⚔️🌉 Symplegades Part II – Ethereum at the Threshold of Breakout or Breakdown 💥🧭
In the previous post, we explored Ethereum’s mythical challenge — the Symplegades, or Clashing Rocks. That post resonated, and now… here comes Part II.
ETH is once again caught in a narrowing passage, this time defined by:
📌 $2,805 – $2,911 resistance overhead
📌 $2,616 – $2,565 support just below
💡 Pectra could be the fuel to break out — or just another wave that crashes on the rocks. The chart shows the potential for both:
➡️ A clean breakout could spark a move to “Destination 1” (~$4.8K)
⚠️ A rejection here might drag us back under $2.6K, even toward $2.1K and $1.8K zones
The Pectra breakout box is clear. But the market won’t hand it to us easily. It rarely does.
🧠 With Vitalik still “asleep,” it’s a tight spot. But if this move gathers momentum? We could be at the very start of Ethereum’s next wave.
📽️ The full video posted earlier today dives into this thesis and why macro + micro signals are conflicting but critical.
📊 Stay tuned — Bitcoin post is up next.
One Love,
The FXPROFESSOR 💙
Disclosure: I am happy to be part of the Trade Nation's Influencer program and receive a monthly fee for using their TradingView charts in my analysis. Awesome broker, where the trader really comes first! 🌟🤝📈

Ethereum - The $15.000 price target!🚀Ethereum ( CRYPTO:ETHUSD ) will break out now:
🔎Analysis summary:
Looking at the higher timeframe, it is obvious that Ethereum has been consolidating for the past four years. But now, Ethereum is starting to break above the previous all time high. If Ethereum actually confirms the breakout, we are talking about an expected move of another decent +250%.
📝Levels to watch:
$15.000, $4.000
SwingTraderPhil
SwingTrading.Simplified. | Investing.Simplified. | #LONGTERMVISION

Be careful with ETHEREUM !!!Currently, our only dynamic support is the bottom of the channel. If the price respects this level, it could move upward. However, if this support is lost, the next support for Ethereum would be the PRZ (Potential Reversal Zone) area.

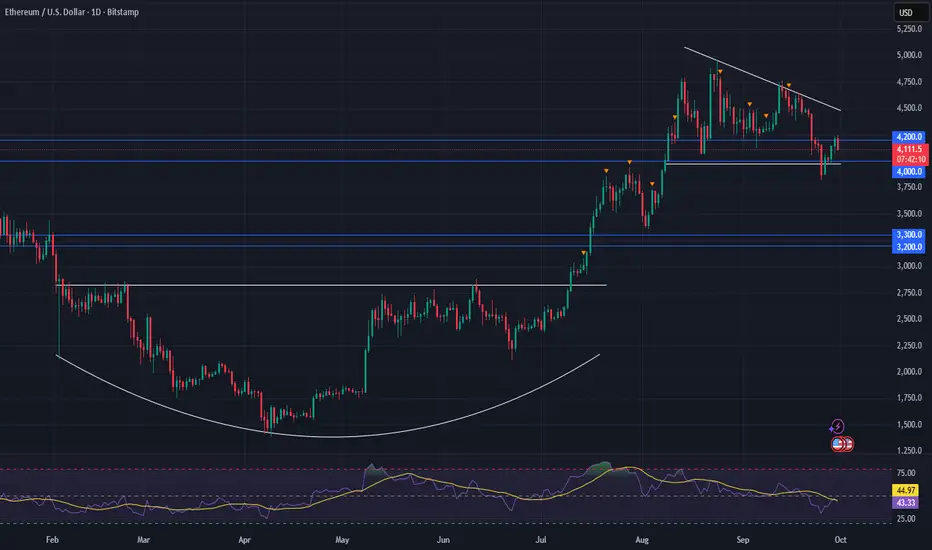
Ethereum Outlook – Key Levels in Play Amid Market JittersAfter a turbulent week across the crypto space—with volatility even bleeding into traditional equities—it's clear just how fragile sentiment remains. We’re seeing the usual overreactions: every minor selloff triggers calls that the bull market is over, despite the broader structure holding up... for now.
🔍 ETH Technical Outlook
Ethereum is retesting a major support zone between 4000–4200. This area has acted as a springboard before, but if it breaks decisively, it could flip to resistance, introducing more headwinds for bullish momentum.
Still, this may be shaping up as another dip-buying opportunity—if macro conditions remain stable and Bitcoin doesn't lead a broader breakdown.
🧱 Next Support Zone
If 4000–4200 doesn’t hold, the next major support zone is 3200–3300. This aligns with previous accumulation levels and would likely draw interest from larger buyers if price gravitates down there.
🔺 Chart Pattern Watch: Triangle Shift
We’ve been tracking a triangle formation, which now appears to be shifting from a symmetrical triangle to a descending triangle—a change in tone, but not yet a deal-breaker for the bulls.
The longer-term target remains intact: we’re still eyeing the 5700–5800 range, assuming structural support zones continue to hold and volume confirms any breakout.
ETHUSD supported at 3,975The ETHUSD remains in a bullish trend, with recent price action showing signs of a corrective pullback within the broader uptrend.
Support Zone: 3,975 – a key level from previous consolidation. Price is currently testing or approaching this level.
A bullish rebound from 3,975 would confirm ongoing upside momentum, with potential targets at:
4,290 – initial resistance
4,390 – psychological and structural level
4,460 – extended resistance on the longer-term chart
Bearish Scenario:
A confirmed break and daily close below 3,975 would weaken the bullish outlook and suggest deeper downside risk toward:
3,910 – minor support
3,830 – stronger support and potential demand zone
Outlook:
Bullish bias remains intact while the ETHUSD holds above 3,975. A sustained break below this level could shift momentum to the downside in the short term.
This communication is for informational purposes only and should not be viewed as any form of recommendation as to a particular course of action or as investment advice. It is not intended as an offer or solicitation for the purchase or sale of any financial instrument or as an official confirmation of any transaction. Opinions, estimates and assumptions expressed herein are made as of the date of this communication and are subject to change without notice. This communication has been prepared based upon information, including market prices, data and other information, believed to be reliable; however, Trade Nation does not warrant its completeness or accuracy. All market prices and market data contained in or attached to this communication are indicative and subject to change without notice.

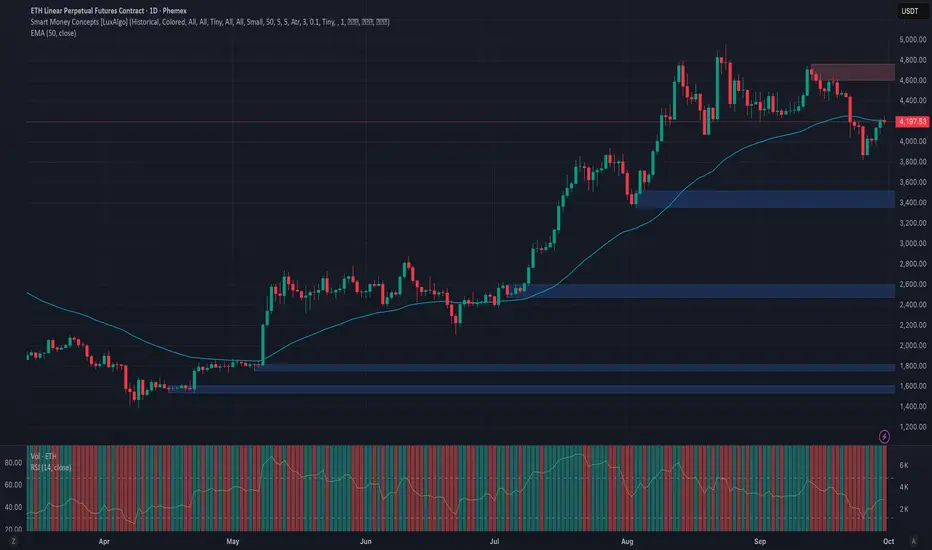
Ethereum Price Bounces Off 7-Week Low—Future Still Promising?Ethereum trades at $4,187, just under the $4,222 resistance level after rebounding from a $3,872 low. This recovery highlights buyer interest at support levels. However, the broader market remains cautious, waiting to see whether Ethereum can sustain momentum and reclaim critical price barriers.
If Ethereum breaches $4,222, it could flip this level into support, potentially extending gains. Still, breaking above $4,500 will be difficult without fresh inflows. Limited liquidity and investor hesitation could keep Ethereum rangebound, consolidating until stronger catalysts emerge in the market.
On the downside, failure to maintain support could reignite bearish sentiment. If selling intensifies, Ethereum might slip through $4,074 and retest $3,872. Such a decline would invalidate the bullish outlook.

ETH : Accumulation Before Next Big Rally??Ethereum continues to show strength on the weekly timeframe.
Weekly structure remains firmly bullish, IMO. Pullbacks are natural, but the weekly structure favors continuation.
Weekly closing about 4.2-4.3K could trigger massive rally on weekly TF.
Chart is self explanatory. This is purely my interpretation of the chart and it could go wrong.
Note: This post reflects my personal views for educational purposes. It is not financial advice. Always DYOR before making any and every decision.

ETHUSD ANALYLTICAL IDEA, FOR 30 SEP, 2025.After the quick fall below $4000, in value, the second in command on the coin market sharply went back to its original position and currently trades around $4100, but the overall direction is bullish as considered the altcoin season. But the question is, will it hold? Or continue pushing above or below well, for now, we can only sit tight on our hands, as my Bias remains bearish for the short term, and I look forward to taking sell trade positions as the price continues to push further in that direction.
As usual, my calls or analysis are based on what we see, the current Bias, and from a probability standpoint, meaning that this projection may be or may not be validated, so tread carefully, and as usual, this is not financial advice, trade responsibly.

We're setting up for the greatest Q4 for Ethereum $ETH so farMy CRYPTOCAP:ETH thesis is slowly playing out
Waiting for one more confirmation (reclaiming 4250 resistance), and we're setting up for the greatest Q4 so far for Ethereum
I'll be buying the dips with SL below the current HTF deviation low at ~3830
A bit more patience here, let it play out, don't rush it

#ETH/USDT : Bounce From Support, Eyes on $ 4128#ETH
The price is moving within a descending channel on the 1-hour frame, adhering well to it, and is heading for a strong breakout and retest.
We have a bearish trend on the RSI indicator that is about to be broken and retested, which supports the upward breakout.
There is a major support area in green at 3950, which represents a strong support point.
We are heading for consolidation above the 100 moving average.
Entry price: 4012.
First target: 4050.
Second target: 4084.
Third target: 4128.
Don't forget a simple matter: capital management.
When you reach the first target, save some money and then change your stop-loss order to an entry order.
For inquiries, please leave a comment.
Thank you.

Phemex Analysis #107: Pro Tips for Trading Ethereum (ETH)Ethereum (ETH) has pushed back into the spotlight after shaking off early‑summer weakness and reclaiming the psychological $4,000 handle. With price now hovering near $4,200, buyers have stepped back in and the daily chart shows a clean sequence of higher lows—story beats that often precede a decisive move. The question on every trader’s mind: does ETH press higher from here, or does it need one more reset before the next leg?
Possible Scenarios
1) Bullish Breakout — momentum carries above nearby supply
If ETH can extend above the immediate supply zone (watch the $4,300–$4,350 band) on rising volume, a trend continuation opens toward $4,500 and a stretch into $4,800.
Pro Tips:
Entry: Look for a strong daily close through $4,350 or a break‑and‑retest that holds as support.
Risk: Initial stop below the breakout zone (~$4,000), then trail under higher lows.
Profit‑taking: Scale out into $4,500 and $4,800 while leaving a runner if momentum expands.
2) Range & Accumulation — base building above $4,000
ETH may continue to coil between $4,000 support and $4,350 resistance while the market digests macro cues and liquidity rotates across majors.
Pro Tips:
Plan the box: Accumulate near $4,000, lighten up into $4,300–$4,350.
Avoid the middle: Wait for edges; don’t chase mid‑range noise.
Watch volume: Expansion at range edges often telegraphs the break direction.
3) Bearish Pullback — liquidity sweep into deeper supports
Failure to hold $4,000 on heavy sell volume invites a deeper flush toward $3,750 and, in a heavier risk‑off tape, $3,500.
Pro Tips:
Defense first: Cut risk on a decisive daily close below $4,000.
DCA with discipline: Long‑term bulls can consider staggered bids only after stabilization (shrinking candles, waning sell volume, higher‑low attempts) near $3,750 / $3,500.
Re‑entry tells: Look for momentum divergences or a strong reclaim of $4,000 to re‑engage.
Conclusion
ETH sits at a pivotal zone with a clear if/then map:
If $4,350 breaks and holds → ride the trend toward $4,500–$4,800.
If the range persists → harvest the $4,000–$4,350 box with tight risk.
If $4,000 fails → wait for stabilization at $3,750 / $3,500 before redeploying.
Anchored by deep liquidity, relentless builder activity, and a maturing staking and L2 ecosystem, Ethereum remains the market’s bellwether. Trade the levels, respect the tape, and let structure—not emotion—drive your decisions.
🔥 Tips:
Armed Your Trading Arsenal with advanced tools like multiple watchlists, basket orders, and real-time strategy adjustments at Phemex. Our USDT-based scaled orders give you precise control over your risk, while iceberg orders provide stealthy execution.
Disclaimer: This is NOT financial or investment advice. Please conduct your own research (DYOR). Phemex is not responsible, directly or indirectly, for any damage or loss incurred or claimed to be caused by or in association with the use of or reliance on any content, goods, or services mentioned in this article.
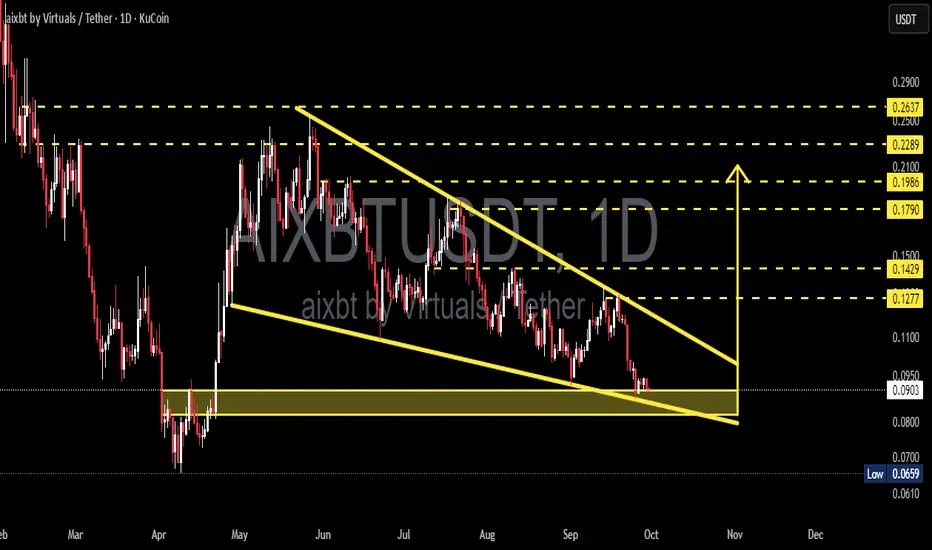
AIXBTUSDT — Falling Wedge at Demand Zone: Reversal or Breakdown?Analysis
AIXBT/USDT is currently trading within a Falling Wedge pattern on the daily timeframe, a classic setup that often signals a potential bullish reversal if confirmed by an upside breakout.
Right now, price is sitting exactly at the 0.08–0.09 demand zone, a key support area that has held multiple times before. This makes the current level a critical decision point: will we see a strong rebound (bullish reversal) or a breakdown to new lows?
---
Technical Structure
Main Pattern: Falling Wedge → generally bullish once a breakout occurs.
Key Demand Zone: 0.08–0.09 (currently being tested).
Next Major Support if Breakdown: 0.0659 (previous swing low).
Resistance / Upside Targets:
0.1277
0.1429
0.1790
0.1986
0.2289
0.2637
---
Bullish Scenario
Price holds above 0.08–0.09 and forms a reversal candle (hammer, bullish engulfing, pin bar).
Breakout confirmed with a daily close above the wedge trendline + rising volume.
Upside targets: 0.1277 → 0.1429 → 0.1790, with further extension possible toward 0.1986–0.2289.
Example aggressive setup:
Entry ~0.085, Stop ~0.078.
First target 0.1277 → offering R:R above 5, attractive for swing traders.
---
Bearish Scenario
A daily close below 0.08 invalidates the demand zone.
Breakdown opens the path to 0.0659 as the first target.
If that fails, the psychological level around 0.05 becomes the next liquidity zone.
Example short setup (margin traders only): Entry 0.079, Stop 0.088, Target 0.0659 → R:R ~1.4.
---
Falling Wedge Insight
This wedge reflects weakening selling pressure, with lower highs and lower lows converging toward the apex. Often, such setups resolve with a strong move upward, especially after prolonged downtrends. However, traders should beware of false breakouts — confirmation via daily close + volume + successful retest is essential before scaling into larger positions.
---
Strategy & Risk Management
Aggressive: Buy within 0.08–0.09 demand zone with a tight stop below 0.078.
Conservative: Wait for a confirmed breakout above the wedge (~>0.13) and enter on retest.
Risk management: Limit exposure to 1–3% per trade; scale out profits at resistance levels.
Note: Low-cap altcoins can be volatile with wide spreads — use limit orders and watch liquidity closely.
---
Conclusion
AIXBT/USDT is at a critical inflection point. With a falling wedge pattern and price sitting right inside the 0.08–0.09 demand zone, the market is preparing for a decisive move.
If support holds: strong chance of reversal toward higher resistances.
If support breaks: expect deeper correction to 0.0659 or lower.
In short, AIXBT is not in ordinary sideways action — it’s at a crossroads where the next move could define its medium-term trend.
---
#AIXBT #AIXBTUSDT #Crypto #Altcoin #TechnicalAnalysis #FallingWedge #Support #Breakout #BullishScenario #BearishScenario #RiskManagement
ETH/USD: The Levels Nobody’s Talking AboutETH looks quiet… but the chart is coiling around decision zones.
A) A break of $4,606 clears the path to $5,500.
B) A slip below $3,800 opens the door to $3,669, with a deeper risk toward $2,200.
What most traders miss: it’s not about predicting which level hits first… it’s about understanding what those breaks mean for positioning.
I won’t post a full strategy here, but I’ll say this: the difference between smart money and retail is that smart money prepares before these levels break.
Curious to hear; how are you positioning if ETH chooses either path?
