ETH 4H trade Idea Here is an idea to trade Ethereum on 4 hour TF. Entry and Exit points are given. NFA DYOR
Ethereum (Cryptocurrency)

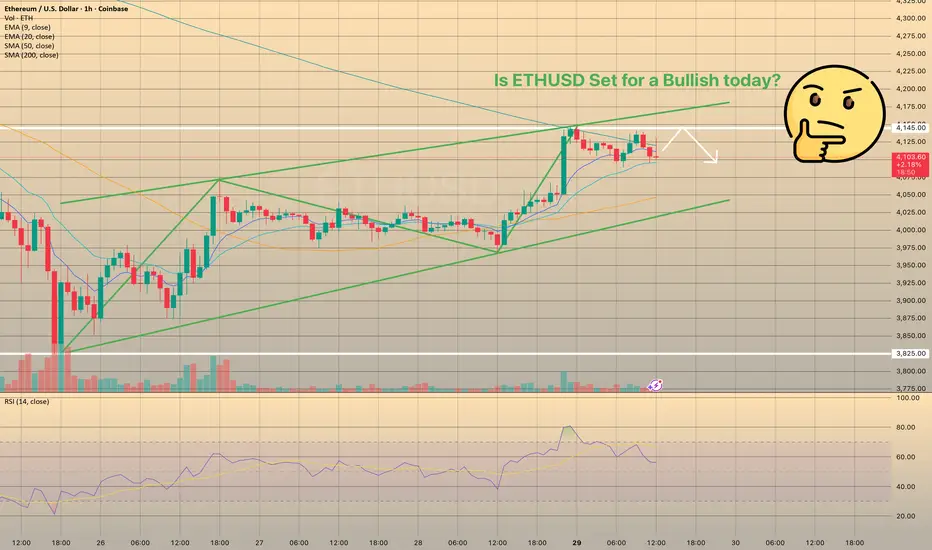
Ethereum outflows point to bullish setup above $4KEthereum outflows point to bullish setup above $4K
Altcoins are surging, and Ethereum has reclaimed the spotlight after crossing the key $4,000 mark. Trading volume is rising, and ETH is holding steady near $4,100 after a relatively calm weekend, suggesting stability following last week’s volatility. Analysts view $4,000 as a crucial support level—if bulls defend it, ETH could soon retest higher levels.
One factor supporting this outlook is a steady decline in Ethereum balances on spot exchanges. A CryptoQuant report shows coins are being withdrawn into self-custody and staking, reducing sell-side liquidity. Historically, such outflows have set the stage for rallies as demand absorbs limited supply.
Short positioning also adds fuel: more than $11 billion in shorts could be forced to cover if ETH breaks above $4,200, potentially accelerating gains.
Still, analysts warn that supply constraints alone aren’t enough—strong buyer inflows are needed to sustain momentum. The next few days will be key, with ETH’s ability to hold above $4,000 serving as a test for the next leg of the rally.
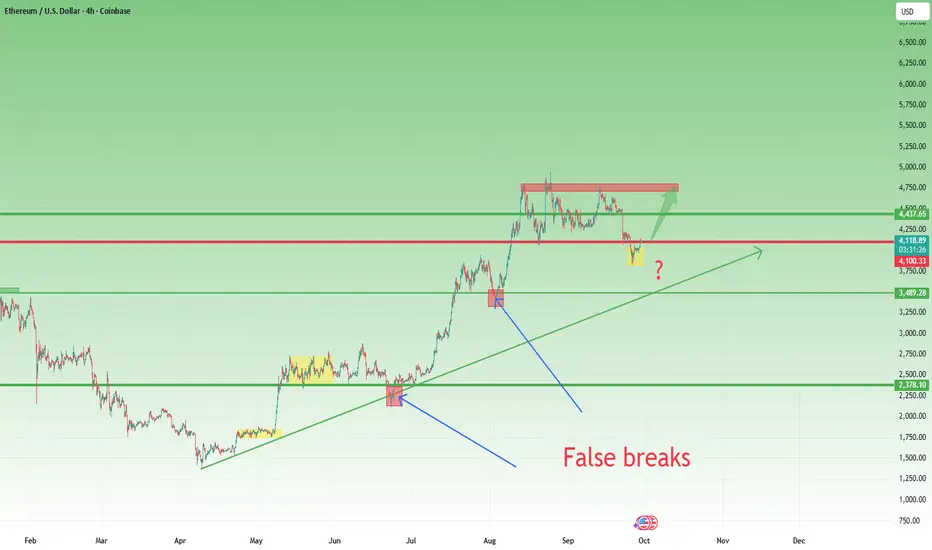
ETH Repeats the Pattern – $4800 Next Target?In my previous ETH analysis, I pointed out that while the price broke below the $4100 technical support and the $4000 psychological level, this move could represent a false break. But for this scenario to be valid, the market needed confirmation.
Since then, ETH has stabilized above $4000 and is now hovering around the $4100 level again.
📌 Looking back at the April rally (from $1400 upwards), we can already identify two similar cases of temporary breakdowns followed by strong recoveries.
• Each time, the market shook out weak hands before resuming the bullish leg.
• This repetition builds the case for another potential rebound, even if no outcome is ever guaranteed.
⚡ Trading Outlook:
• Bullish scenario: I expect ETH to rebound towards the $4400 zone, with the possibility of a retest of the $4800 resistance.
• Invalidation: A daily close back under $4000 would cancel this bullish setup and reopen the downside risk.
• Confirmation: A strong daily close near the highs of the day will add conviction to the bullish continuation.
👉 For now, the structure remains intact, and the bias stays bullish. The key levels to watch are $4000–4100 supports and $4400–4800 for resistance. 🚀
ETH TA 29.09On Thursday, we bounced well from the important zone with HTF divers and are already back above 4k. Now Ether desperately needs to break through the R1 zone of 4215-4250, and then there won't be any important resistances until 4600+. Currently, locally, we're trading sideways at 3980-4200+. Losing the lower boundary of the sideways range is undesirable and very dangerous for further growth, plus there's a good low there, albeit a Voskresensk one. And the nearest decent support is at 3500.

ETHUSD support at 3,810The ETHUSD remains in a bullish trend, with recent price action showing signs of a corrective pullback within the broader uptrend.
Support Zone: 3,810 – a key level from previous consolidation. Price is currently testing or approaching this level.
A bullish rebound from 3,810 would confirm ongoing upside momentum, with potential targets at:
4,115 – initial resistance
4,266 – psychological and structural level
4,356 – extended resistance on the longer-term chart
Bearish Scenario:
A confirmed break and daily close below 3,810 would weaken the bullish outlook and suggest deeper downside risk toward:
3,690 – minor support
3,570 – stronger support and potential demand zone
Outlook:
Bullish bias remains intact while the ETHUSD holds above 3,810. A sustained break below this level could shift momentum to the downside in the short term.
This communication is for informational purposes only and should not be viewed as any form of recommendation as to a particular course of action or as investment advice. It is not intended as an offer or solicitation for the purchase or sale of any financial instrument or as an official confirmation of any transaction. Opinions, estimates and assumptions expressed herein are made as of the date of this communication and are subject to change without notice. This communication has been prepared based upon information, including market prices, data and other information, believed to be reliable; however, Trade Nation does not warrant its completeness or accuracy. All market prices and market data contained in or attached to this communication are indicative and subject to change without notice.

28/09/25 Weekly OutlookLast weeks high: $115,537.51
Last weeks low: $108,606.86
Midpoint: $112,072.19
As BTC continued to trend down post FOMC the key HTF level of $108,500, after some chop at this level a late rally on Sunday has pushed BTC back to the Midpoint of the range for this week.
As September comes to a close we are at the point where banks window dress their balance sheets by de-risking going into Q4. Banks taking cash out of the market to appear there is less risk and more liquid to hide their true risk over the quarter. This lowers liquidity and for this reason I do not expect the bulls to be out of the woods yet and the weekly low ($108k) could be under attack again before the week closes.
The story is the same for much of the altcoin market, after continued downtrend majors are bouncing off key HTF S/R levels but conviction is still low due to quarter end.
This week I am looking at how BTC finishes the week once the month/quarter end is out of the way. If their is renewed optimism October.
In terms of seasonality October has an average return rate of 21.89% since 2019.
Should price break below weekly low the bullish HTF trend would be questioned and would open the door to a deeper correction. With the 4-year cycle predicted to end in late October there would be huge talk of the cycle repeating and the bear market beginning.
Good luck this week everybody!

Ethereum New Update (12H)On the chart, we have a bearish CH and a resistance SWAP zone has formed. This SWAP zone has been broken downward, and now on the pullback to this area, we can look for sell/short positions. As long as the price does not reclaim and hold above this zone, the bearish outlook on Ethereum remains valid
If the price strongly breaks TP1 to the downside, a much deeper drop may occur
A daily candle closing above the invalidation level would invalidate this analysis
For risk management, please don't forget stop loss and capital management
When we reach the first target, save some profit and then change the stop to entry
Comment if you have any questions
Thank You

Never miss Eth on 4160 !I am all eyes on Eth to break my trigger line (around 4230). then the buy setup on 4160 will be activated :)
First midterm target --> 6300

ETHUSD - Weekly Indicator ShiftWeekly chart for ETHUSD, it can be seen that the Gaussian Channel indicator has shifted from bearish to bullish or red to green on this timeframe.
Looking really good for Ethereum heading into a possible strong alt coin season.

#ETHUSDT (4H Chart)#ETHUSDT
(4H Chart)
🔹️ Ethereum Analysis 🔹️
For Ethereum, we have two important resistance levels that could lead to a significant correction:
🔴 Resistances (marked with red boxes):
🎯 First range: 4260 to 4352 USD
🎯 Second range: 4550 to 4635 USD
Supports:
🟡 Yellow box (short-term support): 3525 to 3445 USD — likely to be touched if Bitcoin reaches 100,000 USD
🟢 Green box (main support): 2800 to 2700 USD
💡 Summary:
We expect a small initial rise, then a correction down to the yellow box, and after the yellow box is touched, this analysis will be updated.
🚀 If you enjoyed this analysis, please give it a boost 💙
And to not miss any new analyses or setups, make sure to follow me 📊
🆔️ @Rasoolahmadi

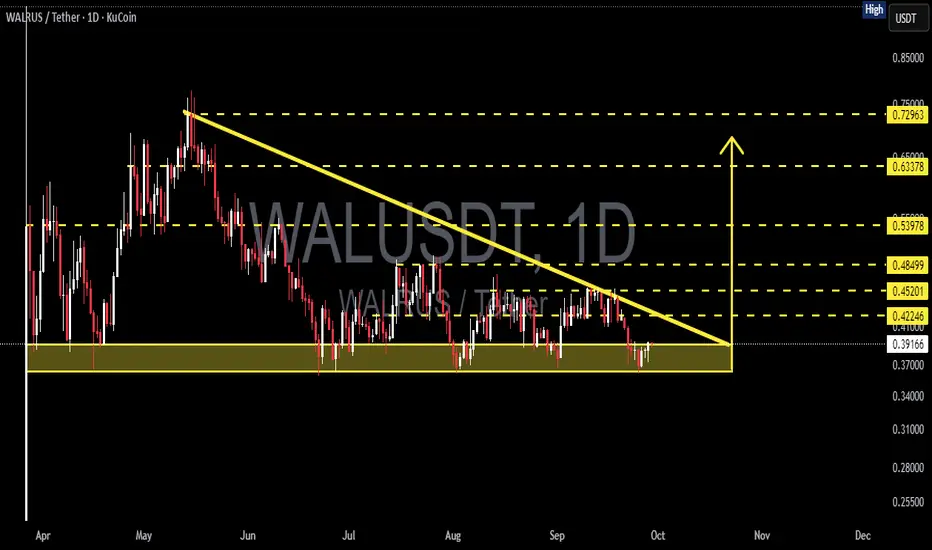
WALRUS/USDT – Descending Triangle at Critical Support!WALRUS/USDT is currently trading within a descending triangle pattern on the daily timeframe. This structure is formed by a series of lower highs pressing from above (descending trendline), while the 0.36–0.40 support zone (yellow box) acts as a major floor below.
This highlights strong selling pressure from the top, but at the same time buyers are still holding the support area. The price is now consolidating within a narrowing range, waiting for a decisive breakout that will dictate the next big move.
---
Bullish Scenario (Upside Breakout)
If WALRUS can break above the descending trendline with a daily close above 0.422–0.452, this descending triangle may flip into a bullish reversal. That would signal buyers regaining control.
Bullish Targets:
Target 1: 0.485
Target 2: 0.539
Target 3: 0.633 – 0.729 (if momentum continues strongly)
Validation: breakout with high volume + successful retest of breakout level as support.
---
Bearish Scenario (Downside Breakdown)
If WALRUS closes daily below 0.36, the descending triangle will confirm as a bearish continuation. This shows sellers overwhelming buyers at support.
Bearish Targets:
Target 1: 0.31 – 0.30
Target 2: 0.255 (long-term demand zone)
Validation: strong bearish daily close with volume, without quick recovery above 0.36.
---
Pattern & Interpretation
The descending triangle often acts as a bearish continuation pattern.
But in strong support zones, it can turn into a reversal pattern if an upside breakout occurs.
WALRUS is at a decision point: the tighter the consolidation, the bigger the potential explosive move once a breakout happens.
---
Conclusion
Bias: Neutral → Bearish as long as WALRUS remains below the descending trendline.
Bullish confirmation: daily close above 0.422–0.452 → potential rally to 0.485 – 0.539.
Bearish confirmation: daily close below 0.36 → possible drop to 0.31 and 0.255.
Traders should wait for volume-backed breakout confirmation before positioning. WALRUS is now at a make-or-break level: will it bounce or break?
---
#WALRUS #WALRUSUSDT #CryptoAnalysis #TechnicalAnalysis #DescendingTriangle #Breakout #SupportResistance #PriceAction
But Ser, Wen Moon? Wen Alt Season?But Ser, Wen Moon? Wen Alt Season?
Why 2024 Was Your Alt Season (And Why the Next One Is Years Away)
The Uncomfortable Truth: Alt Season Already Happened
Everyone’s still asking “wen alt season?” The painful reality: it already came and went in 2024.
The Altcoin Season Index hit 88 in Dec 2024 - its highest since 2021 - before collapsing to 12 by April 2025 - that was your alt season. The memecoin mania, the AI‑narrative pumps, the handful of legitimate winners like CRYPTOCAP:HBAR , CRYPTOCAP:SOL (at the time of writing still up 10x from 2023 lows), CRYPTOCAP:SUI , COINBASE:SEIUSD , CRYPTO:INJUSD , CRYPTO:RENDERUSD and a few others - that was it.
CRYPTOCAP:TOTAL3ES It peaked symbolically when the President of the United States launched his own memecoin $BINANCE:TRUMPUSDT.
Pause and think about that for a minute: when the most powerful person on earth is shilling crypto memes, you’re not early anymore - you’re late.
Most people missed it because they were waiting for a 2017‑style blow‑off where everything pumped indiscriminately. Instead, 2024 was surgical: only the strongest assets with real utility or meme community power survived. The rest 95-99% of the market - stayed the same laughable junk it’s always been. This wasn’t broad‑based euphoria; it was natural selection.
Why Traditional Finance Beat Crypto This Cycle
Here’s the overlooked truth: the AI rally happened at the same time as Bitcoin’s halving rally.
Faced with a choice between dead altcoins hoping for a 2021 revival or BIVA:NVDA and BMV:MSFT printing real revenue, smart money chose AI and equities over dead altcoins. Retail followed. The AI trade sucked the oxygen out of crypto, leaving most alts gasping for liquidity.
NASDAQ:NVDA added $2.2 trillion in market cap in 2024.
NASDAQ:APP surged +758%.
NASDAQ:PLTR and NASDAQ:MSFT rode AI adoption to record highs.
INDEX:ETHUSD path tells the story: it clawed back to its 2021 highs - just enough for whales to exit three years of underwater bags. Mission accomplished. Retail still waiting for $10K ETH? Game over.
In September alone, COINBASE:ETHUSD saw it largest ETF NASDAQ:ETHA outflow and this money didn't go to alts it was out of the market - Institutions don’t rotate into alts - they rotate out of crypto entirely...
The Institutional Playbook vs. Retail Delusion
The 2024–25 rally was institutional, not retail.
BlackRock’s iShares Bitcoin Trust NASDAQ:IBIT has seen $60B+ inflows since Jan 2024, holding ~756,000 BTC.
Fidelity’s CBOE:FBTC holds ~$22B.
Together, they dominate >70% of U.S. ETF flows.
When Blackrock NYSE:BLK and Fidelity CFI:FBTC buy billions in Bitcoin ETFs, they’re not chasing 100x moonshots. They’re happy with 2–3x on massive positions. In institutional terms, a 5x is a career‑making home run.
This isn’t 2017 or 2013 anymore. Crypto is a multi‑trillion dollar ecosystem where retail’s few thousand dollars are statistical noise. The old playbook - “Bitcoin pumps, then alts follow” - is dead - it assumed retail drove the cycle. Today, institutions hold the keys, and like i said they don’t rotate into your favorite altcoin. They rotate into other asset classes entirely.
The Timing Mismatch: Why Q4 Narratives Are Dead Wrong
Veterans keep calling for a Q4 2025 blow‑off top, stuck on the 2013/2017 template. But this cycle is different:
The 4th halving was April 19, 2024 - not May.
IG:BITCOIN typical 1.5‑year post‑halving peak landed in Q3 2025 (~$124K), not Q4.
The cycle is already complete.
Altcoins only thrive when IG:BITCOIN highs are fueled by retail FOMO and leverage. This cycle was powered by measured institutional accumulation. Without retail mania, alts had no fuel. The few that did pump ( CRYPTOCAP:HBAR , CRYPTOCAP:SUI , CRYPTOCAP:SOL , BINANCE:RENDERUSDT ) had real narratives or tech advantages. In a mature market, only quality survives.
The Next Real Alt Season: Q4 2026 and Beyond
Here’s the contrarian call: the next true alt season won’t arrive until Q4 2026 at the earliest.
Why? Because it will take a global financial crisis bottom, central banks printing like mad, and risk appetite returning before crypto regains its role as the speculative playground. That’s when we’ll see a decade‑long melt‑up that makes 2017 look quaint.
By then, 95% of today’s projects will be gone. Regulation will be clearer. Infrastructure will be mature. The survivors of this purge will form the foundation of the next supercycle. But first, the forest fire has to clear the dead wood.
What This Means for Your Bags
If you’re still holding 2021 altcoins waiting for a miracle, you’re fighting the last war. Smart money has rotated out. Retail is exhausted. Institutions aren’t coming to save your bags.
Most alts will bleed slowly into irrelevance - not with dramatic crashes, but with grinding decline as liquidity and attention flow elsewhere. The few survivors will be those with genuine utility, strong teams, and institutional interest. Everything else is destined for zero.
The New Playbook: Cash Is King
For the next 12–18 months, the winning strategy isn’t catching falling knives. It’s preservation of capital and patience. Hold cash. Maybe some Bitcoin as a hedge. Wait for the real bottom - when fear replaces hope and quality trades at fire‑sale prices.
The casino days are over. The market has grown up. And grown‑up markets don’t hand out infinite money glitches to anyone with an internet connection. The future belongs to those who adapt to the new rules - not those who keep playing by the old ones.
Bottom line: Alt season already happened in 2024. The next one won’t come until 2026+. Plan accordingly.

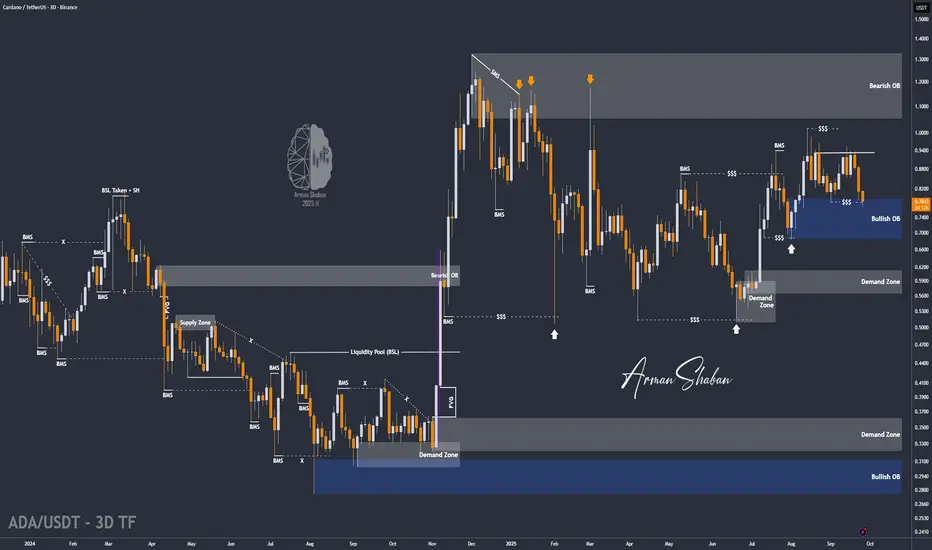
ADA/USDT | ADA Testing $0.68–$0.78 Demand – Next Pump Ahead?By analyzing the Cardano (ADA) chart on the 3-day timeframe, we can see that the price started correcting as expected and has now reached $0.78, entering the key $0.68–$0.78 demand zone. Now we need to see whether this zone can stop ADA from dropping further.
If the price holds in this strong demand area, we could expect a big bullish move. The short-term targets are $0.85, $0.95, and $1.00, while the mid-term targets are $1.05, $1.17, and $1.33.
Please support me with your likes and comments to motivate me to share more analysis with you and share your opinion about the possible trend of this chart with me !
Best Regards , Arman Shaban
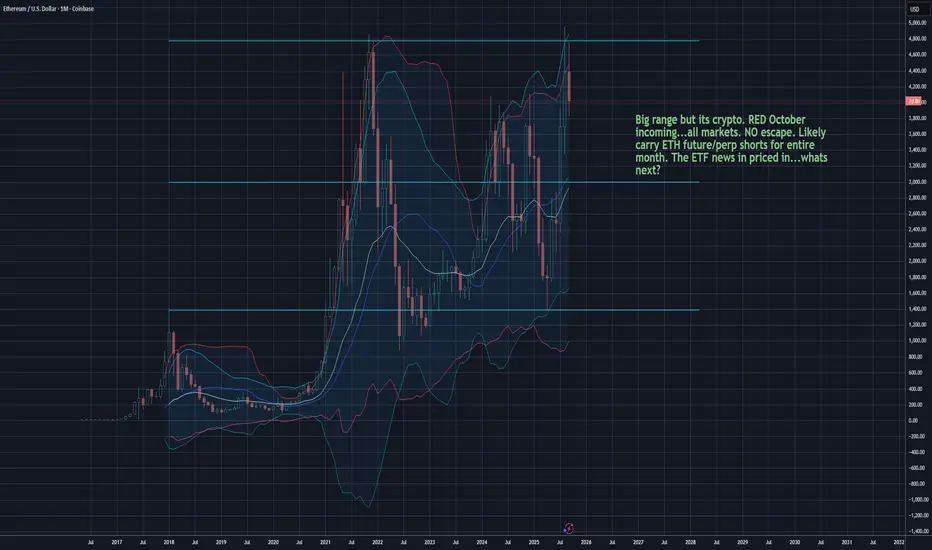
ETH so much good news baked into price...what now?Ethereum hit all time highs on many markets. Lots of excitement around wall-street adoption and staking craze. There are fewer available ETH on most exchanges. Scarcity brings astute collectors that play by different rules. Signs pointing toward a RED October for financial markets.
Rumors of a hard financial system reset continue. They have been around for 4+ years. I will short if we get back towards $4400. Expecting a hard yet short retreat.
Not financial advice & never take advice from anyone on the internet.
ETH Price Action Looks Heavy – Danger Ahead?This chart is showing a clear pattern of accumulation followed by decline. Every time price moves sideways in a box range, instead of breaking upward with strength, it rolls over into another drop.
What this tells us is that the market is using these sideways phases as resting points for sellers to reload, not buyers to take control. Until CRYPTOCAP:ETH can break out of this cycle and hold above one of these consolidation zones, the overall trend remains heavy to the downside.
DYOR, NFA
#PEACEFUL
Follow for more updates and market insights on TradingView

MUBARAK/USDT — Confluence Accumulation Zone?🔎 Overview
MUBARAK/USDT is currently testing the critical support zone (0.022 – 0.028 USDT), which aligns with a medium-term ascending trendline. This confluence makes the area a decisive “do or die” zone: either a strong rebound that may trigger a reversal, or a confirmed breakdown that could push prices much lower.
---
📍 Key Technical Levels
Current Price: ≈ 0.0298
Main Support Zone (yellow box): 0.022 – 0.028
Critical invalidation support: 0.0208
Resistances:
R1 = 0.03862
R2 = 0.04299
R3 = 0.04999
R4 = 0.06630
---
🧩 Structure & Patterns
1. Accumulation zone: price repeatedly bounced within 0.022–0.028, suggesting active buyers.
2. Ascending trendline: supports higher lows on the mid-term structure.
3. Lower highs still dominate → bulls need a breakout above 0.0386 to flip the structure.
4. Potential double bottom: a strong rejection here could mark a classic bullish reversal.
5. Breakdown scenario: a daily close below 0.022 with volume = bearish continuation toward 0.0208 → 0.0164.
---
🚀 Bullish Scenario
Confirmation signals:
Strong rejection candle (long lower wick + close above zone).
Volume expansion.
Daily close above 0.0386.
Upside targets:
TP1 = 0.03862
TP2 = 0.04299
TP3 = 0.04999
TP4 = 0.06630
Strategy:
Conservative entry on retest after rejection.
SL below 0.0208.
Scale out profits gradually.
---
⚠️ Bearish Scenario
Confirmation signals:
Daily close below 0.022 with strong volume.
Failed retest (support turns resistance).
Downside targets:
S1 = 0.02080
S2 = 0.01640
Strategy:
Cut longs if breakdown is confirmed.
Aggressive traders may short toward 0.0208 → 0.0164.
---
📑 Entry Checklist
1. Wait for daily close confirmation (not intraday wick).
2. Volume above average.
3. Successful retest (support ↔ resistance flip).
4. RSI divergence or recovery.
5. MACD bullish cross / rising histogram.
6. BTC & overall altcoin sentiment aligned.
---
🛡️ Risk Management
Risk per trade: 1–2% of total capital.
Use SL strictly below 0.0208 for longs.
Move SL to breakeven after TP1.
Accumulation zones often produce false breaks → do not enter without confirmation.
---
🌍 Market Context
Altcoins remain correlated with BTC: a BTC rebound could boost upside potential.
On-chain events (token unlocks, listings, or major news) may drive volatility.
Liquidity is thin → expect high volatility and manage position sizes accordingly.
---
📌 Conclusion
MUBARAK is at a golden zone of decision: a confirmed rejection could spark a +100% rally toward 0.066, while a breakdown would likely drag it back to 0.0208 or even 0.0164.
This is where market makers and big players decide the next major move — patience and risk control are key.
---
#MUBARAK #MUBARAKUSDT #CryptoAnalysis #Altcoins #SupportResistance #BreakoutWatch #RiskManagement

ASTERUSDT — Will Buy Zone Hold or Break?Overview
ASTER price is currently consolidating after a strong rally toward 2.42. On the 2-hour chart, we can clearly see two major highlighted areas: Buy Zone 1 (primary support) and Buy Zone 2 (deeper secondary support).
The structure still maintains a potential bullish continuation, but repeated weakness around support indicates risk of a breakdown if buyers fail to defend the current zone.
---
🔑 Key Levels
Nearest Support (Buy Zone 1): 1.75 – 1.95
Secondary Support (Buy Zone 2): 1.25 – 1.45
Minor Resistance: 2.12
Major Resistance: 2.33 – 2.42 (previous supply zone / local high)
Current Price: 1.91
---
📐 Technical Pattern
1. Bullish Flag / Rectangle
A sideways consolidation after a strong uptrend move, often a continuation pattern. A confirmed breakout to the upside could lead to a retest of 2.42.
2. Multiple Support Tests at Buy Zone 1
Several rejections at 1.8 – 1.9 confirm this zone as a critical short-term demand area. However, the more often a support is tested, the weaker it becomes.
3. Lower Highs Formation
Minor lower highs suggest mild selling pressure. This structure often precedes either a breakout or a breakdown, depending on which side gets taken out.
---
🚀 Bullish Scenario
Confirmation: A 2H close above 2.12 with rising volume.
Targets:
TP1 = 2.12 (breakout retest)
TP2 = 2.33
TP3 = 2.42 (previous high)
Extended Target: If 2.42 breaks, next psychological resistance sits around 2.80 – 3.00.
📌 Bullish entry ideas:
Aggressive: Buy within Buy Zone 1 with stop loss below 1.75.
Conservative: Wait for breakout above 2.12 + confirmed retest.
---
🐻 Bearish Scenario
Confirmation: A 2H close below 1.75 (breakdown from Buy Zone 1).
Targets:
TP1 = 1.50
TP2 = Buy Zone 2 (1.25 – 1.45)
Extended Target: If Buy Zone 2 fails, the structure shifts into a downtrend, potentially moving closer to 1.00.
📌 Bearish entry idea:
Enter short after breakdown (close <1.75), with stop above 1.95 (former support turned resistance).
---
📊 Risk Management
Always set stop losses below support (for longs) or above breakdown (for shorts).
Scale out profits at key resistance levels.
Keep risk per trade ≤2% of total capital.
---
⚠️ Things to Watch
False breakouts: Require volume confirmation.
Correlation with BTC/ETH: Broader market moves can strongly influence ASTER’s direction.
High volatility: Fakeouts may occur before the real move.
---
📌 Conclusion
As long as price holds above Buy Zone 1, the bullish continuation toward 2.12 – 2.42 remains valid.
A breakdown below 1.75 would invalidate the short-term bullish case and open the door toward Buy Zone 2.
Key decision point is very close — watch carefully for breakout or breakdown confirmation.
---
#ASTER #ASTRUSDT #CryptoAnalysis #BuyZone #SwingTrade #PriceAction #SupportResistance #BullishScenario #BearishScenario

ETHEREUMAfter the liquidation caused the price of the cryptocurrency to fall, Ethereum managed to break 4000 again, this is now a support region, following the upward trend line, Ethereum goes to 4100

#USDT.D (4H Chart)#USDT.D
(4H Chart)
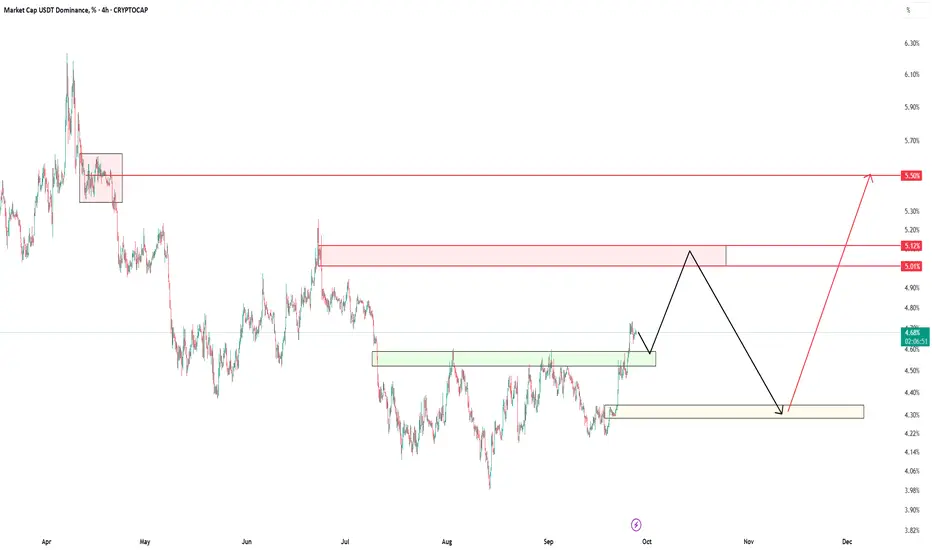
🔹️ USDT Dominance Analysis 🔹️
USDT dominance usually moves in the opposite direction of Bitcoin — when Bitcoin rises, this index tends to fall, and vice versa.
🟢 Green Box (Current Support)
The current support level for USDT dominance is in the green box: 4.60 – 4.50%.
We expect the price to move toward this level first, and after touching it, head toward the red box.
🟥 Red Box (Main Resistance)
The red box is at 5.00 – 5.12%.
This is the first and most important resistance level ahead.
After reaching this level, a correction is expected back toward the yellow box.
🟡 Yellow Box (Key Support)
The yellow box sits at 4.30%, which is a strong support area.
Once this level is tested, a major bullish move in USDT dominance is expected, targeting around 5.50%.
🎯 Final Target
When USDT dominance reaches 5.50%, the crypto market will likely be near its price bottoms.
💡 These bottoms could approximately align with Bitcoin around $85,000 and Ethereum around $3,000.
🆔 @RasoolAhmadi
ETHUSD Weekly Scenarios BullsWeekly Scenarios
Bulls
If ETH holds support at $4,200 and manages to rebound above the $4,500-4,600 resistance, we can expect a rally to $5,000 and beyond.
Sideways/Consolidation
The price may remain stuck in the $4,200-4,600 range until the market finds enough signal or volume to break out.
Bears
A breakout below $4,200 with volume confirmation will lead to a decline to $3,800 and below.

ETHEREUM HIGH PROBABILITY SETUP SOON!!!🚨 ETHER HIGH PROBABILITY BUY SETUP 🚨
* Here We Can See Clearly The Next Potential Moves For ETHUSD Coming Hours/Days.
* Keep Your Eyes Close On Your Trading Positions.
* Happy PIP Hunting Traders.
FXKILLA.

ETH 4H Analysis - Key Triggers Ahead | Day 28❄️ Welcome to the cryptos winter , I hope you’ve started your day well.
⏰ We’re analyzing BINANCE:ETHUSDT on the 4-Hour timeframe .
👀 On the 4-hour chart, after the recent drop, Ethereum managed to hold above $3,900 thanks to support from its maker-buyer zone. Price is currently trading below a key resistance at $4,034. A breakout and confirmation above this level could lead ETH toward its next major trend-shift resistance.
The primary resistance for initiating a new bullish leg sits at $4,133. A break and stabilization above this zone could trigger a solid upside move, potentially extending toward the $4,800 area.
🧮 The RSI oscillator shows that during the recent sell-off, ETH dipped twice into deep oversold territory, with significant time spent under selling momentum. The key RSI zone now is the 50 baseline, which acts as resistance. A momentum break above this level would support price stabilization over $4,034, and allow ETH to retest and potentially break its resistance on the way to the overbought zone.
🕯 The candle size and volume on the rebound from the maker-buyer support have been reasonably strong, suggesting that ETH has likely established a key floor around $3,837. As price approached the $4,034 resistance, red candles have become smaller — signaling weakening bearish pressure and absorption of sell orders at that zone.
Given the weekend environment, volume has cooled off, and price is moving in a range. With the start of the new week, increased volume could spark a breakout, and trader reaction on ETH may be notable.
💸 The BINANCE:ETHBTC pair is also sitting below a key resistance zone. A breakout and confirmation here could shift ETH’s trading behavior and momentum. On RSI, the pair is around the 50 level, showing reduced volatility due to weekend conditions.
The first key resistance is at 0.03687. A breakout and confirmation above this level could support a long setup on ETH. However, the critical resistance sits at 0.03853 — which aligns with the pair’s overbought potential. Breaking and stabilizing above that level would likely trigger notable bullish continuation, but only if RSI enters the overbought zone as confirmation.
🧠 Since CRYPTOCAP:USDT.D recently rejected from 4.72% and Bitcoin has shown some support, Ethereum now holds a reliable floor that can be used for long setups once the specified resistances break. Two main scenarios are in play:
1️⃣ Scenario 1: We need a higher-timeframe candle close above key resistance, starting with $4,034, which also aligns with RSI’s 50-level resistance.
After that, spotting a multi-timeframe indecision candle could allow an entry with controlled risk.
Upon a confirmed break of the major resistance at $4,133, or signs of trend reversal, additional position size can be added.
Essentially, we require a higher low above $4,034, enabling formation of a higher high and eventual breakout through $4,133.
2️⃣ Scenario 2 : A short on ETH is less favorable due to strong buying interest at current levels and weaker risk-to-reward. However, if price breaks and confirms below the key support and maker-buyer zone, a deeper correction could follow.
❤️ Disclaimer : This analysis is purely based on my personal opinion and I only trade if the stated triggers are activated .

My only remaining hope for Ethereum !!!My only remaining hope for Ethereum is this PRZ. If the price holds this level, it could rise above $5000 otherwise, you know what will happen if this level breaked...
