ETH Game Plan – FTKZ ModelETH Game Plan – FTKZ Model
📊 Market Sentiment
After the sharp 10/10 crash triggered by Trump’s 100% tariff announcement on Chinese imports, altcoins saw heavy liquidations some exceeding -80%.
On 12/10, Vice President Vance clarified Trump’s remarks, causing a temporary rebound.
However, Trump’s 15/10 statement reaffirming a trade war with China reignited selling pressure.
Sentiment remains bearish, as volatility and geopolitical risk continue to shape short-term direction.
📈 Technical Analysis
ETH maintains a bullish structure on the weekly timeframe.
If the weekly candle closes below 3350$, it would signal a potential bearish reversal.
Price is currently retracing toward the HTF Key Zone, aligning with both an FFVG and HTF trendline confluence ideal for long setups if support holds.
📘 Model to be used – FTKZ Model (HTF FFVG + Trendline + Key Zone)
1️⃣ Determine the HTF weekly trend — trade only in that direction.
2️⃣ Identify the HTF Fair Value Gap (FFVG) that price may rebalance.
3️⃣ Confirm confluence with HTF trendline support.
4️⃣ Locate the HTF Key Zone showing strong order flow.
5️⃣ Enter after LTF confirmation.
📌 Game Plan
I will be watching ETH to test the 3350$ HTF Key Zone (weekly swing liquidity & monthly FFVG).
If the weekly close forms back above 3350$, I will expect continuation toward higher levels.
🎯 Setup Trigger
Weekly close above 3350$ confirming bullish continuation.
📋 Trade Management
Stoploss: Weekly close below 3350$
Targets: TP1: 4300$ | TP2: Bearish Trendline
Move stoploss to breakeven after TP1 hits.
💬 Like, follow, and comment if this breakdown supports your trading! More setups and market insights coming soon — stay connected!
⚠️ Disclaimer: This content is for informational and educational purposes only and does not constitute financial, investment, or trading advice. Always DYOR before making any financial decisions.
Ethereum (Cryptocurrency)

ETHUSD H4 | Bullish Reversal FormationEthereum (RTH/USD) is falling towards the buy entry, which is a pullback support that aligns with the 61.8% Fibonacci projection and the 127.2% Fibonacci extension, and could bounce from this level to the take profit.
Buy entry is at 3,712.02, which is a pullback support that aligns with the 61.8% Fibonacci projection and the 127.2% Fibonacci extension.
Stop loss is at 3,514.48, whichis a pullback support.
Take profit is at 4,2756.43, which is a pullback resistance.
High Risk Investment Warning
Trading Forex/CFDs on margin carries a high level of risk and may not be suitable for all investors. Leverage can work against you.
Stratos Markets Limited (tradu.com ):
CFDs are complex instruments and come with a high risk of losing money rapidly due to leverage. 65% of retail investor accounts lose money when trading CFDs with this provider. You should consider whether you understand how CFDs work and whether you can afford to take the high risk of losing your money.
Stratos Europe Ltd (tradu.com ):
CFDs are complex instruments and come with a high risk of losing money rapidly due to leverage. 66% of retail investor accounts lose money when trading CFDs with this provider. You should consider whether you understand how CFDs work and whether you can afford to take the high risk of losing your money.
Stratos Global LLC (tradu.com ):
Losses can exceed deposits.
Please be advised that the information presented on TradingView is provided to Tradu (‘Company’, ‘we’) by a third-party provider (‘TFA Global Pte Ltd’). Please be reminded that you are solely responsible for the trading decisions on your account. There is a very high degree of risk involved in trading. Any information and/or content is intended entirely for research, educational and informational purposes only and does not constitute investment or consultation advice or investment strategy. The information is not tailored to the investment needs of any specific person and therefore does not involve a consideration of any of the investment objectives, financial situation or needs of any viewer that may receive it. Kindly also note that past performance is not a reliable indicator of future results. Actual results may differ materially from those anticipated in forward-looking or past performance statements. We assume no liability as to the accuracy or completeness of any of the information and/or content provided herein and the Company cannot be held responsible for any omission, mistake nor for any loss or damage including without limitation to any loss of profit which may arise from reliance on any information supplied by TFA Global Pte Ltd.
The speaker(s) is neither an employee, agent nor representative of Tradu and is therefore acting independently. The opinions given are their own, constitute general market commentary, and do not constitute the opinion or advice of Tradu or any form of personal or investment advice. Tradu neither endorses nor guarantees offerings of third-party speakers, nor is Tradu responsible for the content, veracity or opinions of third-party speakers, presenters or participants.

ETH/USDT Long Setup – Demand Zone BounceHi Everyone,
Ethereum is sitting just above the $4,000 support after bouncing from the $3,500–$4,000 demand zone and reclaiming the 20W EMA. As long as price holds this level, I’m looking for continuation to the upside.
My target for this trade is $5300,
A break back below $3,500 would invalidate this setup, however I have my stop loss priced at $3200.
Simple plan: hold above demand, ride it higher.
I believe this trade will hit target within 2-4 weeks.

Bitcoin Eyeing $108K ZoneCRYPTOCAP:BTC Daily Chart Analysis
Bitcoin is currently trading around $110,300, showing weakness after failing to hold higher levels. The market structure still looks corrective, and we can see price slowly drifting toward the nearest support zone around $108,000–$109,000.
If this zone holds, we might see a short-term bounce or relief rally. But if the market breaks below $108,000, the next major demand area lies near $104,000–$100,000, where buyers are likely waiting.
For now, the key is to watch how price reacts at this support. A strong bounce could confirm accumulation, while a breakdown might trigger deeper correction before any new bullish leg.
DYOR, NFA

Ethereum's pullback is not yet over.From a technical standpoint, Ethereum’s previous strong upward structure has been notably disrupted amid this pullback. The 1-hour K-line chart shows that after failing to break through the 4,788 high, ETH closed multiple consecutive long-bodied bearish candles. Its price has sequentially breached the MA5, MA20, and MA60 moving averages, marking a reversal in the short-term trend.
After the MACD indicator formed a "death cross" at a high level, the fast line has crossed below the zero line and entered the bearish zone. The green bearish momentum bars continue to expand, indicating that the short-term adjustment is not yet complete.
Today, Ethereum’s price is struggling to hold above the medium-term moving average. A break below this level could trigger a deeper decline.
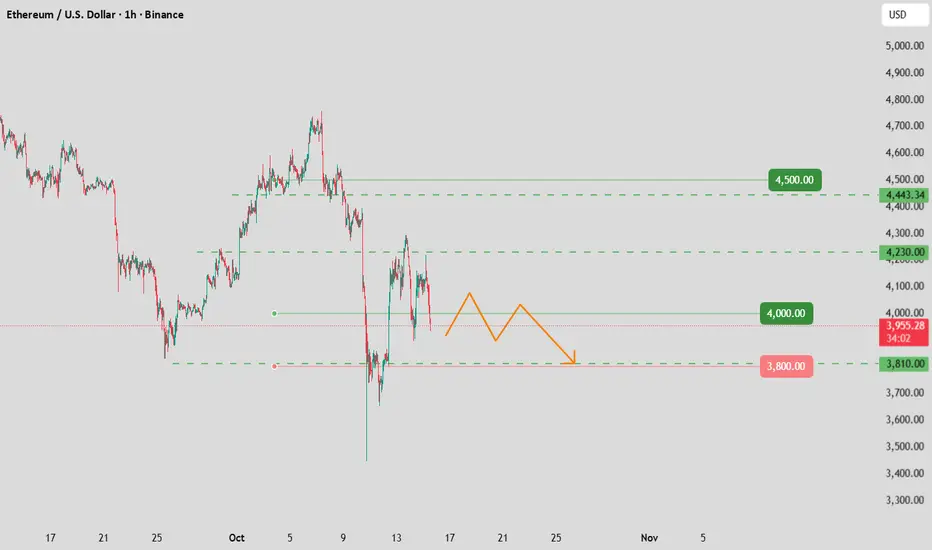
TradeCityPro | Ethereum: Break Key Levels for Bullish Momentum👋 Welcome to TradeCity Pro!
In this analysis, I want to examine Ethereum for you. The queen of the crypto market, with a $497 billion market cap, is ranked 2nd on CoinMarketCap.
⏳ 4-Hour Timeframe
This coin, in the 4-hour timeframe, after breaking the range box at the ceiling and moving towards the $3800 level, is now in a corrective phase and has made an upward movement.
⭐ The $3800 range is a very important level for Ethereum, and this zone was not broken even during the Flash Crash that occurred on Friday, and it managed to hold the price.
🚀 Now, the price has moved towards the range between 0.5 and 0.618 Fibonacci, and has been rejected once from this zone.
📊 The volume has not increased significantly during this move and has mostly been range-bound, but since the price has created a higher low at the $3971 level, if the buying volume increases, we can get a bullish confirmation with a break of the $4255 level.
💥 Since this coin is bullish on higher timeframes and is currently undergoing a correction on lower timeframes, if the price gives us a small bullish confirmation, we can take advantage of it and open a long position.
💡 The main resistance for Ethereum is the $4718 level. Breaking this level will initiate the next wave for Ethereum on higher timeframes, such as weekly charts. Therefore, I will try to open a long position on Ethereum before this level is broken.
📈 The suitable trigger right now seems to be a break of $4255. With this break, the price can move towards $4718, and if this level is broken, we will have a very good and attractive entry point for a long position on Ethereum.
📝 Final Thoughts
Stay calm, trade wisely, and let's capture the market's best opportunities!
This analysis reflects our opinions and is not financial advice.
Share your thoughts in the comments, and don’t forget to share this analysis with your friends! ❤️
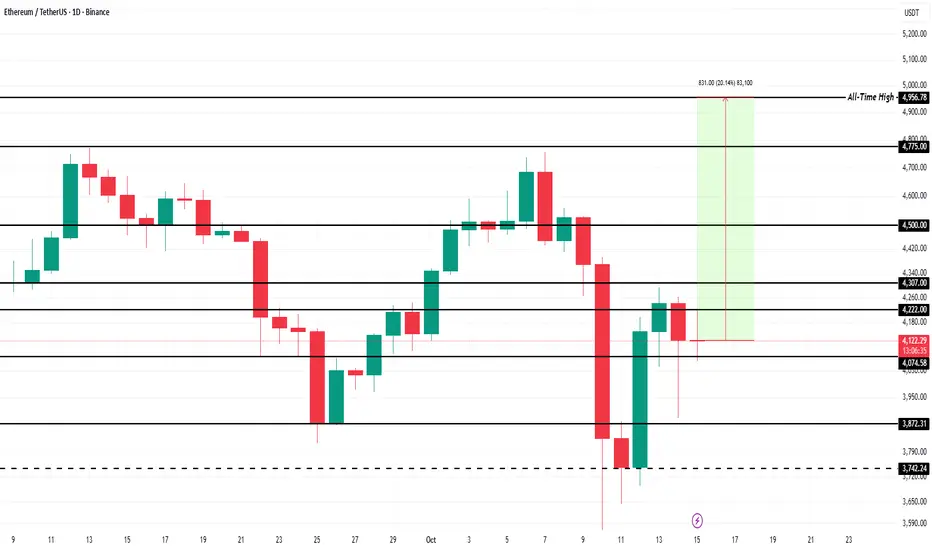
Ethereum’s Path to $5,000 Likely Blocked by LTH ActionsEthereum is currently priced at $4,147, trading just below the key $4,222 resistance level. A successful breach of this barrier could enable ETH to climb toward $4,500. This would attract stronger inflows from institutional and retail investors alike.
If accumulation strengthens and confidence returns, Ethereum could advance toward $4,956 — its previous all-time high — and potentially touch $5,000. This would represent a decisive signal of market recovery and renewed bullish momentum.
However, if bearish sentiment grows or long-term holders continue offloading their holdings, Ethereum could slip below $4,000. A deeper correction could pull the price down to $3,872 or lower, invalidating the bullish thesis and signaling renewed selling pressure in the market.
#ETH/USDT the Final Push Before the Parabolic Run!#ETH
The price is moving within a descending channel on the 1-hour frame, adhering well to it, and is heading for a strong breakout and retest.
We have a bearish trend on the RSI indicator that is about to be broken and retested, which supports the upward move.
There is a major support area in green at 3900, which represents a strong support point.
We are heading for consolidation above the 100 moving average.
Entry price: 4156
First target: 4274
Second target: 4405
Third target: 4583
Don't forget a simple matter: capital management.
When you reach the first target, save some money and then change your stop-loss order to an entry order.
For inquiries, please leave a comment.
Thank you.

Ethereum 1H Analysis – Key Battle at $4,278 Resistance | D1👋 Hey everyone! Hope you’re doing great!
💥 Welcome to Satoshi Frame — today we’re diving into the 1-hour Bitcoin analysis. Stay tuned and follow along!
👀 1-hour timeframe of Ethereum, and we can see that Ethereum, after the heavy drop it experienced, broke down from the 4278$ area and moved toward its lower support levels. A major support level has formed around the 3692$ area, where we saw strong buyer support, and they pushed the Ethereum price upward. After the upward movement and buyer support, as Ethereum approached its resistance in the 4278$ area, the buying volume decreased, and then buyers’ strength ended. Sellers, with strong momentum and multiple red candles, pushed the price down toward the 3941$ support, where the price was supported again. Now a higher low has formed compared to the 3941$ bottom, and the price is moving toward its key resistance area at 4278$.
🧮 We can see in the RSI oscillator that there is a key level around 70, which is the OverBuy boundary. If the fluctuation limit passes this area, Ethereum can break its resistance around 4278$.
🕯 Regarding volume, there is an educational note that when the price approached the 4278$ resistance, it faced a decrease in buying volume and was rejected from this area with many red candles. Now that the price is moving toward this resistance, if it is accompanied by an increase in buying volume, it increases the probability of breaking this resistance for us.
🧠 For the Ethereum position, a breakout of the 4278$ area is needed, and now if the price moves toward this area, it will form our second touch and create several scenarios for us.
↗️ First scenario for long position: breakout of resistance accompanied by an increase in volume and setting the trigger at 4278$, which gives us a large stop size and reaches its risk-to-reward ratio later.
↗️ Second scenario for long position: wait for the price to have a reaction to the 4278$ area and then create a higher high and higher low for us, and we can enter on the created higher low and place our stop below that same low.
❤️ Disclaimer : This analysis is purely based on my personal opinion and I only trade if the stated triggers are activated .

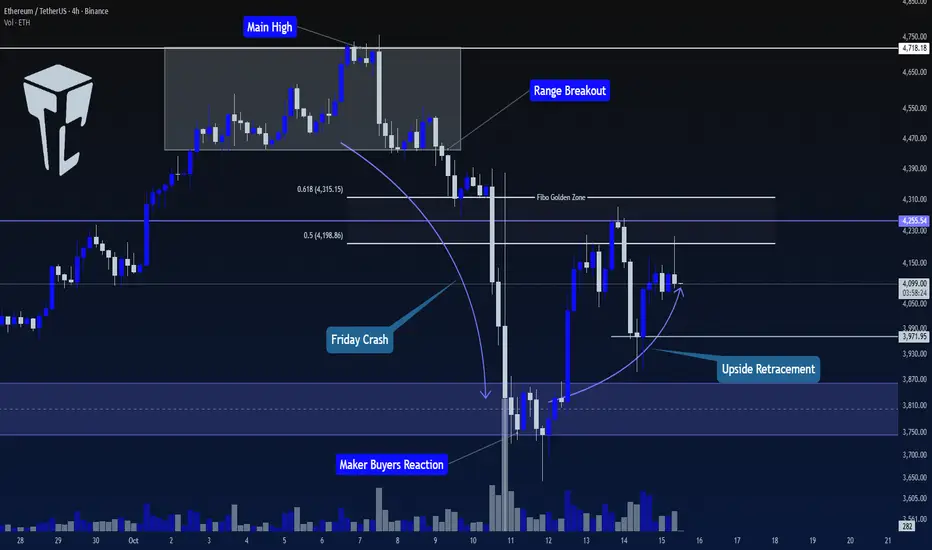
ETH: Technical Precision Amid the CrashIn spite of the crypto market crash, Ethereum actually moved very technically.
The break below the $4,300 support led to a drop toward the important $3,500 zone.
Although the price also broke below $3,850, a quick reversal followed — the rebound brought the price back above the $3,850 support and up to the $4,300 resistance.
A new wave of selling came next, but this time, the price stopped around the $3,850 support zone, confirming it as an important level.
A quick rebound followed, and now ETH is back above $4,000, trading around $4,100.
Also very important — the price of ETH is forming an ascending triangle, with resistance at $4,300.
A break above $4,300 will most likely accelerate gains toward the $4,900–$5,000 area, which is both a technical resistance and the target of the triangle.
I’m looking to buy on dips, preferably below $4,000, and considering the mentioned target, such a setup offers around a 1:3 or even 1:4 risk-reward ratio.
ETH Consolidates Below Yesterday Cloee ETH 30M – Waiting for Long Confirmation
After a sharp pullback, Ethereum is now consolidating right below key dynamic levels, the perfect zone where patience pays more than prediction.
🧭 System Overview:
I track 3 confirmation signals:
1️⃣ MLR10 crossing above SMA3.
2️⃣ MLR10 crossing above BB center
3️⃣ PSAR flipping below price.
⚙️ Current Time Frame (30m):
PSAR (gray) still above price → bearish bias not yet invalidated.
MLR10 (blue) is between SMA3 (magenta) and BB center (orange) → neutral zone.
RSI at 49.7 → momentum flat.
MACD turning red → fading strength.
200MA (red) near 4000 → key structural support.
💡 Interpretation:
ETH is preparing, not breaking.
There’s potential energy building, but entry discipline is crucial.
Until PSAR flips below and MLR reclaims both SMA and BB center, we stay flat.
📊 Market context:
Open Interest ↓ 1.8% → leverage cooling off.
Funding neutral → no retail squeeze in play.
Liquidations balanced → no directional aggression.
➡️ Conclusion:
No confirmed long yet, but structure shows early recovery potential.
A valid System Long will trigger once all 3 signals align.
Key levels:
Resistance: Yesterday close , dotted line
Support: MA50
Next long trigger → when PSAR flips & MLR > SMA3 > BB center
Always take profits and manage risk.
Interaction is welcome.

Ethereum is headed for a massive bull market. Hope you guys are ready for the fun part, because Ethereum—according to my analysis—is ready for some massive moves. This means altcoin season is coming in full force very soon. Be ready and ignore the FUD.
As always, stay profitable.
– Dalin Anderson

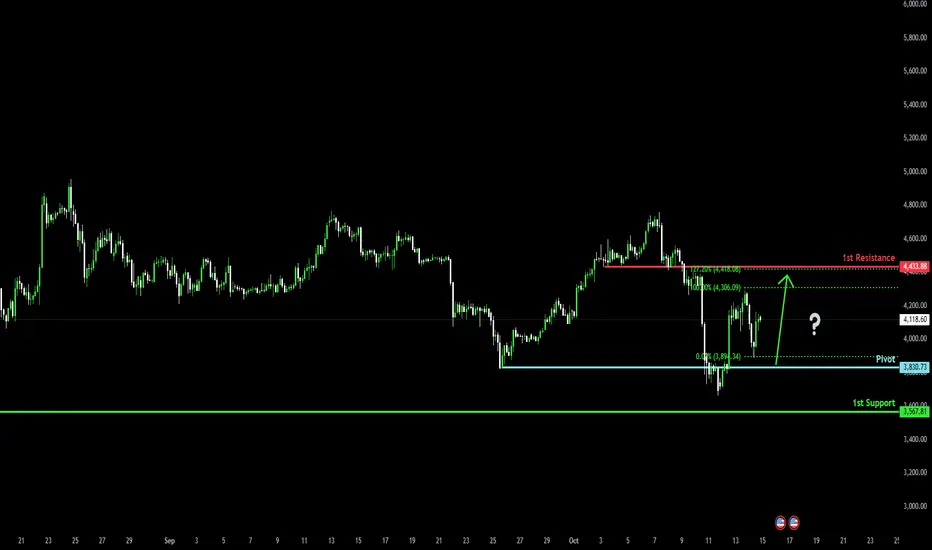
Bullish reversal setup?The Ethereum (ETH/USD) is falling towards the pivot and could bounce to the 1st resistance that aligns with hte 127.2% Fibonacci extension.
Pivot: 3,830.73
1st Support: 3,567.83
1st Resistance: 4,433.88
Disclaimer:
The above opinions given constitute general market commentary, and do not constitute the opinion or advice of IC Markets or any form of personal or investment advice.
Any opinions, news, research, analyses, prices, other information, or links to third-party sites contained on this website are provided on an "as-is" basis, are intended only to be informative, is not an advice nor a recommendation, nor research, or a record of our trading prices, or an offer of, or solicitation for a transaction in any financial instrument and thus should not be treated as such. The information provided does not involve any specific investment objectives, financial situation and needs of any specific person who may receive it. Please be aware, that past performance is not a reliable indicator of future performance and/or results. Past Performance or Forward-looking scenarios based upon the reasonable beliefs of the third-party provider are not a guarantee of future performance. Actual results may differ materially from those anticipated in forward-looking or past performance statements. IC Markets makes no representation or warranty and assumes no liability as to the accuracy or completeness of the information provided, nor any loss arising from any investment based on a recommendation, forecast or any information supplied by any third-party.
Ethereum aim for 10kWe bought eth for 1600$ this cycle and haven’t sold yet ! it’s not my intention to sell yet , in my retard mind A cycle without 10k Ethereum isn’t finished, it’s very resembling previous cycle , holding on the support on a good condition, all pairs look good , I extended my Altseason expectations to late 2026 but it’s not a bad news if we start going up in the next coming weeks, I never lost hope in crypto and there’s no Bitcoin without Alts , time for shine lady Eth .
NFA
Volatility Period: October 16 (October 15-17)
Hello, traders!
Follow us to get the latest information quickly.
Have a great day!
-------------------------------------
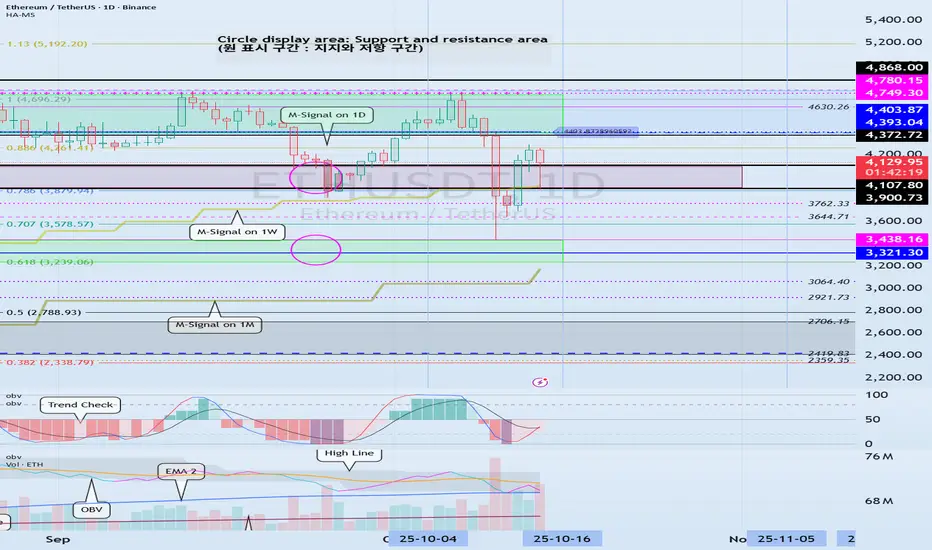
(ETHUSDT 1D Chart)
Following BTC, ETH is also entering a volatility period.
This period of volatility for ETH is expected to last until October 16th (October 15th-17th).
After this period of volatility, the key question is whether the price can find support around 3900.72-4372.72 and rise above 4403.87 to maintain its price.
If the price fails to rise, it is expected to encounter the M-Signal indicator on the 1M chart, so a response plan should be considered.
-
(1M chart)
The StochRSI indicator on the 1M chart is entering an overbought zone, potentially limiting its upward movement.
Therefore,
1st: 3900.73-4107.80
2nd: 3321.30-3438.16
We need to determine whether the price can rise after finding support near the 1st and 2nd levels above.
In other words, we need to see if the price remains above the M-Siganl indicator on the 1M chart.
-
(1W chart)
Looking at the 1W chart, the HA-High ~ DOM (60) range is formed in the 4393.04-4780.15 range. Therefore, a rise above this range is necessary for a stepwise uptrend.
Ultimately, the key question is whether the price can rise above the 4393.04-4780.15 range.
----------------------------------
Therefore, the key question is whether the 4393.04-4780.15 range, which corresponds to the HA-High ~ DOM(60) range on the 1W and 1D charts, can rise after this period of volatility.
As I always say, to break above this important point or range and continue the uptrend,
1. The StochRSI indicator must be trending upward. If possible, it's best to avoid entering the overbought zone.
2. The On-By-Sign-Observable (OBV) indicator must be trending upward. If possible, it should remain above the High Line.
3. The TC (Trend Check) indicator must be trending upward. If possible, it should remain above the 0 level.
If the above conditions are met, the uptrend is likely to continue.
It's recommended to draw support and resistance points or ranges on the 1M, 1W, and 1D charts and utilize auxiliary indicators to determine the significance of these points or ranges.
When drawing support and resistance points or zones, we often think of them as important, but it can be difficult to recognize how important they actually are.
Therefore, when drawing support and resistance points or zones, it's important to be able to develop a basic trading strategy.
Once you've established a basic trading strategy, the key to trading is figuring out how to maintain that strategy and respond accordingly.
No matter what chart analysis you use, you'll ultimately need to draw support and resistance points or zones.
Therefore, the first step is to draw support and resistance points or zones on the 1M, 1W, and 1D charts.
Next, you should check auxiliary indicators to determine the importance of the drawn support and resistance points or zones and determine whether you should respond.
To achieve this, you need to understand your investment size and how to manage your reserve funds.
You should always keep a certain portion (approximately 20%) of your total investment in cash.
This allows you to respond to volatility when it occurs.
If you've invested too much money in a single coin (token, stock), it's a good idea to sell some of it when the price rises to a certain level and secure cash.
Ultimately, overcoming the relentless volatility of the beginning and achieving profit depends on how you manage your funds.
-
Thank you for reading to the end.
I wish you successful trading.
--------------------------------------------------
$ETH Price Prediction will hit $6K in 2026 see on chart...📈 Chart Analysis: Price is showing a Unique Bullish Megaphone Pattern and this is a Continuation Bull run Pattern. This Pattern is Very Rarely and it's made with on ATH areas. There is a False Breakout after the price will drop to support areas $3K - $3.5K and than pumping price very sharply. The price goes ATH area than falls breakout to Retested after Price will Break ATH areas. ATH area is a Dynamic Resistance area. When Fill this pattern it will be happened for $6K price areas 2026.
📊 Trading Setup: ETH Long Position setup guidelines: Major Support Areas is $3K and Dynamic Resistance area is ATH areas $4.9K, I'm using my Golden Fibonacci level for entry. There is 3 point of entry area is $3.4K, $3.6K, $3.8K and it's a Spot Position Entry point areas. Stoploss area is $3K and it's a support area. Profit the Target area is $4.2K $4.6K $5K $5.5K $6K.
🌍 Dominance Analysis: ETH Dominance is dumping ETH price will Pumping. The Dominance ATH is 22.38% of Resistance area in December 2021 and Support area is 6.95% in April 2025.
#Write2Earn #BinanceSquareFamily #Binance #BTC☀ #SUBROOFFICIAL
Disclaimer: This article is for informational purposes only and does not constitute financial advice. Always conduct your own research before making any investment decisions. Digital asset prices are subject to high market risk and price volatility. The value of your investment may go down or up, and you may not get back the amount invested. You are solely responsible for your investment decisions and Binance is not available for any losses you may incur. Past performance is not a reliable predictor of future performance. You should only invest in products you are familiar with and where you understand the risks. You should carefully consider your investment experience, financial situation, investment objectives and risk tolerance and consult an independent financial adviser prior to making any investment.

ETHEREUM - Buy Zone 3930 - 3990 Market Trend: Ethereum is in a bullish trend, with waves (i), (ii), and (iii) of an Elliott Wave cycle already completed.
Short-Term Price Movement: The market is expected to correct in wave (iv), testing the $3,960–$3,880 support zone.
Buy again if the price touch again the level 3930-3990 and reverse.
confirm only!!!
if stays above $3,880, wave (v) is projected to target the $4,400–$4,500 zone.
COINBASE:ETHUSD

Ethereum (ETH/USD) – Bearish Rejection Expected from ResistanceHere’s a detailed technical analysis of your Ethereum (ETH/USD) 4H chart 👇
🔹 Chart Overview
Timeframe: 4H
Current Price: ≈ 3,983
Resistance Zone: 4,314 – 4,583
Target Level: 2,766
Pattern: Downward channel (bearish trend continuation)
🔹 Price Structure
Price is moving within a descending channel, meaning the overall trend remains bearish.
After touching the lower trendline, ETH rebounded and is now testing the upper channel resistance zone between 4,314–4,583.
🔹 Key Levels
Resistance Zone:
This zone is critical; it aligns with both the upper channel boundary and a prior supply zone.
If price gets rejected here → confirms continuation of downtrend.
Support / Target:
The projected target level is around 2,766.75, which aligns with the lower boundary extension of the channel.
🔹 Market Bias
As long as ETH stays below 4,314, the bearish sentiment dominates.
A clean break and close above 4,583 would invalidate the bearish setup and could shift sentiment bullish toward 4,800+.
🔹 Possible Scenarios
1. Bearish Scenario (High Probability):
ETH rejects from resistance zone (4,314–4,583).
Downward move continues toward 3,500 → 3,000 → final target 2,766.
2. Bullish Reversal (Low Probability unless breakout):
Strong breakout above 4,583 with volume.
Next resistance near 4,950–5,000.
🔹 Summary
📉 Trend: Bearish
⚠ Watch Zone: 4,314–4,583 (short opportunity if rejection forms)
🎯 Downside Target: 2,766
🔄 Invalidation: Break and close above 4,583

BTH: Support Above 3800Today, after experiencing a sharp drop at the opening, the price of Ethereum found support above 3,800 and rebounded. Both attempts to test the bottom failed to break through the support at 3,800, which proves that the support here is solid. Then it entered a trend of slight oscillation and rebound. The long-short game is still relatively fierce. The subsequent trend needs to pay attention to the breakthrough of the key level of 4,000 and the effectiveness of the upper and lower support and resistance.
Buy 3930 - 3940 TP 3955 - 3965 - 3975 SL 3925
Sell 4015 - 4020 TP 3990 - 3980 - 3970 SL 4025
Daily-updated accurate signals are at your disposal. If you run into any problems while trading, these signals serve as a reliable reference—don’t hesitate to use them! I truly hope they bring you significant assistance

The ETHUSD remains in a neutral trend, with recent price action The ETHUSD remains in a neutral trend, with recent price action showing signs of a corrective pullback within the broader range trading.
Support Zone: 3,831 – a key level from previous consolidation. Price is currently testing or approaching this level.
A bullish rebound from 3,831 would confirm ongoing upside momentum, with potential targets at:
4,090 – initial resistance
4,176 – psychological and structural level
4,287 – extended resistance on the longer-term chart
Bearish Scenario:
A confirmed break and daily close below 3,831 would weaken the bullish outlook and suggest deeper downside risk toward:
3,770 – minor support
3,716 – stronger support and potential demand zone
Outlook:
Bullish bias remains intact while the ETHUSD holds above 3,831 A sustained break below this level could shift momentum to the downside in the short term.
This communication is for informational purposes only and should not be viewed as any form of recommendation as to a particular course of action or as investment advice. It is not intended as an offer or solicitation for the purchase or sale of any financial instrument or as an official confirmation of any transaction. Opinions, estimates and assumptions expressed herein are made as of the date of this communication and are subject to change without notice. This communication has been prepared based upon information, including market prices, data and other information, believed to be reliable; however, Trade Nation does not warrant its completeness or accuracy. All market prices and market data contained in or attached to this communication are indicative and subject to change without notice.

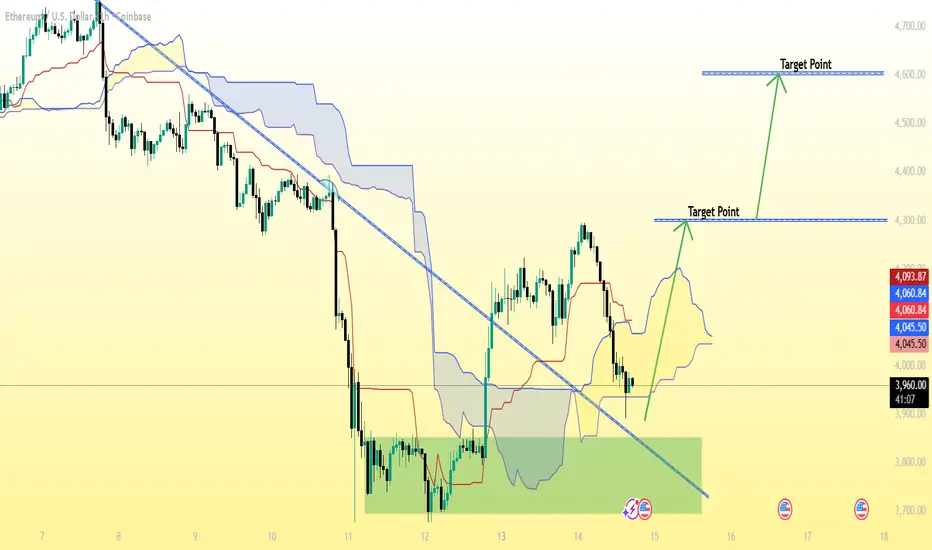
Ethereum (ETH/USD) 1-hour chart Pattern...Ethereum (ETH/USD) 1-hour chart from Coinbase, with Ichimoku Cloud and a downtrend breakout drawn — here’s the clear target breakdown:
🔹 Current Price
≈ $3,965
🔹 First Target Zone
$4,280 – $4,320
This aligns with the first “Target Point” shown on my chart.
It represents the initial resistance after a confirmed breakout and retest of the cloud.
may i expect some profit-taking or short-term pullback here.
🔹 Second Target Zone
$4,550 – $4,600
This is my final target on the chart.
It marks the upper resistance and aligns with the Ichimoku cloud’s future projection and previous structure highs.
---
📈 Summary:
Target Price Range Comment
🎯 Target 1 $4,280 – $4,320 Short-term target after breakout confirmation
🎯 Target 2 $4,550 – $4,600 Mid-term target if momentum continues
UDSUSD – FVG’s Not Filled, Trend Ain’t Done YetHey There Guys,
Post-BOS, the market’s still pushing with upside momentum.
That upper +FVG hasn’t been filled yet, so the trend’s not showing signs of fatigue.
The Strong Buy Zone below is still in play—if liquidity gets pulled down there, buyers could step in hard.
As long as we don’t get a daily close below the main support zone, dips are still buying opportunities.
I will share updates here.
Every like you send is my biggest motivation to keep sharing these setups. Big thanks to everyone backing me.

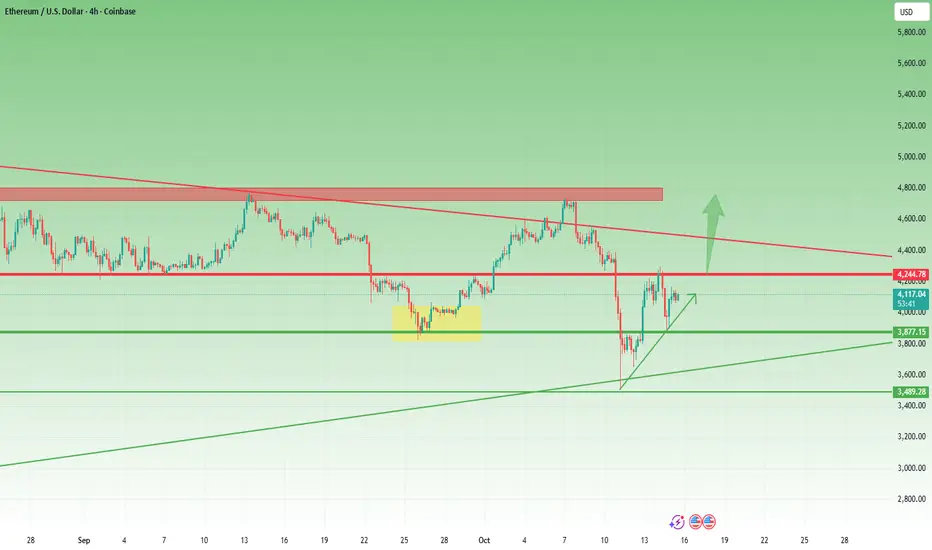
$ETH the big picture is still in play.After breaking out of its long-standing downtrend, Ethereum is currently only retesting the demand zone and trend line.
This move is a healthy retest inherent in a bullish structure.
Fluctuations on short timeframes don't change direction; it's the longer timeframes that matter.
The macrotrend is still upward.
The bigger picture hasn't yet spoken.
