ETH Correction Finally Underway!Local Analysis / Targets / Elliot Wave
I have been banging the drum about a deeper ETH pullback for a weeks and it appears to be finally underway with bearish market structure confirmed with the lower low from yesterday. Online sentiment, mainstream media attention, silly price targets from analysts, discussions of the ‘the flippening’ returned and Trumps son bragging on X were all major warning signs of a local top. The ETH validator exit queue is record breaking causing a delay of 40+ days if you want to un-stake your ETH. Wrapped Ethereum like stETH may be a good option if you really want out fast! Weather this supply hits the markets is still up in the air.
Price is in the High Volume Node support and below the daily pivot. This isn’t likely to break immediately but after a few attempts to weaken it first (4? lol). The first target for the end of the correction is the same as a few weeks ago - the S1 pivot, rising daily 200EMA and 0.382 Fibonacci retracement at $3500, followed by the S2 pivot, High Volume Node support and 0.786 ‘alt-coin golden pocket’ at $2700. This could present a great buy opportunity.
RSI is making its way to oversold which is a good sign when in a range.
Standard Deviation Band Analysis
Standard deviation bands tell a different story with price still only testing the fair value regression line as resistance after presenting a fantastic buy opportunity from the green zone earlier this year. Price rides this line most of the time as you can see by looking left. A significant breakout above would see the SD+2 threshold target around $7000, a blow off top could reach $10,000 at the SD+3 threshold.
Safe trading
Ethereum (Cryptocurrency)

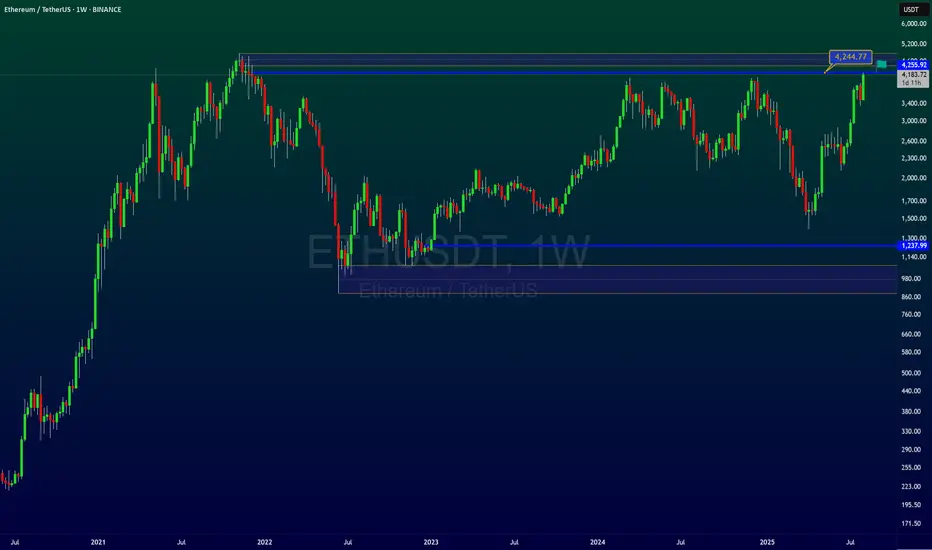
Ethereum to NEW ALL TIME HIGHBecause Ethereum holds above the critical 4000 support level, the bullish divergence on the daily RSI could drive it to break the 4800 resistance.

Ichimoku buy signal on ETH/USD DailySo there's an ichimoku buy signal on the ethereum daily chart. When the faster span crosses over the slower one, (doesn't let me use japanese words) and the current candles are over the cloud, this indicates a buy signal. The lagging span should ideally be above the corresponding price action. In this case it almost is.
Other than the indicators, we have a bull pennant looking shape. as well as a cup and handle looking pattern. The trade is to buy here targeting new all time highs for ethereum. This also depends on bitcoin. If bitcoin goes up, I am very certain this will happen.
Not telling you a stop loss or anything.
Not financial advice

ETH all time high or reverse????Ethereum has returned to the top after a long time and is on the verge of breaking the top, but in my opinion this will not happen. Of course, it is possible to see new prices, but then it will enter a correction and this will happen in the next move that will start in the future.
So we should wait for a very good entry with a cheap and lower price.
Stay with me and boost me after introducing me to your friends.
ETH 4H Analysis - Key Triggers Ahead | Day 25😃 Hey , how's it going ? Come over here — Winter got something for you!
⏰ We’re analyzing ETH on the 4-Hour timeframe.
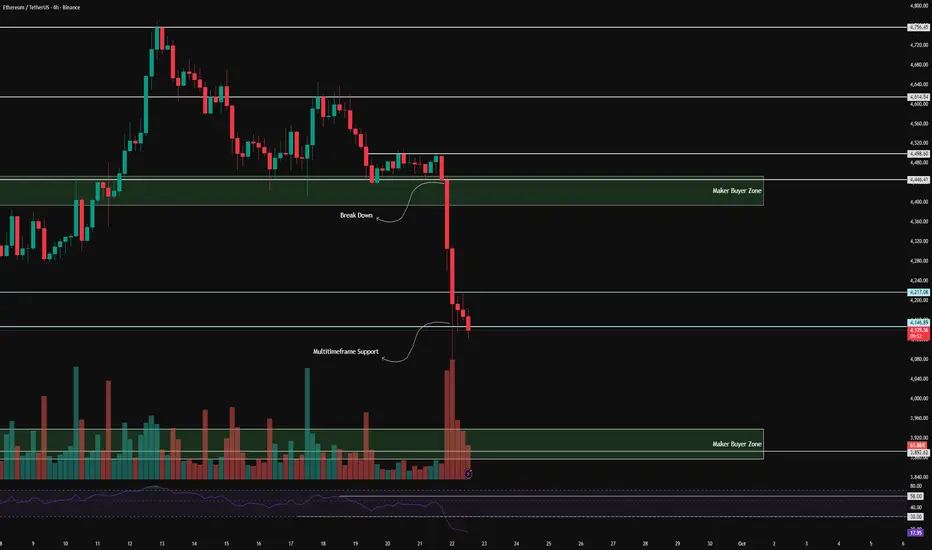
👀 On the 4H timeframe for Ethereum, we can see that after breaking below its maker-buyer zone, ETH moved down toward lower support levels, experiencing a **7% drop** — an unexpected move that even pushed major holders to sell. Ethereum is now sitting at a **multi-timeframe support zone**, and if this level is lost, it could head toward the next lower maker-buyer area, where we’ll need to observe how price reacts.
🧮 The **RSI oscillator** shows ETH deep in the **oversold zone** with heavy selling pressure. Buyers have yet to step in, meaning that with more sell-side momentum, Ethereum could remain oversold for an extended period.
🕯 The **size and volume of red candles** have increased sharply in a short span of time. This fast move down with fewer candles signals **strong selling sentiment**, while price itself looks uncertain about its next direction.
💸 Looking at **ETHBTC**, the pair experienced a sharp drop and deep correction with the start of the new week. It is also resting at a multi-timeframe support zone. If that breaks, Ethereum could face a further correction.
🧠 As for positioning, it’s still early. We’d prefer to wait for the market to build a stronger structure and possibly a wider range before entering. A **short position below the 4147 support** is possible with low risk, but since RSI remains heavily oversold, we must also consider the potential for a **price rebound**.
❤️ Disclaimer : This analysis is purely based on my personal opinion and I only trade if the stated triggers are activated .
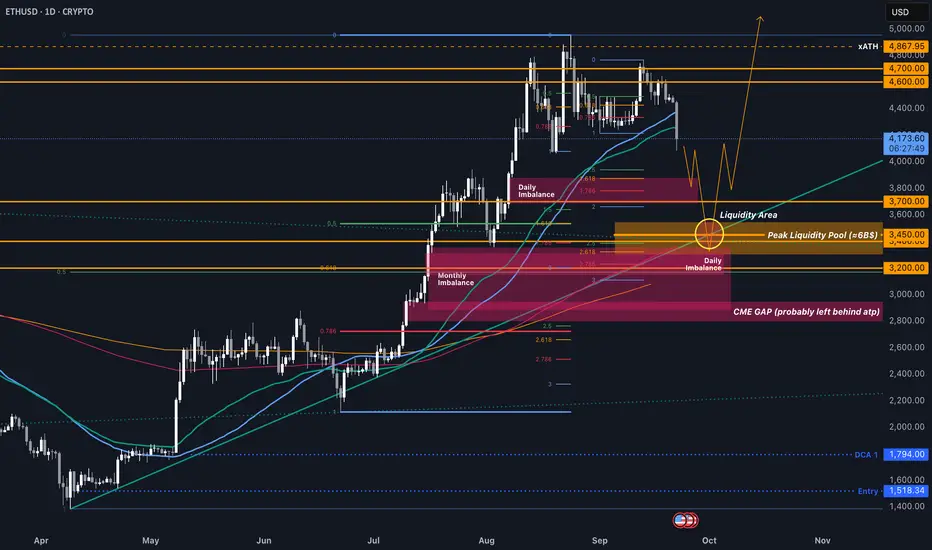
Possible Pre-Skyrocket ManipulationSince every soul on this earth knows that we will see huge bull-moves with given and upcoming rate cuts + october price action, its not unlikely that we COULD manipulate even lower after the Billion Dollar liquidation move overnight.
IF we do so, we would do it pretty fast and continue the displacement from the bearish head and shoulders pattern that broke the daily 50 EMA%SMA in the next few weeks.
On a technical site, there is still a huge amount of liquidity on CRYPTO:ETHUSD left (around 20B$), most accumulated at around 3.450$.
Strangely enough, that area matches the current ranges equilibrium, standard deviation levels of prior bearish manipulation moves, KEY SR Levels of 3400 and 3200, monthly and daily imbalances (which will get filled sooner or later), the 200D EMA and 50W EMA, AND the current htf bullish trendline and broken triangle resistance...
If we hit this before mid-October, these will be free longs, and I will DCA into my position, which sits at 1.794$ currently.
ETH Swing Long Idea - RDM is in playETH Swing Long Idea
📊 Market Sentiment
FED has resumed its rate-cutting cycle, starting with a 0.25% cut in September, with two more 0.25% cuts expected in the coming months. Additionally, institutional liquidity inflows have accelerated as the U.S. officially adopts crypto as part of its reserves. While inflation remains elevated, the weakening labor market is forcing the FED to ease, driving more capital into risk-on assets.
📈 Technical Analysis
Price is in HTF bullish order flow, so I will only be looking for long setups.
ETH made its all-time high and is currently retracing to gather more energy for higher moves.
Price also ran the HTF Range Low liquidity, which contained significant liquidity — an engineered move I expect to lead the market higher.
📘 Range Deviation Model (RDM)
In this model, I define the HTF Range High/Low. I wait for price to run one side of the range liquidity (either Range High or Range Low), then close back inside the range. That becomes the entry trigger, targeting internal range liquidity first. If HTF trend supports, the opposite range liquidity becomes the full target.
📌 Game Plan
I will be playing the Range Deviation Model (RDM) here.
Looking for a daily close above 4065$ as validation.
🎯 Setup Trigger
Entry after daily close above 4065$.
📋 Trade Management
Stoploss: 4000$
Targets:
TP1: 4484$
TP2: 4700$
TP3: 4965$
💬 Like, follow, and comment if you find this setup valuable!
⚠️ Disclaimer: This content is for informational and educational purposes only and does not constitute financial, investment, or trading advice. Always DYOR before making any financial decisions.

BTC Testing Critical Levels: Will $110K Hold the Line?What we said earlier, I hope many of you are safe.
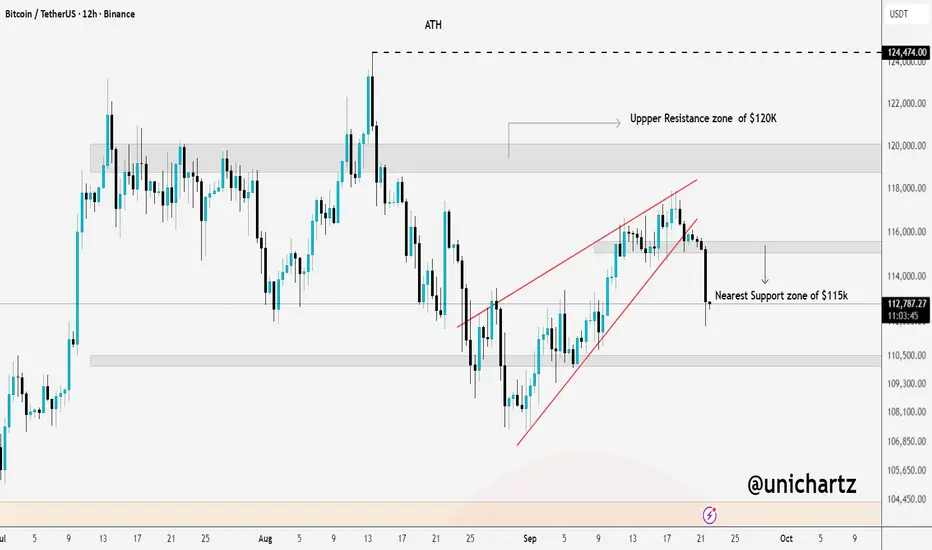
CRYPTOCAP:BTC has broken down from the rising wedge and already sliced through the $115K support zone. The next major level to watch is the psychological support at $110K. If buyers defend that area, the market could stabilize, but if $110K fails, we’re looking at a deeper correction ahead.
In short: $115K is gone, $110K now becomes the crucial line in the sand.
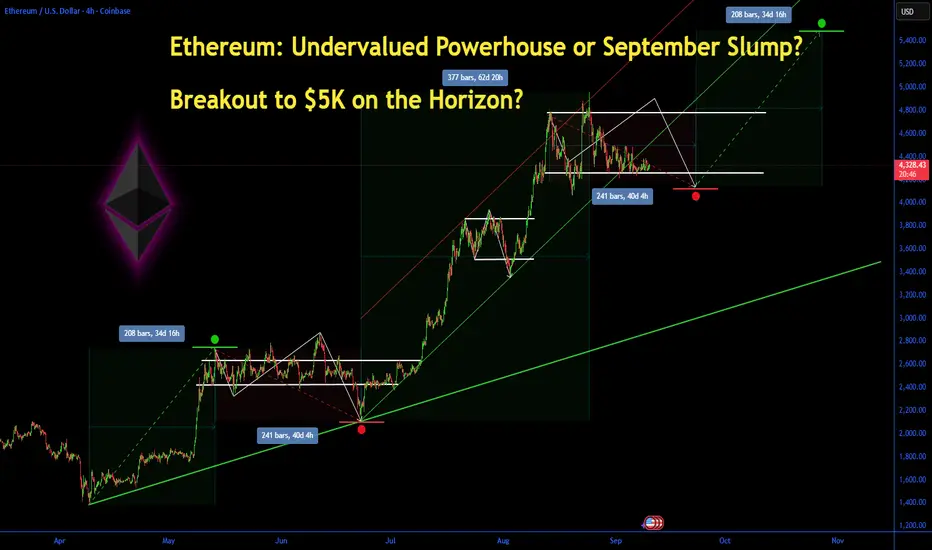
Ethereum: Undervalued Powerhouse or September Slump? Ethereum: Undervalued Powerhouse or September Slump? Breakout to $5K on the Horizon?
Ethereum (ETH) has held steady around $4,300 this month amid a choppy crypto market, down about 15% from its August all-time high but showing resilience with a modest 0.52% gain today to $4,328.5. Early September saw over $500 million in outflows from spot Ethereum ETFs, reversing summer inflows and fueling doubts about institutional appetite.
Yet, with analysts eyeing a potential rally to $9,000–$12,000 by year-end 2025 driven by ETF rotation and broader adoption, is ETH the undervalued blue-chip crypto ready for a rebound, or will seasonal weakness cap its upside? Let's dive into the fundamentals, charts, and key levels to navigate this pivotal moment.
Fundamental Analysis
Ethereum's core drivers remain tied to its ecosystem growth and macroeconomic tailwinds, but recent ETF flows have introduced volatility. As the backbone for DeFi, NFTs, and layer-2 scaling, ETH benefits from rising staking rewards and network upgrades like Dencun, which have boosted efficiency.
Analysts project ETH could hit $5,194 by late September, with long-term forecasts up to $12,000 in 2025 if institutional demand surges via ETFs. However, sticky inflation and Fed policy uncertainty could delay rate cuts, pressuring risk assets like crypto.
- **Positive:**
- Record ETF inflows in July–August signal growing institutional interest; recent positive territory returns hint at rotation back to ETH.
- Staking growth and adoption in DeFi (e.g., Aave, Uniswap) underscore undervaluation, with ETH's market cap at ~$520 billion versus Bitcoin's dominance.
- Broader trends like AI-blockchain integration and regulatory clarity (e.g., potential spot ETFs for challengers like Sui) bolster ETH's utility.
- **Negative:**
- $500M+ ETF outflows in early September reflect profit-taking and risk-off sentiment amid U.S. labor market weakness.
- Seasonal September weakness in crypto, compounded by geopolitical risks, could extend the correction if Bitcoin falters.
Technical Analysis
On the daily chart, ETH is coiling in a tight symmetrical triangle pattern after bouncing from the $4,320–$4,325 support base, with volume picking up on the upside. This consolidation follows a descending channel breakdown, but the hold above key EMAs suggests building momentum for a potential impulse wave higher. Current price: $4,328.5, with VWAP at $4,300 providing intraday support.
Key indicators:
- **RSI (14-day):** Hovering at 48, neutral but nearing oversold territory— a dip below 40 could signal a strong bounce. 📈
- **MACD:** Histogram in negative territory, but the signal line crossover is imminent, hinting at bullish divergence if volume confirms. ⚠️
- **Moving Averages:** Price above the 21-day EMA ($4,280) but testing the 50-day SMA ($4,350)—a sustained hold here avoids short-term bearish pressure.
Support/Resistance: Firm support at $4,320 (recent low and 200-day EMA), with major resistance at $4,500 (August high). Patterns/Momentum: The triangle apex nears; a bullish breakout above $4,500 could target $4,800–$4,952, while failure risks a retest of $4,200. 🟢 Bullish signals: Accumulation on hourly charts. 🔴 Bearish risks: Death cross if 50-day SMA flips below 200-day.
Scenarios and Risk Management
- **Bullish Scenario:** A clean break above $4,500 on ETF inflow news or positive macro data (e.g., softer PCE) targets $4,800 initially, then $5,000–$9,000 by Q4. Buy on pullbacks to $4,320 support for optimal entry.
- **Bearish Scenario:** Drop below $4,320 eyes $4,200 (psychological level); a full death cross could accelerate to $3,800. Avoid longs if Bitcoin slips under $60K.
- **Neutral/Goldilocks:** Range-bound $4,200–$4,500 if data remains mixed, ideal for scalping or options plays.
Risk Tips: Set stops 2–3% below support ($4,200) to cap losses. Risk no more than 1–2% of portfolio per trade. Diversify with BTC or stablecoins to hedge crypto correlations—avoid overexposure in this volatile September.
Conclusion/Outlook
Overall, a bullish bias emerges if ETH reclaims $4,500 and ETF flows reverse, positioning it as an undervalued play with 100%+ upside potential into 2025 amid institutional rotation.
But watch today's crypto volatility and upcoming Fed signals for confirmation—this fits the classic September Effect of weakness before Q4 rallies. What's your take? Bullish on ETH's rebound or sitting out the slump? Share in the comments!
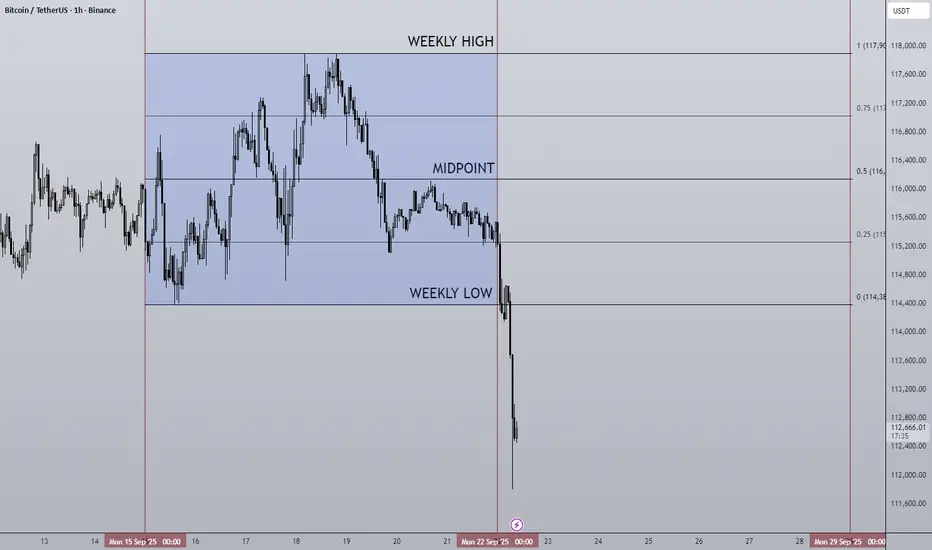
22/09/25 Weekly OutlookLast weeks high: $117,904.04
Last weeks low: $114,383.99
Midpoint: $116,144.01
A very interesting start to the week to say the least! In the opening hours of this week BTC has plunged 3% to tag $112,000, this comes off the rejection of $117,500 key level post FOMC.
The FED cut interest rates by 25bps as was expected by most, the resulting rally failed to break $117,500 resistance and rejected back to the origin of the rally at the 0.25 line. The dip from the opening hours of this week is in my opinion continuation of this rejection level. It is clear the bulls still don't have the firepower to break the range and push on, the question this week is where will BTC find support?
For me there are some key levels, 1D 200 EMA is still an option at $106,000, the daily local how at $107,500 could provide double bottom support. The Monday close will provide more context to this move, should the reaction be minimal and the daily candle closes as it is now the September curse could continue.
This week I'll be closely monitoring how altcoins react to this move, I believe the general consensus is that altcoins will outperform BTC in Q4. Historically the final quarter of the year has provided some great returns over the years, however that does not necessarily mean that will be the case this time around. If it does happen this dip may provide some good entries.
Good luck this week everybody!
ETH: Short-Term Retracement, Long-Term BullishAfter a strong upward rally, ETH’s price is currently in a phase of retracement and consolidation. Short-term upward momentum has weakened somewhat, leaving it under pressure to pull back. However, the MA20 and MA60 continue to maintain a solid upward trend, providing medium-term support for the price. That said, the MACD histogram has shown short-term contraction, indicating a slowdown in the upward momentum.
Overall, ETH’s price action today is characterized by short-term retracement but sustained upward potential in the medium to long term.
Nevertheless, the cryptocurrency market is highly volatile, so investors should closely monitor market developments and relevant news to adjust their investment strategies in a timely manner

$LINK – PREMIUM PUMP, DISCOUNT DUMP? THE SQUEEZE SETUP EXPLAINEDLINK – PREMIUM PUMP, DISCOUNT DUMP? THE SQUEEZE SETUP EXPLAINED
Traders,
LINK — and likely the broader crypto market — is setting up for a premium squeeze that turns into a discount dump.
ANALYSIS
On Binance Perpetuals you can see longs piling in near $24 while price stalls → CVD pushes up, price doesn’t. That’s buying with no progress = bearish absorption with CVD non-confirmation. Check the data here ibb.co
Aggregated Spot CVD (all exchanges) is flat. No real spot demand → only leveraged longs propping up price. Check the data here ibb.co
Price is now inside the Golden Pocket retracement zone. High-probability reaction area where strong hands fade late longers.
Measuring swing low → swing high (06 Sep – 13 Sep), price is right at the Value Area High (VAH). This is the edge of acceptance.
Confluence: we’re also tagging the upper Anchored VWAP band (green line) from both the swing high and the swing low.
→ Why this matters: Anchored VWAP tracks the average cost basis of participants from a chosen pivot. When the swing low → high AVWAP band and the swing high → low AVWAP band overlap in the same zone, it creates double confluence: longs from the bottom see this as “expensive” and reduce risk, while shorts from the top defend their break-even. Historically, these overlaps act as strong rejection zones unless fresh spot demand breaks through.
MY TAKE
Expecting rejection at $24 and a move back toward $21 (blue AVWAP test). I think - based on data - that we might move even lower.
Setup = trapped longs at premium + no spot demand + strong confluence of VAH, Golden Pocket, and dual AVWAP resistance.
Invalidation = acceptance above $25 with spot CVD joining the move.

ETH New Update (4H)This analysis is an update of the analysis you see in the "Related publications" section
Honestly, as you know, the market had been ranging for several days without much movement. On the chart, we had signs of a drop, but the drop didn’t happen, and instead the market dropped in a way that was shown.
Considering that the demand zone has held and the market is still ranging, we can return to the scenario of (this analysis () and expect to see some recoveries from Ethereum.
Either Ethereum can get rejected from the identified supply zone, or it can make a new all-time high afterwards.
For risk management, please don't forget stop loss and capital management
When we reach the first target, save some profit and then change the stop to entry
Comment if you have any questions
Thank You

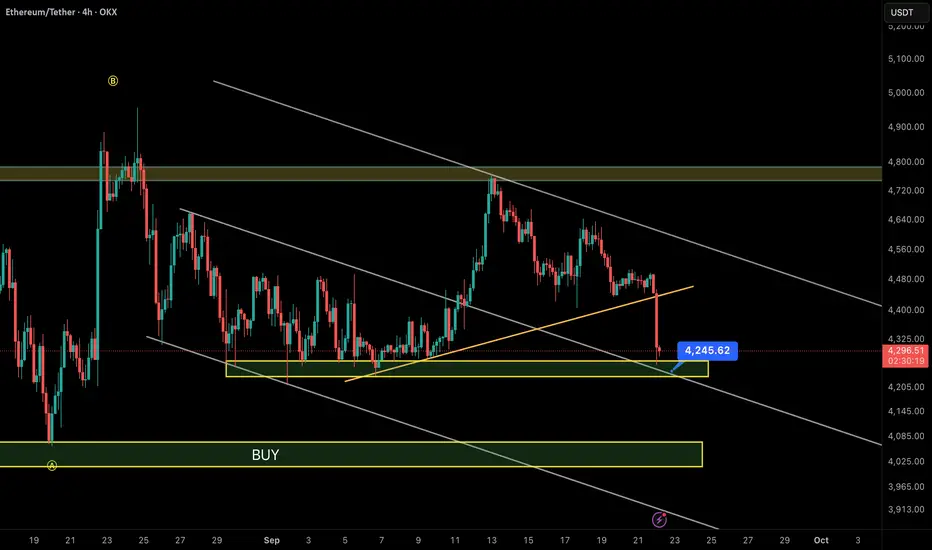
Ethereum at Critical Support – What’s Next?📊 ETH/USDT – 4H Chart Analysis
1️⃣ Descending Channel:
Ethereum is still moving inside a clear descending channel. Sellers remain in control as every rally to the channel top has been rejected.
2️⃣ Trendline Break:
The short-term ascending trendline (orange) has just been broken with strong selling pressure, dragging the price into the $4,200 – $4,250 support zone.
3️⃣ Key Support Zone:
The first major support lies at $4,200 – $4,250. If this level holds, ETH could see a short-term rebound toward $4,400 – $4,600.
4️⃣ Main Buy Zone:
If $4,200 fails, the next strong demand zone sits at $3,950 – $4,100, aligning with the lower boundary of the descending channel. This is where stronger buying interest is expected.
5️⃣ Resistance Levels:
• Near-term: $4,450 – $4,600
• Major: $4,750 – $4,800
⚖️ Summary:
• Bullish scenario: Holding $4,200 → bounce to $4,400 / $4,600.
• Bearish scenario: Losing $4,200 → drop to $4,000 – $3,950 (main BUY zone).
👉 At this stage, trading in the middle of the channel is risky. Safer entries come either near $4,000 – $4,100 or after a confirmed breakout above $4,600.
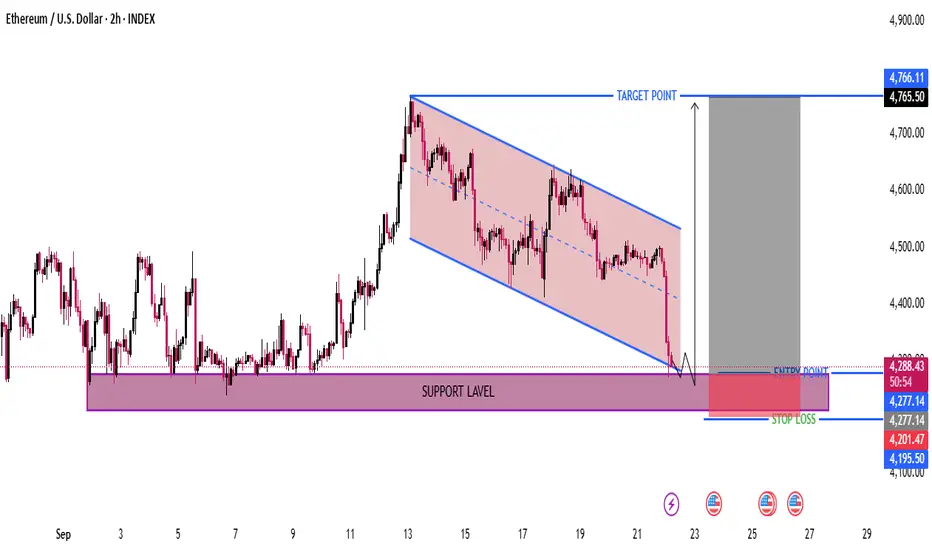
Ethereum (ETH/USD) Bullish Reversal Setup from Key Support Zone Chart Analysis
Trend
The price has been moving inside a descending channel (marked in red).
Recently, it has reached the lower boundary of the channel, showing potential for a reversal.
Support Level
A strong support zone is highlighted around $4,200 – $4,277 (purple box).
Price has tested this zone multiple times, confirming it as a key demand area.
Entry Zone
The suggested entry point is just above support, around $4,277 – $4,300.
Idea: Wait for bullish confirmation (bounce / reversal candle) before entering.
Stop Loss
Marked below the support zone, around $4,195 – $4,200.
This protects against breakdowns if ETH falls below support.
Target Point
The projected target is $4,765 (top of the channel breakout).
This aligns with the recent swing high before the downtrend began.
📊 Risk-to-Reward (Approximate)
Entry: ~ $4,277
Stop Loss: ~ $4,200 → Risk ~ $77
Target: ~ $4,765 → Reward ~ $488
RR Ratio: ~ 1 : 6.3 (very favorable)
⚠️ Key Notes
Confirmation needed: A strong bullish candle or breakout from the descending channel.
If price breaks below $4,200 support, bearish continuation likely.
Market conditions (BTC movement, macro news) can affect ETH’s reaction.
✅ Overall Setup: This is a bullish reversal setup at major support with high RR. Best strategy → wait for confirmation of bounce before entering long.
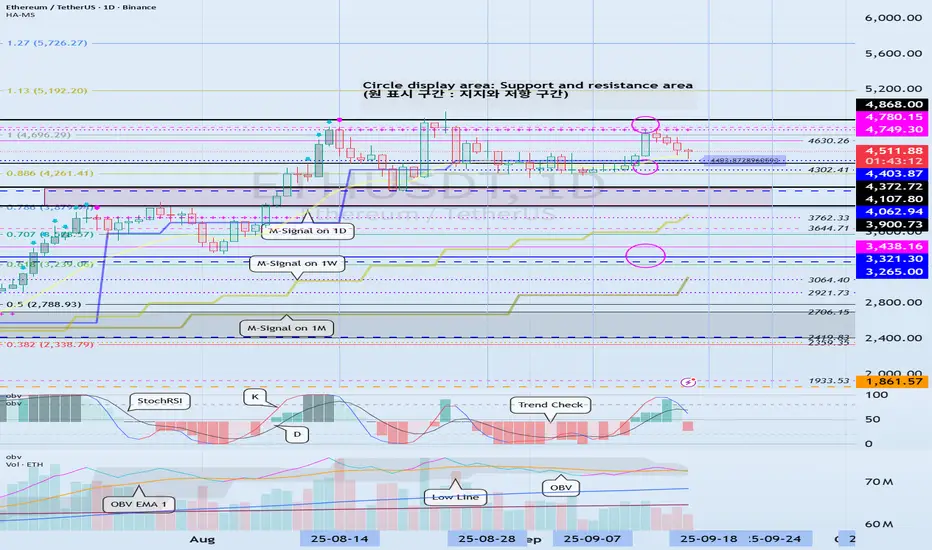
Volatility Period: Around September 18th (September 17th-19th)
Hello, fellow traders!
Follow us to get the latest information quickly.
Have a great day!
-------------------------------------
(ETHUSDT 1D Chart)
The 4403.87-4749.30 range, which is the HA-High ~ DOM (60) range, represents a resistance zone.
Therefore, we need to monitor the price movement after the current volatility period, around September 18 (September 17-19).
To sustain the uptrend, the price must remain above the 3900.73-4107.80 range.
From a medium- to long-term perspective, the 3265.0-3321.30 range is a key area.
Considering the above, if it falls below 4403.87,
1st: 4107.80-4372.72
2nd: 3265.0-3321.30
Therefore, it is likely to fall to the first and second levels above.
Therefore, the key question is whether it can find support near 4403.87 after this period of volatility.
-
When trading, it's important to understand the current price level.
I believe there are several ways to determine this.
My basic trading strategy is to determine when to trade.
My basic trading strategy is to buy when support is found in the DOM(-60) ~ HA-Low range and rise, and to sell when it touches the HA-High ~ DOM(60) range.
However, if the price rises in the HA-High ~ DOM(60) range, a step-like upward trend is likely, while if it falls in the DOM(-60) ~ HA-Low range, a step-like downward trend is likely.
Therefore, the basic trading strategy should be a segmented trading strategy.
If you were unable to buy in the DOM(-60) ~ HA-Low range, but the current price is within the DOM(-60) ~ HA-Low range, you should check for support.
Support is determined by checking whether support is found near the HA-Low or DOM(60) indicators.
If you bought when support was found near the HA-Low indicator, the first sell position would be near the DOM(60) indicator.
If you bought when support was found near the DOM(60) indicator, you should execute the trade quickly and effectively.
If the price falls below the purchase price, it would be considered a buy at the high.
To prevent this to some extent, we've utilized several indicators for verification.
First, we utilize the M-Signal indicator on the 1M, 1W, and 1D charts.
That is, if the M-Signal indicator is passing near important support and resistance levels, the presence of support in that area is likely to play a more important role.
Currently, the M-Signal indicator on the 1D chart is passing near 4403.87, so we should consider the area around 4403.87 as a potential important support and resistance level.
Second, we should monitor the movements of auxiliary indicators such as the TC (Trend Check) indicator, the StochRSI indicator, and the On-By-Signal (OBV) indicator.
For the price to continue its upward trend in this important support area,
- the StochRSI indicator must show an upward trend. If possible, it's best to avoid entering the overbought zone.
- The OBV indicator should be showing an upward trend. If possible, it should remain above the High Line.
- The TC (Trend Check) indicator should be showing an upward trend. If possible, it should remain above the 0 level.
By monitoring the movements of the three indicators above, you can determine whether there is support near important support and resistance levels.
However, you should not blindly trust the movements of auxiliary indicators. Even if you have identified the movements of auxiliary indicators, you should always monitor the price movement.
To determine support, you should monitor the price movement for at least 1-3 days.
This is especially important during periods of volatility.
Volatility is a period where you cannot predict the direction of movement, so extra caution is required.
Therefore, if possible, it's better to observe the situation and find a trading opportunity after the volatility period has passed rather than entering a new trade during a volatile period.
-
Thank you for reading to the end. I wish you successful trading.
--------------------------------------------------
- Here's an explanation of the big picture.
(3-year bull market, 1-year bear market pattern)
I'll explain more in detail when the bear market begins.
------------------------------------------------------
Ethereum at Weekly Supply Zone – Possible Drop AheadHello everybody,
Price is currently at the weekly supply zone.
It has broken an upward trendline and pulled back to retest it.
A decline from this area is expected.
The most likely target is the nearest demand zone, around 3800.
Manage your risk and trade safe!

Ethereum Price Steady at $4,500—Here’s What’s Ahead For ETHEthereum’s price is currently trading at $4,468, just shy of the $4,500 resistance. The altcoin has been consolidating near this level, showing resilience even as broader market trends remain mixed.
Given the supportive market sentiment and accumulation trend, Ethereum is poised to reclaim $4,500 as a support floor. Successfully flipping this level could pave the way for ETH to challenge the $4,775 resistance in the coming days.
However, downside risks remain if bearish pressure builds. In such a scenario, Ethereum could lose footing and slip to the $4,307 support level. A drop to this zone would invalidate the bullish thesis temporarily and deepen potential investor losses

ETH 1H Analysis - Key Triggers Ahead | Day 24😃 Hey , how's it going ? Come over here — Winter got something for you!
⏰ We’re analyzing ETH on the 1-Hour timeframe.
👀 On the 1-hour timeframe for Ethereum, we can see that after testing its major buyer zone, ETH bounced and entered a consolidation phase. This sideways movement is mainly due to the weekend slowdown. I’ve highlighted the range boundaries — a breakout above or below will provide us with trading opportunities. ETH is one of the few coins that has managed to hold its ground at a solid price level, showing strong potential for further growth.
🧮 Looking at the RSI oscillator, we’ve identified two key levels 30 (oversell) & 58 (local RSI ceiling) If ETH breaks these levels, it could trigger a breakout from this tight range and start a stronger move.
🕯 Currently, the green candles are larger in size and volume, but since it’s the weekend, ETH has been mostly off traders’ watchlists. We need to wait for the new weekly open to see how market participants will react.
💸 On the ETHBTC pair (1H timeframe), we’re seeing a similar setup to ETHUSDT. A breakout above or below the current range could start the next move. Adding this pair to the watchlist can provide confirmation for Ethereum setups.
🧠 For a long position on ETH, it’s important that the coin enters a clear buying phase — similar to the strong pumps we’ve seen before. Recently, however, ETH has faced profit-taking and sharp sell-offs after rallies. The coming week will show us whether this pattern continues or a stronger bullish move emerges.
❤️ Disclaimer : This analysis is purely based on my personal opinion and I only trade if the stated triggers are activated .

ETHER HIGH PROBABILITY SETUP SOON!!!🚨 ETHUSD HIGH PROBABILITY BUY SETUP 🚨
* Here We Can See Clearly The Next Potential Move For Ethereum Coming Hours/Days.
* Keep Your Eyes Close On Your Trading Positions.
* Happy PIP Hunting Traders.
FXKILLA.

LTC/USDT | Litecoin Consolidating – Can Bulls Smash $150 RSTNCE!By analyzing the Litecoin (LTC) chart on the weekly (logarithmic) timeframe, we can see that after our last analysis, the price successfully reached the targets at $92.5 and $115. Currently, it is trading around $115.
The price now faces a strong resistance zone between $120–$150. Litecoin is consolidating and building enough momentum to attempt a strong breakout of this zone. If it manages to break through, the next bullish targets will be $155, $200, and $268.
Please support me with your likes and comments to motivate me to share more analysis with you and share your opinion about the possible trend of this chart with me !
Best Regards , Arman Shaban


WLFI/USDT — Ascending Triangle Pressing: Major Breakout?📊 Full Analysis
The WLFI/USDT pair on the 4-hour timeframe is forming a clear Ascending Triangle pattern:
A strong horizontal resistance around 0.2410, repeatedly tested but not yet broken.
Higher Lows along the ascending trendline (yellow) show growing buyer strength and continuous accumulation.
This structure is a classic bullish continuation pattern, signaling that the market is building momentum for a potential breakout.
Still, crypto markets are never one-sided. Failure to break higher could lead to a sharp rejection or even a breakdown.
---
🟢 Bullish Scenario
1. A valid breakout occurs if the 4H candle closes above 0.2410–0.245 with strong volume.
2. If confirmed, upside targets based on the measured move are:
Conservative target: 0.28 – 0.30
Full measured move: 0.30 – 0.32
3. Watch for a possible retest of 0.241 as new support. A successful retest bounce would reinforce bullish continuation.
---
🔴 Bearish Scenario
1. If the price fails to break 0.2410, a rejection may send it back toward the ascending trendline support.
2. A confirmed breakdown below 0.225–0.228 invalidates the ascending triangle.
3. Bearish downside levels to watch:
First support zone: 0.20
Major support: 0.161 (previous significant low).
---
🎯 Key Levels
Resistance zone: 0.2410 – 0.245
Dynamic trendline support: 0.225 – 0.228
Next supports: 0.20 → 0.161
Bullish targets: 0.28 – 0.32
---
⚖️ Conclusion
WLFI/USDT is at a critical crossroads. The Ascending Triangle signals that buyers are steadily pressuring resistance. A confirmed breakout above 0.2410 with volume could unlock the path toward 0.30–0.32.
However, failure at resistance combined with a trendline breakdown could trigger a correction back to 0.20 or even 0.161.
Best strategy: wait for confirmation (breakout or breakdown), manage risk carefully, and scale out profits at key target levels.
---
#WLFI #WLFIUSDT #Crypto #Altcoin #AscendingTriangle #ChartPattern #Breakout #Bullish #Bearish #SupportResistance #PriceAction #TechnicalAnalysis
