Ethereum (Cryptocurrency)

Bitcoin Roars Above $120K, ATH on the RadarBitcoin just blasted through resistance and is charging straight toward its all-time high.
The beast is alive and moving with power. 🚀
#PEACE

Gold’s Bull Run Could Test $4k by Year-EndGold has been on a powerful run, breaking out of previous consolidation zones and holding strong above its key moving averages. The momentum on the weekly chart looks intact, and price action is now pushing into the $3,800–$3,900 range.
If this trend continues, the next big psychological level to watch is $4,000. That zone also lines up with a strong area of interest where some profit-taking could happen. As long as gold stays above the 33 EMA and keeps closing strong on higher timeframes, the path toward $4k by year-end looks very realistic.
In short, buyers are clearly in control, and gold is steadily marching toward uncharted territory.

ETH Top / all time high In my earlier analysis I predicted the 2020 September happening again and it is happening as you are reading this.
From the chart and my analysis I can see ETH topping out around 6.8K this run !
I know, we are all hoping for 12K this BullRun and more but personally I am taking out profits around 6K slowly until the top hits and see a clear reversal.

Bearish Gartley Potential on BTCTarget is around ~120,800 for the 0.786 retrace.
- 4hr RSI showing extreme levels
- Currently meets all criteria for a Bearish Gartley pattern

ETHEREUM LOCAL SHORT|
✅ETHUSD rejected a premium supply level, showing displacement after inefficiency fill. Order flow signals bearish intent, with liquidity below 4,320$ likely targeted for rebalancing. Time Frame 8H.
SHORT🔥
✅Like and subscribe to never miss a new idea!✅

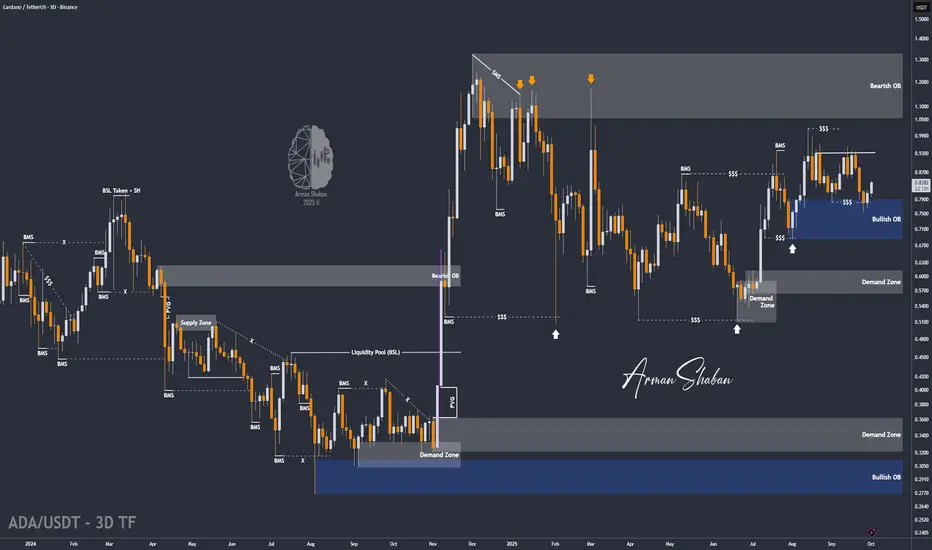
ADA/USDT | ADA Breakout Setup – More Upside AheadBy analyzing the Cardano (ADA) chart on the 3-day timeframe, we can see that the price has started to rise as expected and is now close to the first target at $0.85, giving us more than 11% gains from the previous analysis so far.
All other points from the last analysis remain valid. The next short-term targets are $0.95 and $1.00, while the mid-term targets are $1.05, $1.17, and $1.33.
Please support me with your likes and comments to motivate me to share more analysis with you and share your opinion about the possible trend of this chart with me !
Best Regards , Arman Shaban
Ethereum Price Approaches $4,500 Despite Crucial Holders’ ExitEthereum is trading at $4,383, just below the $4,500 resistance level. The altcoin king has attempted several times to secure $4,500 as a support floor but has not yet succeeded. This remains the most critical barrier in determining ETH’s near-term direction.
If inflows continue strengthening, ETH could break past $4,500 and secure it as support. Such a move would pave the way for a rise toward $4,775 and potentially retest the all-time high of $4,956. The continuation of this momentum would reinforce a strongly bullish outlook.
However, failure to breach resistance could change sentiment. Ethereum risks slipping back to $4,222 support, with the possibility of falling to $4,074. Such a decline would invalidate the bullish thesis and signal renewed weakness in the altcoin king’s price action.

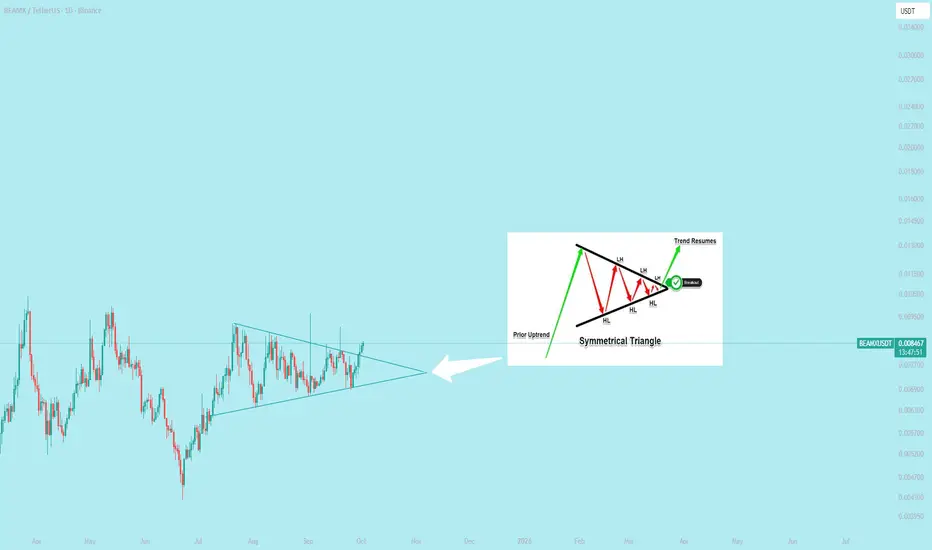
$BEAMX Breakout bullish symmetrical pattern in Daily time frame
**Execute the trade**
Once the breakout is confirmed, there are two primary entry strategies:
**Aggressive entry**: Enter a long position immediately after a candle closes above the upper trendline.
**Conservative entry:** Wait for a retest of the broken trendline, which now acts as a support level. Enter a long position when the price bounces off this line. This approach offers a tighter stop-loss but may cause you to miss the trade if the price does not retest the trendline.
@everyone
Has the Toxicity of Ethereum been seen? Charts never Lie
It really is as simple as that
THESE ARE THE DAILY TOTAL CRYPTO MARKET CAP CHARTS
Top line - TOTAL Crypto Market Cap - TOTAL 2 (Excluding BTC )
Bottom Line - TOTAL 3 ( Excluding BTC & ETH ) - OTHERS ( Top 125 coins minus Top 50 by market cap )
TOTAL 3 is ALL ALT coins
OTHERS is Mid to Lower Cap ALT coins
These 4 Charts use the VRVP
the Volume Profile Visible Range (VPVR), is a technical analysis indicator on TradingView that displays the distribution of trading volume at different price levels within the currently visible range of a chart.
The Colour Key is below
Value Area High ( VAH ) - Yellow Dashed Line
Value Area Low ( VAL ) - Red Dashed line
Point of Control ( POC ) - Red Dotted line
Developing POC - Blue Dashed line
Developing Value Area - Purple Dotted line
The Thing to note here is how EVERY TOTAL chart is above its own Value Area High EXCEPT the TOTAL 2 Chart
TOTAL 2 is all Crypto except BTC, so it is not BTC holding this back.
The TOTAL 3 chart , that is Everything except BTC and ETH. is above its own Value area High, nothing holding it back.
This clearly shows that ETH is the Stagnant Crypto token here.
We could start talking about how the SEC refused to state if ETH was ever a security in the days gone past, in the Dark and murky world of pre regulation. How ETH was adopted by the USA as "Its own Crypto". How ETH is NOT decentralised because the more you have, the more "Voting" rights you have. How FTX used ETH in its bribery attempts.
Many consider the ETH to have been the 2nd Crypto to arrive after Bitcoin...This is not the case.. LITECOIN was the 2nd....ETH came many years later.
Anyway..The charts say it all..
ETH is not being asopted really......and compared to BITCOIN.....
The ETH BTC chart also says it all
It has recovered a little But has NOT broken the long term resistance
The Next few weeks are Critical for the Toxic Token.
There is room to ETH to recover and it will likely break that line of resistance but there are certainly better returns and projects to invest in.

ETHEREUM - THE TRAP IS UNFOLDING – EXPECT A BLOODBATH!As I mentioned in my latest Bitcoin and ChainLink analysis , I believe the crypto market is setting up for a huge long squeeze. Let’s break down why this move looks fragile and why you should be cautious.
What do we need for a healthy rally?
Spot demand – Real buyers (spot market) need to step in and absorb supply. Without this, rallies are built on leverage and tend to collapse quickly.
Controlled leverage – A healthy move isn’t fueled by overleveraged longs. If open interest keeps spiking while spot demand is flat or negative, that’s a recipe for a squeeze.
Auction structure support – Price should build strong bases (value areas, balanced profiles) instead of just ripping up through inefficiencies.
Right now? We don’t have these ingredients.
Step 1: Look at CRYPTOCAP:TOTAL3
For those unfamiliar, CRYPTOCAP:TOTAL3 is the crypto market cap excluding BTC and ETH. It’s a great index to measure the “altcoin market” and often shows where broader crypto is heading.
Now let’s apply some tools:
Anchored VWAP (AVWAP): Tracks the average position of buyers/sellers from a specific swing (like a cost-basis anchor).
Fixed Range Volume Profile (FRVP): Shows where most trading occurred (value area, POC, low/high volume nodes).
What CRYPTOCAP:TOTAL3 shows:
The upper AVWAP band from the swing low (A) is at 1.12T.
The upper AVWAP band from the swing high (B) is also at 1.12T.
Price is retracing into the Value Area High (VAH). This lines up with:
An ascending trendline retest and a Fib retrace (0.75–0.786 zone).
When AVWAP bands from opposite swings collide like this, it’s a double-sided supply zone.
Longs from the low see this area as “expensive” → they reduce risk.
Shorts from the top defend their break-even.
This creates a congestion zone where strong reversals often happen unless fresh spot demand breaks through.
Example: Imagine two teams pushing on opposite sides of a door at the same time. Unless one side gets backup (spot demand), the door doesn’t move — it slams shut.
Step 2: Apply This to CRYPTOCAP:ETH
Now, let’s clear one thing up: CRYPTOCAP:TOTAL3 excludes both Bitcoin and Ethereum. It’s basically the “altcoin index,” showing how the rest of the market behaves without the two giants.
But here’s why it still matters for ETH:
ETH often moves in strong correlation with altcoins, especially during risk-on or risk-off events.
When CRYPTOCAP:TOTAL3 is at a critical resistance or AVWAP collision zone, it usually signals that risk appetite across alts is stretched.
And since ETH trades like a “bridge asset” between BTC and alts, it tends to get caught in the same flows.
So while ETH isn’t included in CRYPTOCAP:TOTAL3 , the technical structure of CRYPTOCAP:TOTAL3 gives us strong hints about where ETH and the altcoin market could be heading.
Step 3: Check USDT Dominance (USDT.D)
Yes, you can chart USDT dominance, and it’s often a leading indicator. Why?
If USDT.D goes up → money flows into stablecoins → crypto selling pressure.
If USDT.D goes down → money flows into crypto → bullish risk-on move.
Right now:
USDT.D broke out of a descending trendline and is retesting the breakout region.
It’s also printing a harmonic pattern that suggests upside continuation.
Step 4: Order Flow – who’s really buying ETH?
This is where the story gets clear:
Aggregated Spot CVD = trending down heavily.
Price goes up while spot CVD goes down = spot is selling into strength → no real demand.
Futures CVD (stablecoin-margined) = trending up heavily.
This means perps are pushing price higher with leverage.
Futures CVD (coin-margined) = trending down.
Another divergence → no strong confirmation from that side either.
Stablecoin OI:
First impulse up = OI dropped → shorts closing, not buyers entering.
Since Oct 1, OI rising → new longs piling in.
ByBit Order Flow: heavy leveraged longs entering, but looks like absorption.
For those that don't understand it:The rally is built on FOMO leverage longs, not real buyers. That’s fragile.
Conclusion
All the ingredients are here for a mega squeeze:
CRYPTOCAP:TOTAL3 at double AVWAP + VAH + Fib confluence,
ETH backfilling inefficiencies into double AVWAP supply,
USDT dominance signaling risk-off,
Order flow showing no spot demand, only leveraged perp longs.
When this unwinds, it won’t just be ETH. Expect broad crypto to follow.
The trap is unfolding. Don’t get caught on the wrong side.
$ETH mega run is loading.
Ethereum has experienced nearly identical scenarios across three distinct market cycles.
• 🔓 Major Resistance is breaking
• 🔁 Before Running Retest
• 💥 And then Parabolic run
We are currently in the third cycle, and Ethereum has again tested the same horizontal level. In the previous two cycles, this movement was followed by a parabolic run.

ETH 02.10#ETH
Ether doesn't care about any resistance right now, and there's nothing holding it back until it reaches the liquidity zone and the upper limit of the range around 4700. The HTF can't afford to lose 4200. There's plenty of local liquidity at 4280, and 4300 is the fair value (POC) zone in the range since August. We might struggle here for a while if they don't allow a direct expansion to 4700 without any pauses.
Support zones:
4268-4280
4200-4230
Resistance zones:
4456-4480
4660-4724
4768-4780

MYX: History Repeats – Will We See Another Boom?LSE:MYX has been following a clear accumulation pattern, with a sharp rally after each phase. Currently in a similar setup, the price is consolidating, and if history repeats, we could see another breakout soon.
Keep an eye on this, as the next move could be significant.
DYOR, NFA
#PEACE

Why Gen X Struggles with Crypto?Why does Gen X struggle with crypto?
Because they’re used to the stock market system, where ownership is recorded by a central registry and trades that are tied to a specific exchange.
In their world, you typically should buy through Nasdaq in this example and expect to sell through Nasdaq. But with Bitcoin or other cryptocurrencies, the blockchain itself is the registry, which means you can buy on one platform and sell on another freely. That shift—from centralized exchanges to decentralized settlement—is what makes crypto hard to grasp.
Mirco Bitcoin Futures and Options
Ticker: MBT
Minimum fluctuation:
$5.00 per bitcoin = $0.50 per contract
Disclaimer:
• What presented here is not a recommendation, please consult your licensed broker.
• Our mission is to create lateral thinking skills for every investor and trader, knowing when to take a calculated risk with market uncertainty and a bolder risk when opportunity arises.
CME Real-time Market Data help identify trading set-ups in real-time and express my market views. If you have futures in your trading portfolio, you can check out on CME Group data plans available that suit your trading needs www.tradingview.com

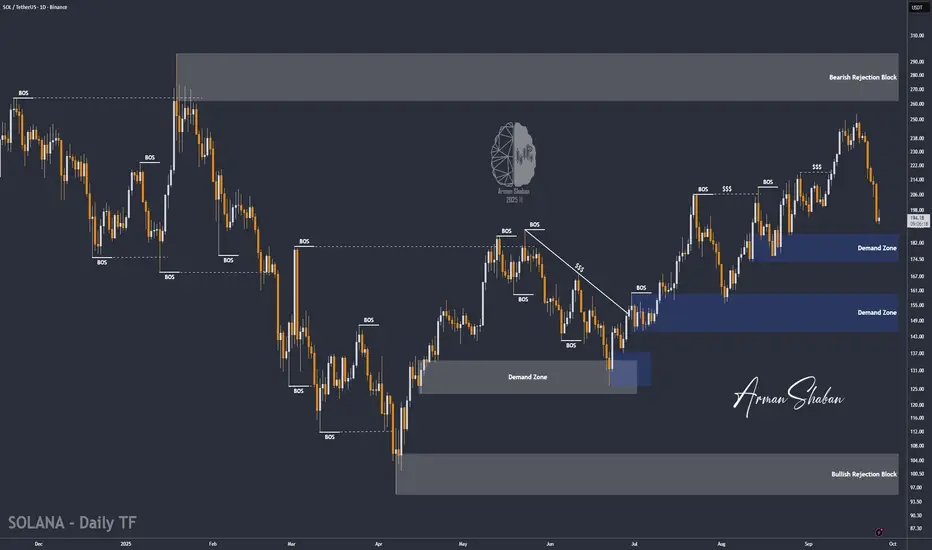
SOL/USDT | Solana Correction Could Spark Rally to $262 (READ)By analyzing the Solana chart on the daily timeframe, we can see that the price has continued its correction and is now trading around $194. As you can see, it’s getting close to the $173–$186 demand zone, and we need to watch whether this zone can trigger new buying pressure.
Personally, I expect a strong reaction from this area. If the price stabilizes here and shows the first signs of growth, the possible upside targets will be $205, $230, $242, $254, and $262.
Please support me with your likes and comments to motivate me to share more analysis with you and share your opinion about the possible trend of this chart with me !
Best Regards , Arman Shaban
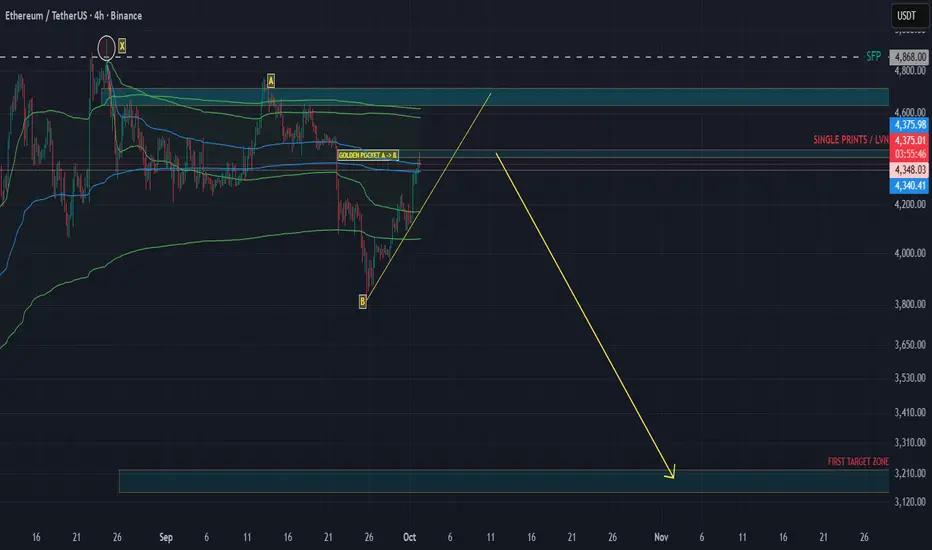
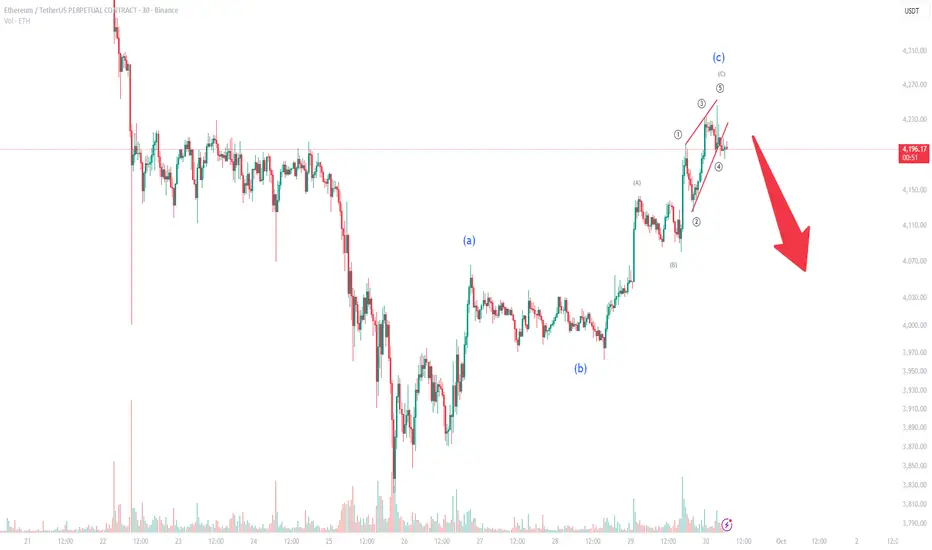
Ethereum Elliott Wave Update: Correction Ahead?Ethereum has recently completed the final leg of its ABC corrective structure, with the C-wave forming as a clear ending diagonal. This technical pattern often signals exhaustion in the current upward move and hints at a potential reversal.
With the structure now completed, a corrective move is likely. Current price action suggests that Ethereum could retrace toward the $4,000 support region, which aligns with both technical targets and key psychological levels.
📉 Trading Outlook:
Short-term traders should be cautious of potential downside volatility.
A corrective wave into the $4,000 zone may offer opportunities for repositioning or new entries depending on market reaction.
Risk management remains essential, as invalidation of the diagonal would occur if ETH pushes significantly higher without correction.
In summary, Ethereum’s Elliott Wave count points toward a possible short-term pullback before the broader trend becomes clearer. Traders should keep a close eye on the $4,000 level for signs of support and potential bullish re-engagement.
Eth/Usd - Bearish Reversal After Resistance Rejection This chart shows the recent price movement of Ethereum (ETH) against the U.S. Dollar on the 15-minute timeframe. The market initially found strong support in the green zone at the bottom, where price reversed and started moving upwards. This area marked the beginning of a bullish trend, confirmed by breaks of structure (BOS) and a change of character (CHoCH)—indicating a shift from bearish to bullish momentum.
Following this, ETH made a strong bullish move, breaking past previous highs and entering a resistance zone marked in blue. However, once price entered this resistance area, it began to slow down and form what is labeled a “Weak High”, meaning buyers were losing strength and struggling to push price higher.
The chart highlights a potential short trade setup: If a candle closes below the marked support level just under the resistance zone, it would suggest the start of a bearish move. In that case, the suggested trade is to enter a short position and aim for the lower support area (target zone) where the price may again find demand.
This setup reflects a possible trend reversal from bullish to bearish in the short term, especially if price fails to maintain above the resistance and breaks the nearby support.

EtherFi ETH.fi price analysis⁉️ Increased trading volumes, shrinking growth candlesticks, and a trend line "overhang" - for us, these factors indicate the likelihood that a correction is near.... And for you?
The #ETHfi price shot up nicely thanks to promising updates to the #Ethereum ecosystem, about which we write a few posts early.
🟢 And of course, there are further prospects for the growth of the #Etherfi project, because now the capitalization is only $375 million.
🔴 But still, in our opinion, the price of OKX:ETHFIUSDT would still be suitable to slightly correct to $0.84-0.74-0.64, whoever likes which figure)
🔝 And from there, with new strength, break through the trend to new heights.
_____________________
Did you like our analysis? Leave a comment, like, and follow to get more

ETH 1H Analysis - Key Triggers Ahead | Day 29❄️ Welcome to the cryptos winter , I hope you’ve started your day well.
⏰ We’re analyzing ETH on the 1-Hour timeframe .
👀 On the 1-hour chart , After breaking lower resistance zones, ETH started a strong bullish leg toward higher resistance. It reacted to these levels but moved upward with micro-buyer support. Currently at $4323, a key seller ticker zone—breaking this could push ETH higher. Note: Trend shows some weakness; sell candles are engulfed but smaller. Over 90% of holders are in profit, causing frequent stop-hunts on selling pressure.
🧮 RSI: After moving from near oversold to overbought, RSI is cooling near the 70 level. With increased long volatility, multiple buy positions could form, but rejection here may lead to a correction. Key static resistance is 70; swing support is at 50.
🕯 Volume & Candles: Recent candle size and volume surged as buyers entered, but approaching $4300 resistance shows trend weakness. Candle size decreased; profit-taking and minor pullbacks are possible. For trend continuation, higher volume and repeated buying pushing ETH toward overbought are needed.
📊 Liquidation Heatmap : Unlike BTC, long and short orders cluster sparsely, forming max-pain zones. ETH approaching $4380 could trigger a short squeeze and remove the seller ticker, pushing toward $4500. Next long max-pain is $4246, with lower support around $4100. ETH is in a near-decision zone with one bullish leg.
💸 ETHBTC Pair Currently in a trading range; the floor is Maker Buyer Zone , the ceiling is Taker Seller Zone. Price bounced well from the floor. High concentration of longs and shorts makes range boundaries critical—breaking either could trigger a sharp move. Price is near 0.037 resistance, RSI close to swing resistance. Buyer and whale support could enable another bullish leg; rejection may slightly increase risk of range breakdown.
🧠 Focus on BINANCE:ETHBTC wait for exit from the trading range, then check ETH/USDT. Often aligns with BTC dominance drops. Selling volume in ETHBTC is decent; if whales add volume, this setup provides optimal trade duration.
↗️ Risky Long Scenario: Break 0.037 resistance ETHBTC, BTC dominance drop, breaking ETH/USDT seller ticker, RSI stabilizes in overbought. Small stop-loss; trade is risky but viable.
📉 High-Risky Short Scenario: Rejection from current zone, ETH/BTC rejection, swing rejections, indecision candles multi-timeframe, SMA7 touch, and rising sell volume could signal short positions.
❤️ Disclaimer : This analysis is purely based on my personal opinion and I only trade if the stated triggers are activated .

This month Will Define This Entire Crypto Cycle🎯 October Just Started — And It Might Define This Entire Crypto Cycle 📈
Happy October, everyone — a month with a powerful pattern.
If history repeats, this could be a defining moment:
2017 saw a 5x BTC rally in 60 days,
2021 delivered a 2.5x in just 45 days.
Now it’s 2025 , and we’re watching the charts line up once again. 🔁
We’ve been long Bitcoin since two days ago, right off the support at the bottom of the channel — a level we’ve tracked since March 14, 2023 .
That same chart gave us:
42K (hit summer 2023)
46K (initial rejection, later support)
And now, we’re targeting 127,370 → 138K–140K as part of the final macro wave. 🚀
Ethereum is showing strength too. From a solid buy zone near 4,000 , I still believe the next key levels are 6,443 and 10,364 .
Altcoins? Let’s talk dominance:
Bitcoin Dominance is still high (~58%) but could drop toward 56.91 — giving room for alts to breathe.
Ethereum Dominance remains in a clear descending channel, with a clean target of 18.29% dominance.
📊 We’ve revisited Ethereum vs. BTC charts, and I remain long ETH here with a 0.06 BTC target.
Other setups:
Solana support at 204.81 , targets 240 and 276 .
XRP ? I remain cautious — still preferring ETH over XRP based on recent cycles.
Total Market Cap still shows bullish structure, aiming for 4.8T and later 6.5T .
We’ve seen the October pattern repeat across cycles. While the exact altcoin winners change (XLM & XRP in 2017, ETH in 2021), the macro truth remains:
Bitcoin tends to lead — and October tends to explode.🔥
Thought of the Day 💡
“Cycles evolve, but the rhythm remains. Each October is a chance — not a promise. But charts give us a map, and right now, the map points up.”
Disclaimer
I share market views for educational and entertainment purposes only. This is not financial advice. I am not a licensed advisor. Trade at your own risk and always manage your capital responsibly.
One Love,
The FXPROFESSOR 💙
ps. it's a video..watch it and let me know your thoughts

U.S. Government shuts down; Crypto rallies on uncertaintyU.S. Government shuts down; Crypto rallies on uncertainty
The U.S. government officially shut down on October 1, 2025, after Congress failed to agree on a budget. Disputes over spending and healthcare left agencies including the Fed, SEC, and CFTC paralyzed, delaying jobs and inflation data as well as ETF approvals for Solana and XRP.
Bitcoin, Ethereum, and other cryptocurrencies gained on Wednesday, with ETH up 4.2% to $4,330. Analysts said digital assets may be benefiting from pressure on the U.S. dollar, often seen as a trigger for crypto inflows.
Still, a prolonged shutdown could stall Fed rate-cut hopes by blocking key data releases. With borrowing costs already high, cryptos could face headwinds if the impasse drags on.

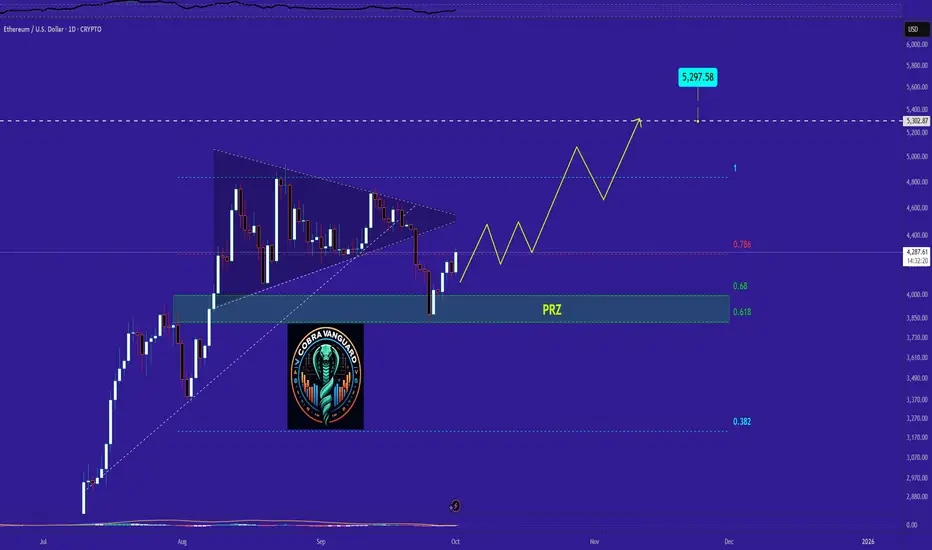
"ETH Analysis" (Update)The price can easily reach the shown targets from here.
Best regards CobraVanguard.💚
PREVIOUS ANALYSIS