ETH repeating itself with a nice move up incoming?It looks like a repeating pattern could be playing out in the ETH market.
Look for the retest of the breakout (as marked in yellow arrows) followed by a leg up back to test the ATH.
Ethereum (Cryptocurrency)
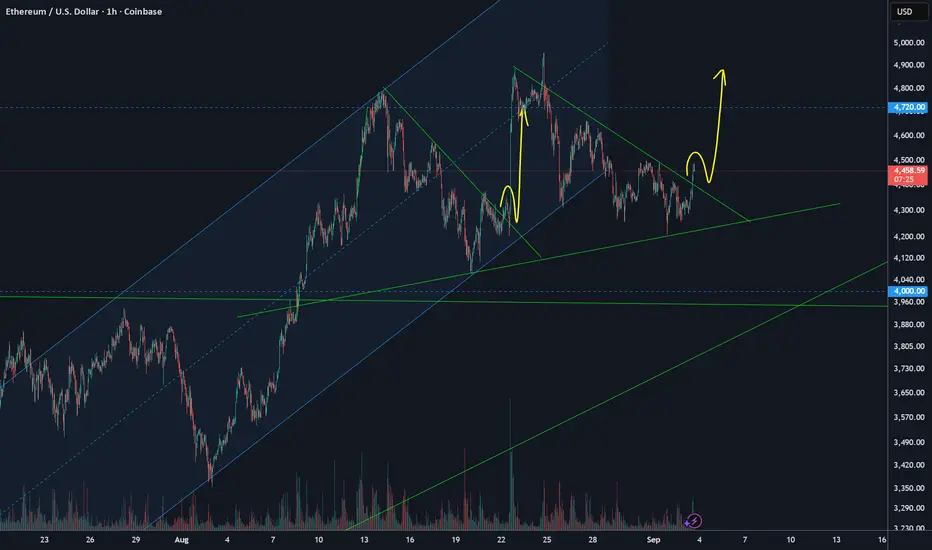
Ethereum 4H Range As we approach nearly a month in the range from $4000-4800 it looks like ETH is making a move once again.
Previously once hitting $4800 price gradually sold off back towards range low creating a bearish trendline, once the price broken above that level a rapid move up to range high within two candles.
Now looking at the chart we have a similar setup, strong breakout from the bearish trendline up into midpoint. Bitcoin currently retesting a key level of $112,000, should BTC flip this level I could see alts getting the greenlight to move up and Ethereum up to the highs.
Should BTC reject from $112,000 it makes sense that ETH range midpoint would be strong resistance, rejection could lead to a range low retest. Anything else that isn't either range high, range low or midpoint is noise and for me no action required, no need to over complicate it.

Ethereum - $4000 - $4100 is a key Buy zoneEthereum - $4000 - $4100 is a key Buy zone
Global tend is up
key zone for long is at range low
targets
- $5100
- $5500

Ethereum - Eyes 5,600–5,800 After Holding Strong Near HighsEthereum (ETHUSD) remains in a clear uptrend, consolidating just beneath its all-time highs. After printing a record high in recent weeks, ETH has shown strength by holding its gains—a typical behavior in a trending market.
🔍 Technical Breakdown:
Trend: Bullish structure intact with higher-highs and higher-lows.
Price Action: ETH is coiling within a key resistance zone (4800–5000)—often a precursor to a breakout.
Momentum: One of the top-performing assets since the April 7 market low.
📈 Targets:
Short-term: 5,600–5,800 zone is the next potential target if the breakout materializes.
Medium-term: Eyes on 7,000, with an extended move to 8,000 still on the table if momentum accelerates.
⚠️ Macro Perspective:
As price moves higher, sentiment and targets naturally expand, fueling further speculative momentum. Caution is warranted—bull markets can persist longer than expected, but parabolic moves often end abruptly.

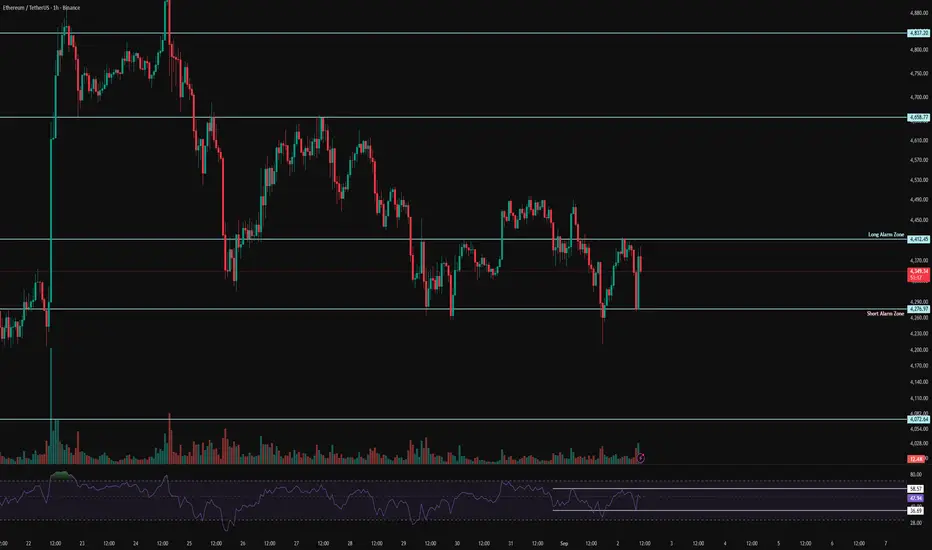
ETH 1H Analysis - Key Triggers Ahead | Day 11💀 Hey , how's it going ? Come over here — Satoshi got something for you !
⏰ We’re analyzing ETH on the 1-hour timeframe timeframe .
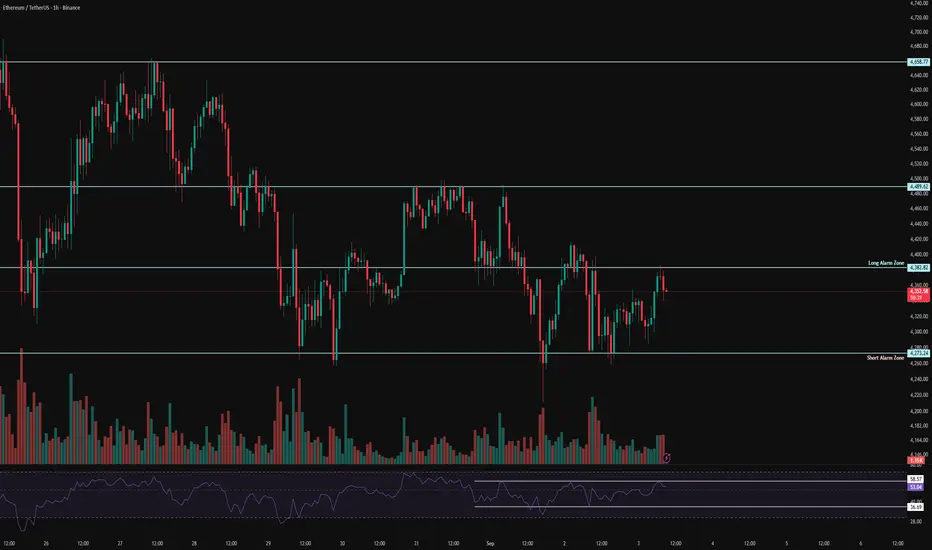
🔭 On the 1-hour timeframe of Ethereum, we can see that ETH has a similar situation to yesterday. It has an important resistance at $4382, and with a breakout and confirmation above this level, Ethereum could experience a good bullish leg. Keep in mind, according to the data we posted in the channel, yesterday people in the U.S. sold their ETH and bought Bitcoin.
⛏ Two key RSI zones for Ethereum are considered: 58 and 37. Once the oscillation limit crosses these numbers, ETH can start its move.
💰 The volume and the size of green candles in Ethereum have slightly increased, and with more volume and the filling of sell orders at the $4382 resistance, Ethereum could move upward.
🪙💸 On the 1-hour timeframe of the ETHBTC trading pair, we can see that this pair had a resistance at 0.03909, which was successfully broken with higher volume. With a completed pullback and breakout above 0.03939, Ethereum could move upward. Note that this level is directly related to the maker buyers of this pair, and in this timeframe, it’s almost at its bottom.
🔔 Two alarm zones are considered for Ethereum: the $4382 level as our long trade alarm zone, where with a breakout and confirmation above it ETH could move higher; and the $4273 level as the short trade alarm zone, where a breakdown could give us a short position.
❤️ Disclaimer : This analysis is purely based on my personal opinion and I only trade if the stated triggers are activated .
LONG ON ETH/USD ETHEREUMEthereum has a nice falling wedge into a major demand zone.
I will be taking ETH as a market buy now looking for price to reach 5000
making over 500 points to the previous High.
Ethereum bullish in SeptemberEthereum is holding above September's pivot at 4,230 and may reach the second resistance at 5,800 in the coming weeks.

ETHUSD Breakout retestThe ETHUSD remains in a bullish trend, with recent price action showing signs of a corrective pullback within the broader uptrend.
Support Zone: 4,100 – a key level from previous consolidation. Price is currently testing or approaching this level.
A bullish rebound from 4,100 would confirm ongoing upside momentum, with potential targets at:
4,450 – initial resistance
4,730 – psychological and structural level
5,070 – extended resistance on the longer-term chart
Bearish Scenario:
A confirmed break and daily close below 4,100 would weaken the bullish outlook and suggest deeper downside risk toward:
3,990 – minor support
3,830 – stronger support and potential demand zone
Outlook:
Bullish bias remains intact while the ETHUSD holds above 4,100. A sustained break below this level could shift momentum to the downside in the short term.
This communication is for informational purposes only and should not be viewed as any form of recommendation as to a particular course of action or as investment advice. It is not intended as an offer or solicitation for the purchase or sale of any financial instrument or as an official confirmation of any transaction. Opinions, estimates and assumptions expressed herein are made as of the date of this communication and are subject to change without notice. This communication has been prepared based upon information, including market prices, data and other information, believed to be reliable; however, Trade Nation does not warrant its completeness or accuracy. All market prices and market data contained in or attached to this communication are indicative and subject to change without notice.

Bearish continuation?Ethereum (ETH/USD) is rising towards the pivot which has been identified as a pullback resistance and could reverse to the 1st support.
Pivot: 4,410.37
1st Support: 4,212.04
1st Resistance: 4,502.93
Risk Warning:
Trading Forex and CFDs carries a high level of risk to your capital and you should only trade with money you can afford to lose. Trading Forex and CFDs may not be suitable for all investors, so please ensure that you fully understand the risks involved and seek independent advice if necessary.
Disclaimer:
The above opinions given constitute general market commentary, and do not constitute the opinion or advice of IC Markets or any form of personal or investment advice.
Any opinions, news, research, analyses, prices, other information, or links to third-party sites contained on this website are provided on an "as-is" basis, are intended only to be informative, is not an advice nor a recommendation, nor research, or a record of our trading prices, or an offer of, or solicitation for a transaction in any financial instrument and thus should not be treated as such. The information provided does not involve any specific investment objectives, financial situation and needs of any specific person who may receive it. Please be aware, that past performance is not a reliable indicator of future performance and/or results. Past Performance or Forward-looking scenarios based upon the reasonable beliefs of the third-party provider are not a guarantee of future performance. Actual results may differ materially from those anticipated in forward-looking or past performance statements. IC Markets makes no representation or warranty and assumes no liability as to the accuracy or completeness of the information provided, nor any loss arising from any investment based on a recommendation, forecast or any information supplied by any third-party.

ETHUSDTI think moved trend by break 4485$ resistance and 4250$ support in BINANCE:ETHUSDT .
Support: 4250 - 3900 - 3510
Resistance: 4485 - 4720 - 5000
Please control risk management.

Ethereum Whales Scoop Up 260K ETH, Fueling $5K Recovery Hopes
The cryptocurrency market is witnessing a significant shift as Ethereum whales accumulate massive positions, with recent data showing an unprecedented 260,000 ETH purchased in just 24 hours. This substantial whale activity is generating considerable optimism among investors and analysts, who are now eyeing a potential recovery toward the psychologically important $5,000 price level.
Massive Whale Accumulation Signals Market Confidence
Large-scale Ethereum holders, commonly referred to as "whales" in the cryptocurrency community, have demonstrated remarkable confidence in ETH's future prospects through their recent buying behavior. The acquisition of 260,000 ETH in a single day represents approximately $650 million worth of Ethereum at current market prices, indicating that institutional and high-net-worth investors are positioning themselves for what they perceive as an imminent price rally.
This whale accumulation pattern is particularly significant given the broader market context. While many retail investors remain cautious following recent market volatility, sophisticated investors with substantial capital reserves are taking advantage of current price levels to build sizeable positions. The concentrated nature of these purchases suggests coordinated confidence among major market participants rather than isolated buying decisions.
The timing of this accumulation is noteworthy as well. Ethereum has been trading in a consolidation phase following its previous rally, and whale activity often serves as a leading indicator of upcoming price movements. Historical data shows that significant whale accumulation periods frequently precede major price breakouts, lending credence to the bullish sentiment surrounding ETH's near-term prospects.
Bitcoin Profit Rotation Driving Ethereum Demand
A particularly interesting aspect of the current market dynamics is the apparent rotation of capital from Bitcoin into Ethereum. As Bitcoin approaches resistance levels and shows signs of consolidation, savvy investors are taking profits from their BTC positions and reallocating these funds into ETH. This rotation strategy reflects a sophisticated understanding of market cycles and the relative value proposition between the two leading cryptocurrencies.
Bitcoin's recent performance has been strong, but many analysts believe that Ethereum may offer superior upside potential in the coming months. The rotation from BTC to ETH is not merely a short-term trading strategy but reflects fundamental beliefs about Ethereum's technological advantages and ecosystem growth potential. This capital rotation is providing additional buying pressure for ETH while simultaneously reducing selling pressure from profit-taking activities.
The scale of this rotation is substantial enough to impact market dynamics significantly. When large holders move capital between cryptocurrencies, it often creates momentum that smaller investors follow, potentially amplifying the initial movement. This phenomenon could be contributing to the sustained buying pressure we're observing in Ethereum markets.
Technical Analysis Points to $5K Target
From a technical analysis perspective, the current whale accumulation is occurring at what many chartists consider optimal entry levels. Ethereum's price action has formed what appears to be a strong support base, and the addition of substantial whale buying is providing the foundation for a potential breakout to higher levels.
The $5,000 price target that has emerged in analyst discussions is not arbitrary. This level represents a significant technical milestone that would place Ethereum at new all-time highs, surpassing its previous peak reached during the 2021 bull market. Achieving this target would require approximately a 50-60% rally from current levels, which, while substantial, is not unprecedented for Ethereum during strong market phases.
Several technical indicators are aligning to support this bullish thesis. The accumulation by whales is reducing the available supply on exchanges, creating conditions for price appreciation when demand increases. Additionally, on-chain metrics show declining ETH reserves on major exchanges, suggesting that holders are moving their assets to cold storage with long-term holding intentions.
Fundamental Drivers Supporting Price Recovery
Beyond technical factors, several fundamental developments are supporting the case for Ethereum's price recovery. The network's transition to proof-of-stake consensus has fundamentally altered ETH's economic model, introducing deflationary mechanisms that reduce supply over time. This structural change creates long-term upward pressure on prices, particularly when combined with sustained demand.
The growth of decentralized finance (DeFi) continues to drive demand for ETH as the primary collateral and gas token for the Ethereum ecosystem. Recent developments, including major DeFi protocols expanding their offerings and new innovations in yield generation, are attracting both institutional and retail capital to the Ethereum network. This increased activity translates directly into increased demand for ETH.
Layer 2 scaling solutions are also contributing to Ethereum's value proposition by making the network more accessible and cost-effective for users. While some initially worried that Layer 2 solutions might reduce demand for mainnet ETH, the opposite has proven true. These scaling solutions are enabling new use cases and bringing more users to the Ethereum ecosystem, ultimately increasing overall network value and ETH demand.
Institutional Adoption Accelerating
The whale accumulation we're observing is likely driven, at least in part, by increasing institutional adoption of Ethereum. Major corporations, investment funds, and financial institutions are recognizing Ethereum's potential as both a store of value and a platform for innovation. This institutional interest is providing a stable foundation of demand that supports higher price levels.
Recent regulatory clarity in various jurisdictions has made it easier for institutions to hold and trade Ethereum. The approval of Ethereum ETFs in multiple markets has provided traditional investors with regulated exposure to ETH, broading the potential investor base significantly. This institutional infrastructure is creating new channels for capital to flow into Ethereum, supporting the whale accumulation trend.
The institutional adoption story extends beyond simple investment holdings. Many institutions are building applications and services on Ethereum, creating operational demand for ETH that goes beyond speculative investment. This utility-driven demand provides a more stable foundation for price appreciation than speculation alone.
Market Sentiment and Risk Factors
While the whale accumulation and associated price targets are generating significant optimism, it's important to consider potential risk factors that could impact Ethereum's trajectory. Macroeconomic conditions continue to influence cryptocurrency markets, and changes in monetary policy or economic outlook could affect investor appetite for risk assets like ETH.
Regulatory developments remain a key consideration for Ethereum's future. While recent regulatory clarity has been generally positive, ongoing discussions about cryptocurrency regulation in major markets could introduce volatility. However, Ethereum's established position and broad ecosystem make it less vulnerable to regulatory challenges than smaller, less established cryptocurrencies.
Competition from other blockchain platforms also represents a consideration, though Ethereum's first-mover advantage and network effects provide substantial competitive moats. The ongoing development of Ethereum 2.0 and associated scaling solutions are addressing many of the performance concerns that competitors have attempted to exploit.
Looking Ahead: October Catalyst Potential
Many analysts are pointing to October as a potential catalyst month for Ethereum's price recovery. This timing aligns with historical patterns showing that the fourth quarter often brings increased cryptocurrency market activity. The combination of whale accumulation, institutional adoption, and seasonal patterns could create a perfect storm for price appreciation.
The prediction of a potential "bear trap" in September, where prices might temporarily decline to the mid-$3,000 range before surging in October, reflects sophisticated market timing strategies. Such scenarios often catch retail traders off-guard while providing additional accumulation opportunities for sophisticated investors who understand market cycles.
Conclusion
The recent whale accumulation of 260,000 ETH represents a significant vote of confidence in Ethereum's future prospects. Combined with capital rotation from Bitcoin, technical breakout potential, and strong fundamental drivers, conditions appear favorable for a substantial price recovery toward the $5,000 target level.
While short-term volatility remains possible, the sustained whale buying suggests that sophisticated investors are positioning for longer-term appreciation. The combination of reduced supply through staking and burning mechanisms, increased institutional adoption, and ongoing ecosystem development creates a compelling investment thesis for Ethereum.
Investors should remain aware of potential risks and market volatility, but the current accumulation pattern by whales provides strong evidence that major market participants expect significant appreciation in Ethereum's value. As the cryptocurrency market continues to mature and institutional adoption accelerates, Ethereum appears well-positioned to benefit from these broader trends, potentially making the $5,000 price target achievable in the coming months.
The convergence of technical, fundamental, and sentiment factors creates an unusually positive outlook for Ethereum. While past performance doesn't guarantee future results, the current whale accumulation pattern mirrors successful accumulation phases that have preceded major rallies in Ethereum's history, suggesting that similar outcomes may be possible in the current market cycle.

ethereum move missed Ethereum is showing signs of exhaustion after a sharp rally to $4,300. This setup highlights a potential retracement zone between $4,150–$3,980, backed by bearish divergence on RSI and weakening volume. If price breaks below the rising trendline, we could see a short-term correction before the next leg up. Watching for confirmation around key support levels. Trade with caution—volatility is high."
🔍 Tips to make it pop on TradingView:
- Include bias (bullish/bearish/neutral)
- Mention entry, exit, and invalidation zones
- Use at least two confluences (e.g., RSI + trendline)
- Keep it clear, concise, and jargon-free
Ethereum vs Solana: Which One Will Explode First?!In this episode, we’ll compare Ethereum (ETH) and Solana (SOL) head-to-head:
👉 Trend strength
👉 Volatility & cycles
👉 Candles & momentum
👉 Dominance vs Bitcoin
Both ETH & SOL are in an uptrend on the daily chart — but which one is better for trading and long-term investment? In this analysis, I’ll break it all down using the simplest technical tools so everyone can follow.
We’ll check:
Daily & 4H momentum comparison
Sharpe ratio for investment reliability
Which altcoin has stronger liquidity inflows
Key resistance & long triggers for ETH and SOL
❌ Don’t FOMO.
Stick to risk management.
Trade your trigger, not your emotions.

ETH 1H Analysis - Key Triggers Ahead | Day 10💀 Hey , how's it going ? Come over here — Satoshi got something for you !
⏰ We’re analyzing ETH on the 1-hour timeframe timeframe .
🔭 On the 1-hour timeframe for Ethereum, we can see that in the last few candles ETH faced a drop with some selling pressure, reaching the support zone at $4276, and then bouncing back. Now we need to see whether Ethereum manages to break the $4400 resistance or not. If it does, this level could give us a strong long position opportunity.
⛏ Two key RSI zones are being watched: 58 and 37. Once the RSI swings beyond these levels, ETH could start a solid move.
💰 Volume and green candles could continue to increase, and even while I’m writing this, a strong whale green candle with very good volume just closed for Ethereum.
🪙 On the 1-hour timeframe of ETHBTC, if the drawn support zone is lost, ETH might struggle to move upward, since Bitcoin dominance is closing green candles and this adds selling pressure on Ethereum. However, a long alarm zone has been set — and if ETH breaks above this zone, it could pump massively.
🔔 Two alarm zones are considered for Ethereum: $4400 and $4276. Personally, I’m not really thinking about short positions today, and if ETH gives a good setup, I’d rather look for a long entry.
❤️ Disclaimer : This analysis is purely based on my personal opinion and I only trade if the stated triggers are activated .
ETHUSDT SITTING AT STRONG SUPPORT + TRIANGLEThis has to be the absolute medium term support for ETH. Breaking of this support will lead to further downside, And if the Triangle is broken on the upside- expect a good rally in ETHUSDT.
We Bring you the most no-bs true to foundation old school real analysis to you everyday!
Genuine Questions and Comments are always welcomed :)

ETH 1H Analysis – Key Triggers Ahead | Day 9💀 Hey , how's it going ? Come over here — Satoshi got something for you !
⏰ We’re analyzing ETH on the 1-hour timeframe timeframe .
🔭 On the 1-hour timeframe of Ethereum, we can see that after being rejected from the \$4500 alert zone, Ethereum moved downward and formed short-term support at the \$4371 area. If this level is broken, Ethereum could experience a deeper correction in the multi-timeframe view.
⛏ The key RSI levels are at 58 and 39. Once the oscillator crosses these levels, Ethereum can start its move.
💰 The size and number of Ethereum’s red candles are significantly greater than the green ones, and if this support is lost, Ethereum could move further downward into selling pressure.
🪙 On the 1-hour ETHBTC timeframe, we can see that after activating the short alert zone and receiving confirmation for a sell trade, Ethereum is moving downward. It has support at the 0.03996 level, which coincides with the 30 RSI zone or the OverSell boundary.
🔔 The alert zones considered for Ethereum are the \$4371 area and the \$4500 area. Based on price action in these zones, we can find the best trade opportunities. With further decline of ETH against Bitcoin, reduced volatility, and price leaning toward selling, we may see a deeper correction.
❤️ Disclaimer : This analysis is purely based on my personal opinion and I only trade if the stated triggers are activated .

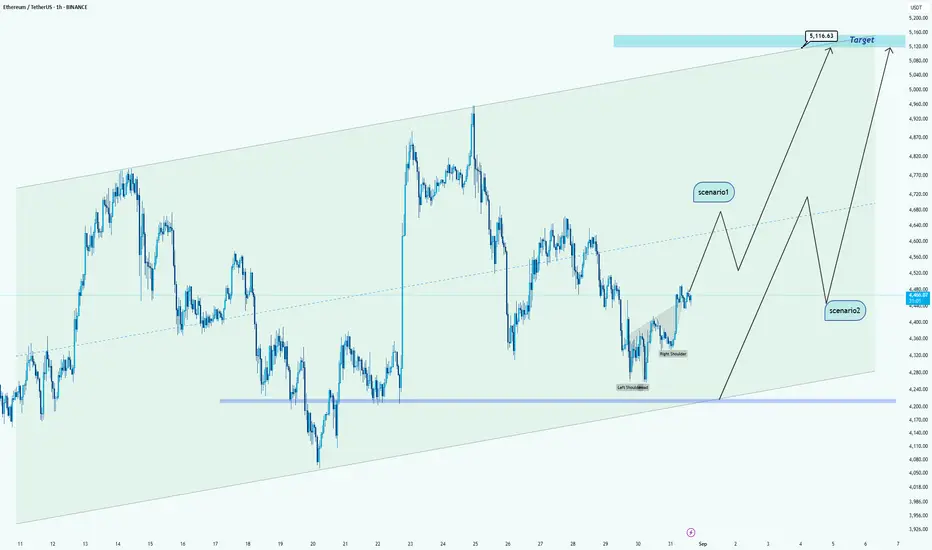
ETH/USDT Analysis -> towards upper levelsHello guys!
Currently, Ethereum is trading inside a clear ascending channel and has just formed a potential inverse head & shoulders pattern near the channel’s support. This setup gives us two possible scenarios:
🔹 Scenario 1:
If ETH continues its bullish momentum and breaks above the mid-line of the channel, we could see a strong push toward $5,116, which is also aligned with the channel’s upper boundary.
🔹 Scenario 2:
If ETH fails to hold above the current levels, we may first see a retracement back toward the $4,200 – $4,250 support zone (channel bottom). From there, the price can gather momentum and still aim for the $5,116 target in the bigger picture.
Conclusion:
Both scenarios point toward a bullish bias in the mid-term. The difference lies in whether we get a direct rally (Scenario 1) or a deeper correction before continuation (Scenario 2).
SIGN/USDT – Critical Accumulation Zone Before the Next Big Move!📊 Detailed Analysis of SIGN/USDT
Currently, SIGN/USDT is moving within a prolonged consolidation phase, with the key demand zone at 0.06700 – 0.07000 USDT (highlighted in yellow). This zone has acted as a strong base since mid-June, repeatedly rejecting downside pressure, and can be considered a major accumulation area.
---
🔎 Market Structure & Pattern
1. Sideways Accumulation
The price is forming a sideways base within the range of 0.067 – 0.078 USDT. Such structures often precede a significant move, either a breakout to the upside or a breakdown lower.
2. Strong Support Zone
Primary Support: 0.06700 – 0.07000 USDT
Next Supports: 0.06300 – 0.05950 USDT, if breakdown occurs.
3. Layered Resistance (Supply Zones)
R1: 0.07382 – 0.07814 USDT
R2: 0.08532 – 0.08938 USDT
R3: 0.09576 – 0.10137 USDT
This structure signals that the price is currently at a decision point, awaiting confirmation of the next big move.
---
✅ Bullish Scenario
As long as price holds above 0.06700, this zone can serve as a strong rebound point.
A breakout above 0.07382 – 0.07814 will open the way toward 0.08532 – 0.08938.
Further bullish momentum above 0.09576 may push the price to 0.10137 USDT, which is the major resistance zone.
If sustained, this could evolve into an Ascending Accumulation Pattern, strengthening the bullish outlook.
---
❌ Bearish Scenario
If the price breaks below 0.06700, a drop toward 0.06300 – 0.05950 becomes highly likely.
A confirmed daily close below this support would shift the structure into a downtrend continuation, possibly extending losses toward 0.05650.
This scenario would reinforce bearish momentum and invalidate the current accumulation zone.
---
🎯 Key Takeaway
0.06700 – 0.07000 USDT is the make-or-break zone.
Holding above it keeps the bullish rebound potential alive, while a breakdown will accelerate the bearish trend.
For traders, this level can act as a strategic entry point with strict risk management, as the market is preparing for its next decisive move.
#SIGNUSDT #CryptoAnalysis #PriceAction #SupportResistance #CryptoTrading #Altcoins #ChartAnalysis #BullishScenario #BearishScenario

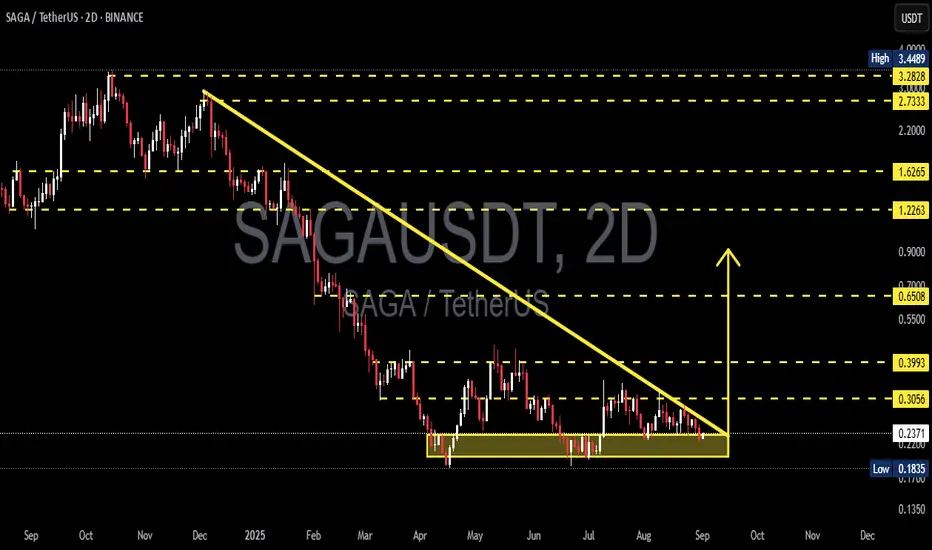
SAGAUSDT — Descending Triangle: Preparing for a Major Move?📌 Market Context
On the 2D timeframe, SAGA/USDT has been in a prolonged downtrend since late 2024 into early 2025. Recently, price action has formed a descending triangle: consistent lower highs pressing down against a flat demand zone at 0.22–0.24.
This structure reflects seller dominance (lower highs) while buyers continue to defend the same support. As price compresses into the apex of the triangle, volatility shrinks — signaling that a major move is imminent, either bullish breakout or bearish breakdown.
---
📊 Technical Structure & Key Levels
Key Demand Zone: 0.22 – 0.24 (highlighted in yellow)
Next Supports: 0.1835 (previous low), extension toward ~0.135 if breakdown accelerates
Stepwise Resistances:
0.3056 → first bullish validation
0.3993 → strong horizontal resistance
0.6508 → measured move confluence from triangle height
1.2263 → higher timeframe resistance
1.6265 → major resistance zone
2.7333 & 3.2828 → ambitious targets if macro bullish cycle resumes
Downtrend Line: descending resistance from multi-month highs, currently near 0.26–0.28
---
🟢 Bullish Scenario
Trigger:
Breakout above the downtrend line and a 2D close above 0.3056
Confirmation:
Increased volume + successful retest turning 0.27–0.305 into support
Targets:
T1: 0.3993
T2: 0.6508 (measured move projection)
T3: 1.2263 if momentum extends further
Alternative setup:
A fake breakdown below 0.22 followed by a quick reclaim above 0.23–0.24 could trigger a bear trap and squeeze price towards 0.3056/0.3993
Invalidation:
Failure above 0.3056 with price falling back under 0.26
---
🔴 Bearish Scenario
Trigger:
A decisive 2D close below 0.22 (triangle floor breakdown)
Confirmation:
Retest into 0.22–0.24 fails, flipping the zone into supply
Targets:
T1: 0.1835 (prior low)
T2: ~0.135 if sellers maintain pressure
Invalidation:
Price reclaims 0.24–0.26 with sustained strength
---
⚖️ Conclusion
The descending triangle on SAGAUSDT is now nearing completion, with price action coiling tightly around the 0.22–0.24 demand zone. Historically, this pattern favors continuation to the downside, but a bullish reversal remains possible if buyers reclaim control with a breakout above 0.3056.
In setups like this, traders often prepare for both scenarios instead of guessing direction:
React to the confirmed breakout or breakdown
Define clear invalidation levels for strict risk management
The market is reaching its decision point — the next move could be explosive.
#SAGA #SAGAUSDT #CryptoAnalysis #DescendingTriangle #PriceAction #ChartPattern #Breakout #Breakdown #CryptoTrading #SupportResistance #RiskManagement
1:2 RR SELL Trade on Ethereum NOW📉 Ethereum (ETH/USD) – 1:2 RR Sell Trade Setup
You're executing a sharp short trade on Ethereum with a clean 1:2 risk-to-reward ratio. Here's a crisp TradingView idea description:
🔻 Trade Snapshot
- Bias: Bearish momentum
- Entry: Near recent resistance or breakdown level
- Stop Loss: Above key structure or wick rejection
- Target: 2x the risk, aligned with next support zone or Fibonacci level
- Confirmation: Bearish engulfing, RSI divergence, or MACD crossover
💬 "ETH showing signs of exhaustion—perfect setup for a disciplined 1:2 RR short. Tight stop, clear target, and momentum on our side."

AVALANCHE - GOOD ENTRY FOR LONG SWING TRADE, 100%+AVALANCHE (AVAX) - Layer 1 blockchain, that functions as a platform for decentralized applications and custom blockchain networks. It is one of Ethereum’s rivals, aiming to unseat Ethereum as the most popular blockchain for smart contracts. It aims to do so by having a higher transaction output of up to 6,500 transactions per second while not compromising scalability.
Looking for an entry around $25 and exit around $50 on spot for a nice 2x. Its possible for price to move a bit lower in the short term depending on overall crypto market, however this is a good swing trade and any lower entry would be a better entry. You can wait for bullish volume and a catalyst if you feel its risky, or overall crypto/altcoin sentiment to increase.

Bitcoin Dominance at Channel Resistance –Will Altcoins Take Off?BTC Dominance has been moving inside a clear descending channel, and right now, price is testing the upper boundary (channel resistance).
Here’s what the price action is telling us:
🔸 If dominance rejects this level and fails to break out, we could see a pullback toward the lower channel, which usually signals money rotating into altcoins → potential altseason setup.
🔸 But if BTC.D manages to break and close above the channel, it may confirm a shift in capital back into Bitcoin, putting pressure on altcoins.
📍 This zone is a make-or-break level, and the reaction here could dictate the short-term market structure for the entire crypto market.

ETH Market Update📊 ETH Market Update
ETH has formed a trading pattern and is now testing the blue support zone 🔵
👉 This is a critical level — a breakout is coming soon, but the question is: up or down?
⚠️ If CRYPTOCAP:ETH breaks below the blue support, sellers could take control and push price lower.
⚡ If CRYPTOCAP:ETH holds support and buyers step in, we could see a bounce and bullish continuation.
👉 Key takeaway: Wait for clear confirmation before entering — the next breakout will define the trend direction.
