Ethereum Analysis (2H)In the lower timeframes, after the major dump forming wave A, it seems that wave B has developed as a diametric pattern, with one remaining leg wave g. Wave g is bullish and could target the levels marked on the chart:
targets : 3920$ - 4038$ _ 4142$
The green zone represents the entry area, which is likely to be retested.
For risk management, please don't forget stop loss and capital management
When we reach the first target, save some profit and then change the stop to entry
Comment if you have any questions
Thank You
Ethereum (Cryptocurrency)

CORRECTION ON ETHmy take on ETH H1,
possibly a complex correction before turning down to minuette c as impulse. wil monitor tomorrow

EthereumEthereum's price was rejected at support at 3700, now in an uptrend heading towards the 0.5 Fibonacci level, favoring continuation of the long movement to the resistance at 4100.

My November and December expectations.According to my possible wave counts the first week of November may be a sell-off, then the direction may be upwards, and declines may occur after the Christmas holiday.
* The purpose of my graphic drawings is purely educational.
* What i write here is not an investment advice. Please do your own research before investing in any asset.
* Never take my personal opinions as investment advice, you may lose your money.

ETHUSD Neutral bias remains intact above 3,723The ETHUSD remains in a neutral trend, with recent price action indicating a corrective pullback within the broader trading range.
Support Zone: 3,723 – a key level from previous consolidation. Price is currently testing or approaching this level.
A bullish rebound from 3,723 would confirm ongoing upside momentum, with potential targets at:
4,020 – initial resistance
4,118 – psychological and structural level
4,210 – extended resistance on the longer-term chart
Bearish Scenario:
A confirmed break and daily close below 3,723 would weaken the bullish outlook and suggest deeper downside risk toward:
3,620 – minor support
3,520 – stronger support and potential demand zone
Outlook:
Neutral bias remains intact while the ETHUSD holds above 3,723. A sustained break below this level could shift momentum to the downside in the short term.
This communication is for informational purposes only and should not be viewed as any form of recommendation as to a particular course of action or as investment advice. It is not intended as an offer or solicitation for the purchase or sale of any financial instrument or as an official confirmation of any transaction. Opinions, estimates and assumptions expressed herein are made as of the date of this communication and are subject to change without notice. This communication has been prepared based upon information, including market prices, data and other information, believed to be reliable; however, Trade Nation does not warrant its completeness or accuracy. All market prices and market data contained in or attached to this communication are indicative and subject to change without notice.

BTC/USDT | Bitcoin Bounces Back — Bulls Eyeing $112K Next!By analyzing the #BTC chart on the 12-hour timeframe, we can see that after a healthy correction down to $106,350, Bitcoin has regained its footing and is once again trading near the $110,000 zone. This recovery shows that buyers are still stepping in aggressively to defend key supports and maintain bullish momentum.
As long as BTC stays above $108,600, the bullish outlook remains valid. The next upside target sits around $112,000, where we might see some short-term reaction before another potential correction — likely a setup before the next major bullish wave.

ETH Outlook after the Dip. What to expect NOW?Finally, the price broke the wedge, and the price experienced a significant drop. I think now is the time for ETH to rise again to 1900 . STRONG SUPPORT 1400 .
Give me some energy !!
✨We spend hours finding potential opportunities and writing useful ideas, we would be happy if you support us.
Best regards CobraVanguard.💚
_ _ _ _ __ _ _ _ _ _ _ _ _ _ _ _ _ _ _ _ _ _ _ _ _ _ _ _ _ _ _ _
✅Thank you, and for more ideas, hit ❤️Like❤️ and 🌟Follow🌟!
⚠️Things can change...
The markets are always changing and even with all these signals, the market changes tend to be strong and fast!!

ETH/USDT | Ethereum Rebounds Strongly – Eyes on $5K Next!By analyzing the #Ethereum chart on the weekly timeframe, we can see that after our previous analysis, price continued to rise and reached as high as $4,200. It is currently trading around $3,800, and if it can hold above this level, we could expect further upside movement.
The next potential bullish targets are $4,300, $4,500, $5,000, and $5,500.
Please support me with your likes and comments to motivate me to share more analysis with you and share your opinion about the possible trend of this chart with me !
Best Regards , Arman Shaban

"ETH - Time to buy again!" (Update)The ETH will increase $2K and reach to the top of the wedge in the coming weeks .
Best regards CobraVanguard.💚

Can Short-Term Holders Rescue Ethereum From a Drop to $3,500?At the time of writing, Ethereum is trading at $3,846, holding just above the $3,802 support level. The altcoin king is likely to remain rangebound as market conditions show limited volatility.
Ethereum’s price currently fluctuates between $4,154 and $3,802. This consolidation range could persist in the coming sessions, with ETH possibly retesting resistance if short-term momentum returns.
However, if bearish conditions intensify and Ethereum loses the $3,802 support, a further drop could follow. A breakdown below this level may send the price under $3,742 and toward $3,500, invalidating the bullish thesis and signaling deeper market weakness ahead.

Ethereum 3rd Cycle Inevitable ⚡️
Same structure.
Same rhythm.
Different cycles
Same silence before the storm.
Every CRYPTOCAP:ETH cycle begins the same way, accumulation, disbelief, and then an unstoppable breakout.
The 3rd cycle isn’t a question of if, it’s a matter of when.

Bullish reversal off major support?The Ethereum (ETH/USD) is reacting off the pivot and could bounce to the 1st resistance.
Pivot: 3,710/52
1st Support: 3,395.28
1st Resistance: 4,063.46
Disclaimer:
The above opinions given constitute general market commentary, and do not constitute the opinion or advice of IC Markets or any form of personal or investment advice.
Any opinions, news, research, analyses, prices, other information, or links to third-party sites contained on this website are provided on an "as-is" basis, are intended only to be informative, is not an advice nor a recommendation, nor research, or a record of our trading prices, or an offer of, or solicitation for a transaction in any financial instrument and thus should not be treated as such. The information provided does not involve any specific investment objectives, financial situation and needs of any specific person who may receive it. Please be aware, that past performance is not a reliable indicator of future performance and/or results. Past Performance or Forward-looking scenarios based upon the reasonable beliefs of the third-party provider are not a guarantee of future performance. Actual results may differ materially from those anticipated in forward-looking or past performance statements. IC Markets makes no representation or warranty and assumes no liability as to the accuracy or completeness of the information provided, nor any loss arising from any investment based on a recommendation, forecast or any information supplied by any third-party.

Ethereum Game Plan - TDLRKZ MODELEthereum Game Plan - TDLRKZ MODEL
📊 Market Sentiment
On 29/10, the FED lowered rates by 25BPS, as expected. However, Powell’s comments introduced uncertainty regarding another cut in December, stating that further policy moves depend on incoming data.
Interestingly, one FED member dissented, preferring no cut this cycle — a shift from September when all members supported easing.
Following the statement, rate-cut expectations dropped from 95% to 68%, prompting traders to take profits and hedge, creating a short-term bearish sentiment across markets.
Despite this, the mid-to-long term outlook remains bullish, given the broader liquidity cycle and easing policy bias.
📈 Technical Analysis
Ethereum is currently accumulating inside a well-defined range.
Price failed to sustain above the $4950 range high and has started retracing toward the HTF bullish trendline, a potential reaction zone aligning with prior liquidity pools and confluences.
If price holds around this zone, ETH could seek the range high again once momentum returns.
📘 Model in Use – Trendline Deviation with HTF LR into Key Zone (TDLRKZ Model)
This model identifies setups where price deviates from HTF trendlines while interacting with liquidity zones and key structural levels.
The goal is to align HTF context with LTF confirmation for high-probability trend continuation setups.
Model Steps:
1️⃣ Identify the HTF trend direction and only trade in that direction.
2️⃣ Mark the HTF bullish trendline supporting price.
3️⃣ Spot HTF Key Zones likely to act as reaction areas.
4️⃣ Locate nearby liquidity pools or order concentrations.
5️⃣ Wait for confluence: when all align, confirm with a 4H market structure break for entry.
📌 Game Plan
Looking for ETH to retrace into $3350 and reject from that level.
If a 4H break of structure occurs and daily candle closes above $3350, this will trigger a long-biased setup.
🎯 Setup Trigger
→ 4H structure break after tagging $3350
→ Daily close above $3350
📋 Trade Management
→ Entry: After confirmation above $3350
→ Stop Loss: Below swing low that caused 4H break of structure
→ Targets:
TP1: $4150 (EQ)
TP2: $4550
TP3: $4950 (Range high)
→ Move SL to breakeven after TP1 is reached.
💬 Check my Substack for deeper macro and sentimental breakdowns — free subscriptions are open.
⚠️ Disclaimer: This content is for educational purposes only and does not constitute financial advice. Always DYOR before trading.

ETH/USD – Bulls Ready for the Next Leg Up?Ethereum is showing a clean retrace into the rising trendline and POC/ VWAP zone — classic setup for a continuation move.
As long as price holds above $3,950, bulls remain in control with targets at $4,733 and beyond.
Momentum is cooling but structure stays bullish. Is this just the calm before the next breakout? 👀
💬 What’s your plan here — riding the trend or waiting for confirmation?

EthereumETHUSD
- Bearish Channel as an corrective pattern in Short Time Frame
- Sell Side Liquidity
- Change of Characteristics
- Completed " 1234 " Impulsive Waves
- Order Block

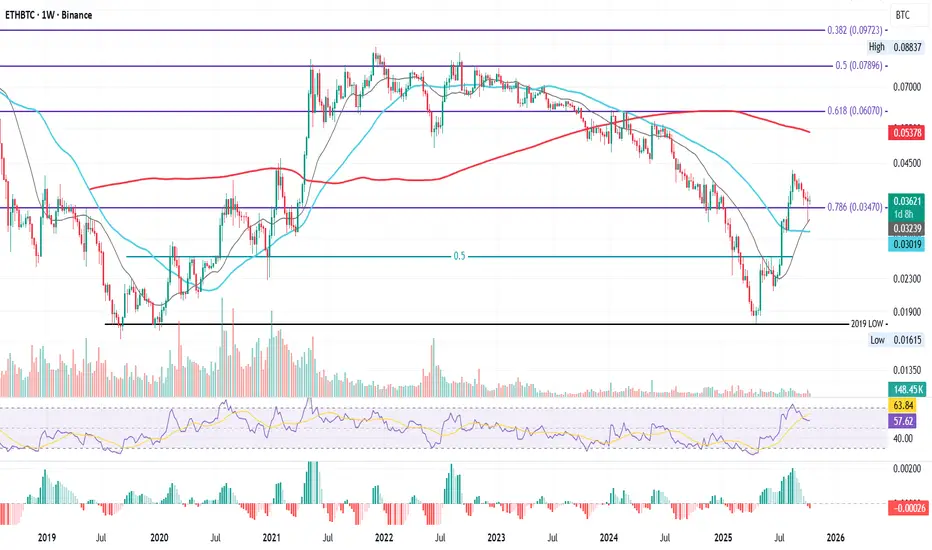
ETHBTC Weekly Series – Tracking the Shift, Week by WeekETHBTC Weekly – Confluence at the 0.786 Fib
This is ETHBTC on the weekly, now retesting one of the most important Fibonacci levels on the chart: the 0.786 Fib at 0.03470.
This time, price isn’t testing it alone. Just below, we have the 21-week MA and 50-week MA, both providing strong confluence. Last week’s flash crash on October 10th already tagged the 21-week MA, showing how reactive this area is for buyers.
This zone could serve as a structural base for a potential bounce toward higher resistance: such as the 200-week MA, or Fibonacci levels around 0.06–0.07. But for any of that to happen, price must hold here first.
That’s why, starting this week, I’ll be tracking this pair closely and updating this idea regularly, to better understand whether ETH can regain strength against BTC, and what that means for the altcoin market as a whole.
Because as history has shown:
when ETHBTC climbs, altcoins breathe again.
Right now, most alts look bruised after the flash crash, but some, especially those with real-world use cases, still hold long-term promise.
The key is timing.
And timing starts with ETHBTC holding this level.
Bias:
Neutral–bullish, strong confluence support, but confirmation needed through weekly close above 0.0347.
Always take profits and manage risk.
Interaction is welcome.
ATH/USDT – at Golden Zone: Massive Rebound or Deep Breakdown?ATH has once again returned to the golden demand zone between 0.0275–0.025, a historically critical area that has triggered multiple price reversals in the past.
This is not just another support level — it’s the last stronghold of buyers on the daily timeframe.
Each time price revisited this region, we saw strong reactions, suggesting institutional accumulation and heavy buying pressure. However, this time the bearish momentum remains dominant, and sellers are still in control on the higher structure.
Interestingly, there’s a long lower wick indicating a liquidity sweep — meaning stop losses were taken below the zone before price quickly recovered. This often signals the beginning of a potential reversal phase.
---
Technical Structure & Key Observations
Overall trend: Still bearish (series of lower highs and lower lows).
Critical zone: 0.0275–0.025 (highlighted yellow box) — major demand area.
Candle structure: Multiple long lower wicks suggesting demand absorption.
Current formation: Sideways consolidation between 0.025–0.031 — breakout on either side will define the next major move.
Key levels to watch:
Immediate resistance: 0.031 – 0.033
Mid resistance: 0.0355 – 0.041
Strong resistance: 0.051 – 0.0645
Next support: 0.0223
---
Bullish Scenario – “Rebound From the Abyss”
A bullish setup will form if price successfully holds above 0.0275–0.025 and prints a strong bullish engulfing candle on the daily close.
That would confirm renewed buyer strength within the major demand area.
🎯 Upside targets:
Target 1: 0.031 (minor breakout confirmation)
Target 2: 0.0355
Target 3: 0.041 — potential trend reversal zone
📉 Invalidation: Daily close below 0.025.
👉 Note: If volume rises along with a solid green candle above 0.031, expect a swift move toward 0.041.
---
Bearish Scenario – “Breakdown Into the Abyss”
If buyers fail to defend the golden zone, a confirmed daily close below 0.025 with strong volume would signal a continuation of the downtrend.
This could trigger another wave of distribution and deeper correction.
🎯 Downside targets:
Target 1: 0.0223 (major local low)
Target 2: Below 0.020 — potential capitulation zone
📈 Invalidation: Strong rebound and daily close back above 0.031.
---
Technical Conclusion
ATH is standing at a make-or-break level that will define its next trend direction.
If the golden demand zone holds, we could see a powerful technical rebound and possible short squeeze.
But if this level gives way, expect a deeper move toward the 0.022 range.
This is the “do or die” moment for ATH bulls.
---
#ATH #ATHUSDT #CryptoAnalysis #TechnicalAnalysis #PriceAction #SupportZone #BreakoutOrBreakdown #CryptoTrading #SmartMoney #LiquiditySweep #SwingTrading

Ethereum Daily OutlookCOINBASE:ETHUSD Price is currently trading above the key structural line while respecting the latest bullish FVG. After the recent rejection 🧠 from the distribution zone, ETH shows early signs of accumulation within the grey mitigation block.
As long as price holds above
3,850–3,880, the bias remains long, targeting the upper FVG zones near 4,200–4,400.
A clean break below that block, however, could open the road toward the lower liquidity pool around 3,500–3,600, where a deeper accumulation phase might form.
The volume profile shows declining sell pressure signaling potential bullish reaccumulation before the next leg up.
📊 Key Zones:
• Accumulation: 3,850–3,880
• Distribution: 4,200–4,400
• FVG Targets: 4,250 / 4,450
• Invalidation: Below 3,800

ETHUSD H1 | Bearish Momentum Building UpBased on the H1 chart analysis, we can see that the price has rejected off the sell entry at 3,987.68, which is a pullback resistance that aligns with the 38,2% Fibonacci retracement and could drop from this levle to the downside.
Stop loss is at 4,144.26, whichis a pullback resistance that is slightly below the 78.6% Fibonacci retracement.
Take profit is at 3,744.29, whichis a swing low support.
Stratos Markets Limited (tradu.com ):
CFDs are complex instruments and come with a high risk of losing money rapidly due to leverage. 68% of retail investor accounts lose money when trading CFDs with this provider. You should consider whether you understand how CFDs work and whether you can afford to take the high risk of losing your money.
Stratos Europe Ltd (tradu.com ):
CFDs are complex instruments and come with a high risk of losing money rapidly due to leverage. 70% of retail investor accounts lose money when trading CFDs with this provider. You should consider whether you understand how CFDs work and whether you can afford to take the high risk of losing your money.

ASTER/USDT | ASTER Regains Momentum After Correction!By analyzing the Aster chart on the 2-hour timeframe, we can see that after correcting down to $0.93, the price rebounded strongly and climbed to $1.2220.
It’s now trading around $1.09, and if the price can hold above $1.05, we could expect further upside movement.
The next potential targets are $1.14, $1.17, $1.21, and $1.24 .
Please support me with your likes and comments to motivate me to share more analysis with you and share your opinion about the possible trend of this chart with me !
Best Regards , Arman Shaban

ADA/USDT | ADA Setting Up for 10% to 100% Gains, Don’t Miss ThisBy analyzing the Cardano (ADA) chart on the 3-day timeframe, we can see that price is currently trading around $0.67.
Based on the current structure, I expect ADA to start a strong bullish move after a short period of consolidation.
The expected potential returns are around +10% short-term, +40% mid-term, and over +100% long-term. This analysis will be updated soon!
Please support me with your likes and comments to motivate me to share more analysis with you and share your opinion about the possible trend of this chart with me !
Best Regards , Arman Shaban

Strong Recovery, Key Level Ahead $TRUMPAfter the recent crash, $TRUMP/USDT has made a strong comeback, recovering sharply from the bottom with solid momentum.
On the daily timeframe, the price has successfully broken above the key resistance trendline, showing clear bullish intent. However, it’s now testing a major resistance on the weekly chart.
If the price manages to break and close above this weekly resistance trendline, it could trigger an explosive upside move for TRUMP.
DYOR, NFA
Thanks for reading! Appreciate your support and engagement 🙏

ETH: Range-Bound, But Breakdown Could Get UglyOn the CRYPTOCAP:ETH daily chart, the mid-zone is acting as a clear barrier. The price is currently consolidating within a range, caught between the key support zone and this mid S/R zone.
A breakout above could trigger a strong move higher, while a breakdown here would be a scary scenario for the overall market.
DYOR, NFA
Thanks for reading! Appreciate your support and engagement 🙏
