EthereumEthereum was below 4500 for a few days. After being broken again upwards, we are currently testing the 4500 support. The uptrend may continue and we can expect an all-time high at 5000.
Ethereum (Cryptocurrency)

#ETH: Daily AI Market Breakdown. 2025/16/09A fiery salute to all crypto warriors! 🤖 Your trusty analyst, NeuralTraderingPro, here. It's Tuesday, which means the market is already picking up speed, and we need to be one step ahead. Yesterday exceeded even the most cautious expectations: our bearish scenario was activated. The 4500 USDT level, which we called the bulls' last stand, fell. This isn't a defeat, but a new reality we must adapt to. Let's emotionally dissect what happened and how we should navigate these stormy waters.
Analysis of the Past 24 Hours and Forecast Assessment
My previous forecast was 50/50, with an emphasis on the critical importance of the 4500 USDT level. I warned that breaking it would open the path downwards. The market chose exactly that path. Sellers, bolstered by the overall negative sentiment, managed to push the price down, and we saw our first downside target of 4420 USDT touched. The scenario played out, but it's too early to relax. The price found a temporary bottom, and now we need to understand if this is a breather before another fall or a turning point for a reversal.
Market Sentiment and News 📰
The information landscape remains contradictory, but the scales have tipped slightly towards caution.
👍 PayPal Integration: The positive news of the day! PayPal is integrating Bitcoin and Ethereum for P2P payments. This is a huge step towards mass adoption and a fundamentally strong bullish factor in the long term.
🐂 Analyst Optimism: Despite the correction, well-known analysts like Tom Lee predict a "grand rally" for ETH in the last quarter of the year. Furthermore, forecasts of growth to $5,000 and even $16,000 persist, and the Ethereum Foundation has presented a 10-year network development strategy.
💰 Capital Inflow: Last week, crypto funds attracted a record $3.3 billion, indicating continued interest from large investors. They are using dips to accumulate positions.
📉 Bitcoin Pressure: As noted by ForkLog, capital rotation and a correction in the Bitcoin market are intensifying pressure on the entire market, including Ethereum. BTC remains the main benchmark, and its weakness drags down altcoins.
⚠️ Profit-Taking Threat: Analysts warn that after the recent surge, the ETH market is vulnerable to profit-taking, which is precisely what we are observing. The pressure from last week's ETH unlock is still being felt.
Conclusion: Long-term prospects look brilliant due to integration news and the belief of major players. However, in the short term, the market is under pressure from Bitcoin's correction and profit-taking.
Technical Analysis 📊
🔹 1d Chart (Daily): The picture has turned bearish. The price broke and closed below the fast moving average SMA 20 (blue line), which had previously acted as key support for the uptrend. This is a serious signal of a local sentiment change. Now, the next important target and support is the SMA 50 (orange line) around 4350 USDT. The RSI has fallen below 60, losing bullish momentum. The MACD is preparing for a bearish crossover.
🔹 4h Chart (Four-Hour): Bears dominate here. The price is significantly below both SMA 20 and SMA 50. More importantly, the fast SMA 20 crossed the slow SMA 50 from top to bottom, forming a "Death Cross" pattern – a strong bearish signal. The RSI is in the lower part of the range, confirming sellers' strength.
🔹 30m Chart (Thirty-Minute): After a sharp drop, we see a consolidation phase in a narrow range. The price is trying to bounce but repeatedly hits resistance from the moving averages above. The RSI is in the oversold zone, which could lead to a local bounce (short squeeze), but the overall structure remains downward.
Order Book Analysis (DOM) ⚖️
Current price is ~4461.55 USDT. The order book shows a real battle for current levels:
🟢 Support Walls: Directly below the current price, a powerful bastion is built. A buy order for ~743k USDT at 4461.54 and a whole cascade of large orders in the 4458-4461 range totaling over 2 million USDT. This is enormous limit support. Large players are trying to stop the fall and are accumulating positions right here.
🔴 Resistance Walls: From above, the pressure looks weaker than the support below. There are noticeable blocks around 4462-4464 USDT totaling about 900k USDT, but they don't look as monolithic as the support walls.
Conclusion: The order book shows that "smart money" is actively buying the current dip. This is a strong argument for at least a local bounce. If sellers can "eat through" this wall, the fall could accelerate significantly.
Signs of Structures and Formations 🔎
The main pattern right now is the "Death Cross" on the 4-hour chart. This is a classic technical signal, often foreshadowing further decline or a period of prolonged consolidation. Locally, on lower timeframes, something resembling a "bear flag" is forming – a continuation pattern for a downtrend.
Updated Targets for the WEEK
Upside Targets 🚀 (in case of a successful bounce):
4520 USDT (Local resistance zone).
4600 USDT (Strong psychological and technical level, SMA 20 on 4h).
4680 USDT (Primary resistance, SMA 50 zone on 4h).
Downside Targets 📉 (in case of a break of current support):
4400 USDT (Round number, psychological support).
4350 USDT (Key support — SMA 50 on the daily chart).
4200 USDT (Strong structural support level from late August).
Forecast for the Near Future:
Long (buy): 35% 🐂
Short (sell): 65% 🐻
Justification: The technical picture on higher timeframes (1d, 4h) is unequivocally bearish. The "Death Cross" pattern and the break of the daily SMA 20 are strong arguments for further decline. However, the huge buy wall in the order book and oversold conditions on lower timeframes could trigger a short-term bounce. Globally, the path of least resistance right now is down. The most likely scenario is a false bounce to 4500-4520 followed by a decline.
Trading Ideas
For Buyers (Long):
Idea 1 (Aggressive): Buy from the current order density in the 4450-4460 USDT range, anticipating a short-term bounce. Target: 4520 USDT. Stop-loss: very tight, below 4440 USDT.
Idea 2 (Conservative): Wait for the price to return and confirm above the 4600 USDT zone on the 4h chart. This will be the first serious sign of a broken downtrend. Target: 4680 USDT, then 4800. Stop-loss: below 4550 USDT.
For Sellers (Short):
Idea 1 (Aggressive): Sell on a bounce to the 4500-4520 USDT resistance zone. Target: 4400 USDT, then 4350 USDT. Stop-loss: above 4555 USDT.
Idea 2 (Conservative): Open short positions only after a confident break and confirmation below the 4450 USDT support wall on the 4h chart. Target: 4350 USDT. Stop-loss: above 4490 USDT.
Recommendations for Traders
The market has entered a bearish phase on local timeframes. Trading against the trend (buying) is now associated with increased risk. A safer strategy appears to be shorting from resistance levels. At the same time, gigantic limit buy orders suggest that the fall will not be easy. Be extremely cautious, use stop-losses, and do not succumb to FOMO or panic.
Trade with a cool head, not a hot heart. May your analysis be accurate and your trades profitable! ✨
Did you like the analysis? Give it a thumbs up 👍 and subscribe to always stay on top of the market! 🚀

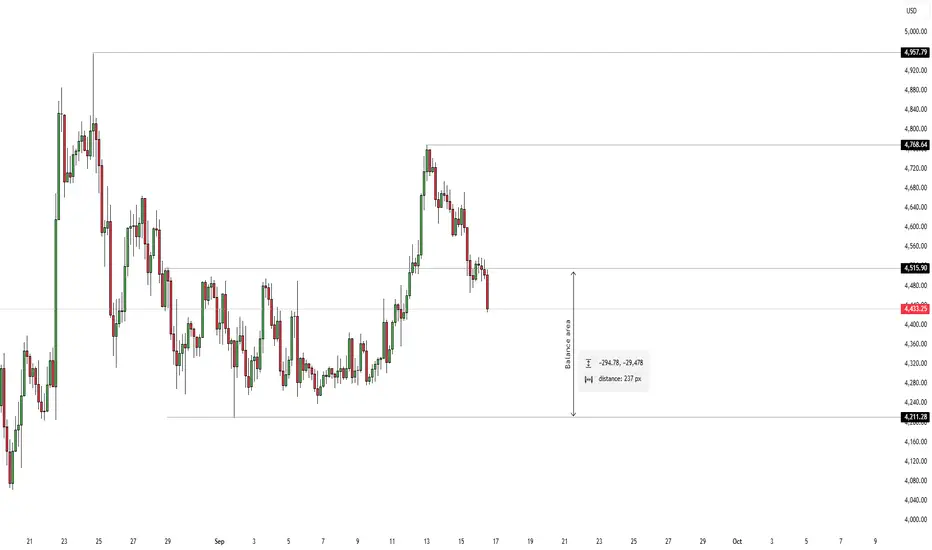
ETHUSD 4H HOURLY PROJECTION AND IDEA.The second in command in the crypto market is Eth, just broke a structure back into a previous Balance Area, which may mean price could be static for sometime and the Pair takes its lead and direction from its Head BTC, which is also on a downward move, but the overall direction of the market is Bullish, and currently price is within a previous range i expect price to stay within this range (Balance) lets see what price would do next.
ETHUSD bullish sideways consolidationThe ETHUSD remains in a bullish trend, with recent price action showing signs of a corrective pullback within the broader uptrend.
Support Zone: 4,100 – a key level from previous consolidation. Price is currently testing or approaching this level.
A bullish rebound from 4,100 would confirm ongoing upside momentum, with potential targets at:
4,450 – initial resistance
4,730 – psychological and structural level
5,070 – extended resistance on the longer-term chart
Bearish Scenario:
A confirmed break and daily close below 4,100 would weaken the bullish outlook and suggest deeper downside risk toward:
3,990 – minor support
3,830 – stronger support and potential demand zone
Outlook:
Bullish bias remains intact while the ETHUSD holds above 4,100. A sustained break below this level could shift momentum to the downside in the short term.
This communication is for informational purposes only and should not be viewed as any form of recommendation as to a particular course of action or as investment advice. It is not intended as an offer or solicitation for the purchase or sale of any financial instrument or as an official confirmation of any transaction. Opinions, estimates and assumptions expressed herein are made as of the date of this communication and are subject to change without notice. This communication has been prepared based upon information, including market prices, data and other information, believed to be reliable; however, Trade Nation does not warrant its completeness or accuracy. All market prices and market data contained in or attached to this communication are indicative and subject to change without notice.

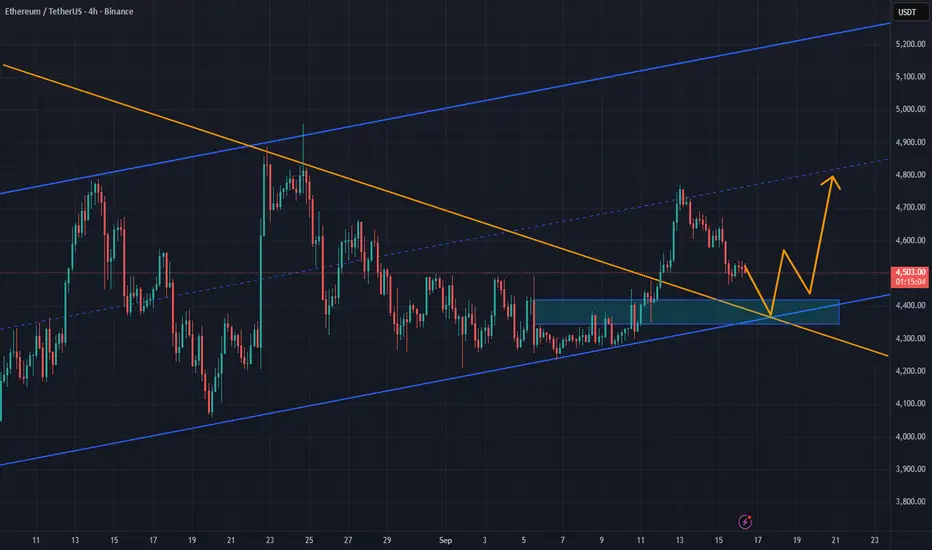
ETH/USDT: Bullish Structure Intact Above Key Support ZoneETH/USDT is trading above the 4,400 support level after rebounding from the upward trendline, showing resilience despite recent pullbacks. The market has broken out of a falling wedge pattern and is forming higher lows, indicating accumulation and potential for further upside.
If buyers defend the 4,390 area, momentum could carry the price toward the 4,750 level, with a possible retest of the broader 5,000 resistance zone. As long as Ethereum stays above trendline support, the bullish outlook remains in play.
Market opens Llower as Ethereum holds steady; Analysts eye $5,00Market opens Llower as Ethereum holds steady; Analysts eye $5,000
The market opened lower on Tuesday, with Ethereum trading around $4,500. While bears are applying pressure ahead of a potential rate cut, ETH remains relatively stable compared to more volatile altcoins.
Recent analysis indicates a significant cooling in Ethereum trading activity. The market has entered a neutral but nervous phase, characterized by a decline in perpetual futures trading—suggesting reduced leveraged speculation and a shift toward more organic spot trading. However, spot market volumes have also failed to impress, consistently staying low and reflecting limited investor participation.
This combination points to a indecisive market. Ethereum has managed to maintain a moderate upward trend but lacks strong bullish momentum, leaving it in a semi-bullish range.
Analysts suggest that a clear break above the key psychological level of $5,000 is crucial to avoid sideways movement and could trigger a rally toward $6,000 by year-end.
In institutional news, Standard Chartered’s venture arm, SC Ventures, is planning to launch a $250 million crypto-focused investment fund in 2026. The fund will target digital assets in financial services and signals growing institutional interest. The bank is also launching a separate $100 million Africa investment fund.

Ethereum $ETH daily demand playing out well. Breakout happenedEthereum CRYPTOCAP:ETH daily demand at $4,336 is playing out well. Breakout happened as expected and mentioned in the last update. Long positions should be managed on this major cruptocurrency.

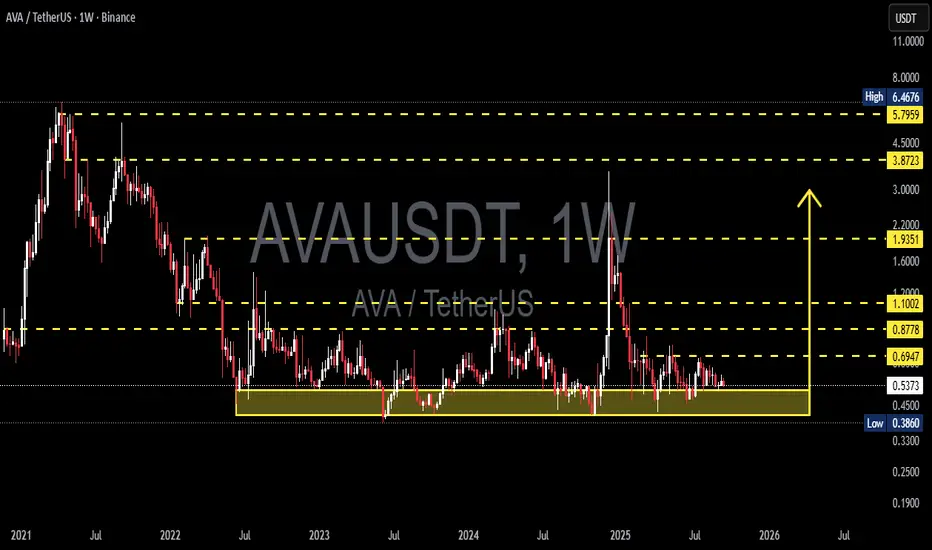
AVA/USDT —Demand Zone: Accumulation or Deeper Breakdown?📌 Overview
The AVA/USDT weekly chart shows a dramatic journey:
From the 2021 peak ($6–7), price has been in a prolonged downtrend followed by sideways consolidation since 2022.
For nearly 3 years, the yellow zone ($0.38 – $0.45) has acted as a battlefield between buyers and sellers.
Each test of this area has resulted in strong rebounds, marking it as a major demand zone.
Now, AVA is once again hovering near this critical support. The big question: Is this the ultimate long-term accumulation zone or the start of a deeper breakdown?
---
🔍 Pattern & Structure Analysis
Macro trend: Bearish since 2021 → long consolidation from 2022–2025.
Dominant pattern: Wide sideways range with a solid base at 0.38–0.45 and tiered resistances at 0.69, 0.87, 1.10, 1.93.
Price character:
Multiple lower wicks into demand zone → sign of liquidity grabs and potential accumulation by bigger players.
Prolonged sideways near lows suggests a possible bottoming formation.
However, compression against support can also lead to a breakdown if bulls lose control.
---
🟢 Bullish Scenario
If buyers defend 0.38–0.45 and push higher:
1. First confirmation: Weekly close above 0.6947.
2. Upside targets:
0.8778 → first mid-term resistance.
1.1002 → psychological & structural breakout zone.
1.9351 → major resistance, early trend reversal confirmation.
3. With strong momentum, a revisit of 3.87 – 5.79 (the 2021 supply zone) remains possible in the next bull cycle.
(Potential gains: +63% to 0.87 / +105% to 1.10 from current price ~0.53).
---
🔴 Bearish Scenario
If a strong weekly close below 0.386 occurs:
1. The 3-year demand zone will fail → showing buyers have lost control.
2. Downside target: 0.25 – 0.19 as the next realistic demand area.
3. Extreme measured-move projection even points to 0.07 (though unlikely, it must be considered).
(Downside risk: −53% to 0.25 from current price).
---
📊 Key Takeaways
$0.38–0.45 = pivotal demand zone for AVA’s next cycle.
Breakout above 0.69 = early bullish signal.
Breakdown below 0.38 = opens risk of new all-time lows.
This zone will decide whether AVA enters a new accumulation phase or faces final capitulation.
---
Critical demand zone = 0.38–0.45.
Watch 0.6947 breakout for bullish bias.
Watch 0.386 breakdown for bearish continuation.
Momentum will reveal if this is smart money accumulation or a last leg down.
---
#AVA #AVAUSDT #CryptoAnalysis #WeeklyChart #Altcoins #TechnicalAnalysis #SupportResistance #CryptoTrading #ChartPatterns
ETHUSD is in correction, but longs are now preferredETH is developing a big triangle, leg A of which is completed.

ETHUSD H4 | Bearish reversal signalEthereum (ETH/USD) has rejected off the sell entry at 4,628.98, whichis a pullback resistance and could reverse from this level to the downside.
Stop loss is at 4,851.84, whichis a swing high resistance.
Take profit is at 4,226.60, whichis a pullback support.
High Risk Investment Warning
Trading Forex/CFDs on margin carries a high level of risk and may not be suitable for all investors. Leverage can work against you.
Stratos Markets Limited (tradu.com ):
CFDs are complex instruments and come with a high risk of losing money rapidly due to leverage. 65% of retail investor accounts lose money when trading CFDs with this provider. You should consider whether you understand how CFDs work and whether you can afford to take the high risk of losing your money.
Stratos Europe Ltd (tradu.com ):
CFDs are complex instruments and come with a high risk of losing money rapidly due to leverage. 66% of retail investor accounts lose money when trading CFDs with this provider. You should consider whether you understand how CFDs work and whether you can afford to take the high risk of losing your money.
Stratos Global LLC (tradu.com ):
Losses can exceed deposits.
Please be advised that the information presented on TradingView is provided to Tradu (‘Company’, ‘we’) by a third-party provider (‘TFA Global Pte Ltd’). Please be reminded that you are solely responsible for the trading decisions on your account. There is a very high degree of risk involved in trading. Any information and/or content is intended entirely for research, educational and informational purposes only and does not constitute investment or consultation advice or investment strategy. The information is not tailored to the investment needs of any specific person and therefore does not involve a consideration of any of the investment objectives, financial situation or needs of any viewer that may receive it. Kindly also note that past performance is not a reliable indicator of future results. Actual results may differ materially from those anticipated in forward-looking or past performance statements. We assume no liability as to the accuracy or completeness of any of the information and/or content provided herein and the Company cannot be held responsible for any omission, mistake nor for any loss or damage including without limitation to any loss of profit which may arise from reliance on any information supplied by TFA Global Pte Ltd.
The speaker(s) is neither an employee, agent nor representative of Tradu and is therefore acting independently. The opinions given are their own, constitute general market commentary, and do not constitute the opinion or advice of Tradu or any form of personal or investment advice. Tradu neither endorses nor guarantees offerings of third-party speakers, nor is Tradu responsible for the content, veracity or opinions of third-party speakers, presenters or participants.

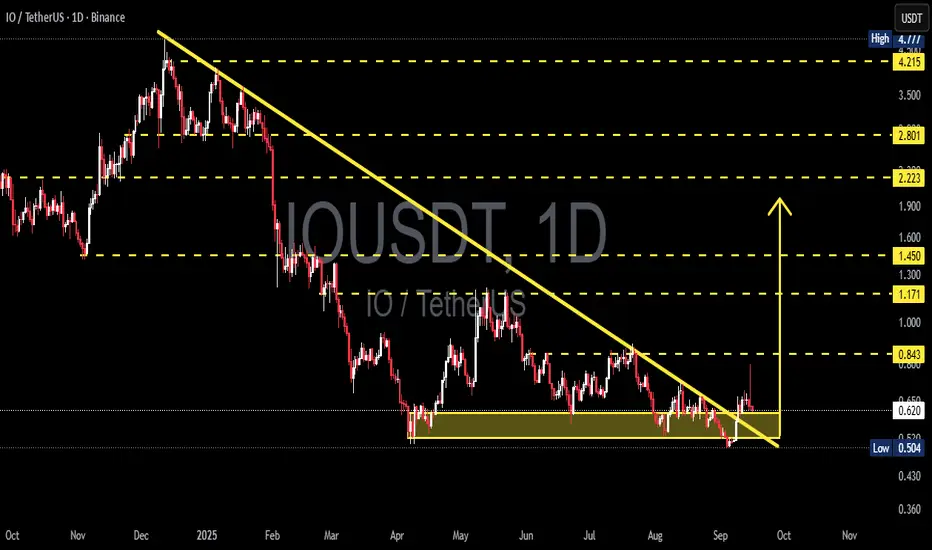
IO/USDT — Accumulation or Major Reversal Incoming?🔎 Current Situation
Timeframe: Daily (1D)
Main Trend: Prolonged downtrend since late 2024 (yellow trendline).
Key Zone: Price is consolidating inside the 0.50 – 0.62 accumulation box, which has acted as strong demand multiple times.
Breakout Attempt: Price briefly broke above the trendline and spiked to 0.84, but quickly rejected → potential bull trap.
---
🧩 Pattern Observations
1. Accumulation Zone (Yellow Box)
Multiple retests confirm this as a critical demand area.
Buyers and sellers are locked in a strong battle here.
2. Descending Triangle / Falling Wedge
Structure resembles a descending triangle (bearish bias if breakdown below 0.50).
Alternatively, it can be read as a falling wedge (bullish if breakout is confirmed).
3. False Breakout (Bull Trap?)
The spike to 0.84 followed by rejection hints at a possible liquidity grab.
Confirmation is needed to validate whether this is a reversal signal or just a trap.
---
🚀 Bullish Scenario
Confirmation Needed:
A daily close above 0.843 with strong volume.
Retest of the downtrend line as new support.
Bullish Targets:
TP1: 1.171
TP2: 1.450
TP3: 2.223
Extended targets: 2.801 – 4.215 if momentum strengthens.
📌 If confirmed, this would signal that 0.50–0.62 was the accumulation bottom before a major reversal.
---
🐻 Bearish Scenario
Confirmation Needed:
A daily close below 0.50 to validate the descending triangle breakdown.
Bearish Targets:
First support: 0.43
Next level: 0.36
📌 Failure to hold the 0.50–0.62 zone could trigger further downside continuation.
---
🎯 Trading Plan
Bullish Traders (Conservative): Wait for a close > 0.843 + retest → enter with staged targets.
Bullish Traders (Aggressive): Start accumulating inside 0.52–0.60 with a tight SL below 0.50.
Bearish Traders: Look for a strong rejection at 0.84 to short → target back to 0.50, or lower if breakdown occurs.
⚖️ Risk Management: This is a decision point. Use strict stop-loss management as this level can either trigger a major reversal or confirm bearish continuation.
---
📌 Notes
Volume is the key factor to separate a valid breakout from a bull trap.
This zone represents a make-or-break point for the medium-term trend.
---
IO/USDT (1D) — Price is consolidating in the 0.50–0.62 accumulation zone, a critical level that could decide the next big move.
Bullish if daily close > 0.843 → targets: 1.171 / 1.450 / 2.223.
Bearish if breakdown < 0.50 → targets: 0.43 / 0.36.
This is a major decision point. Watch for confirmation, beware of bull traps, and always use SL.
---
#IO #IOUSDT #CryptoAnalysis #Altcoin #TechnicalAnalysis #Breakout #SupportResistance #CryptoTrading #BullTrap
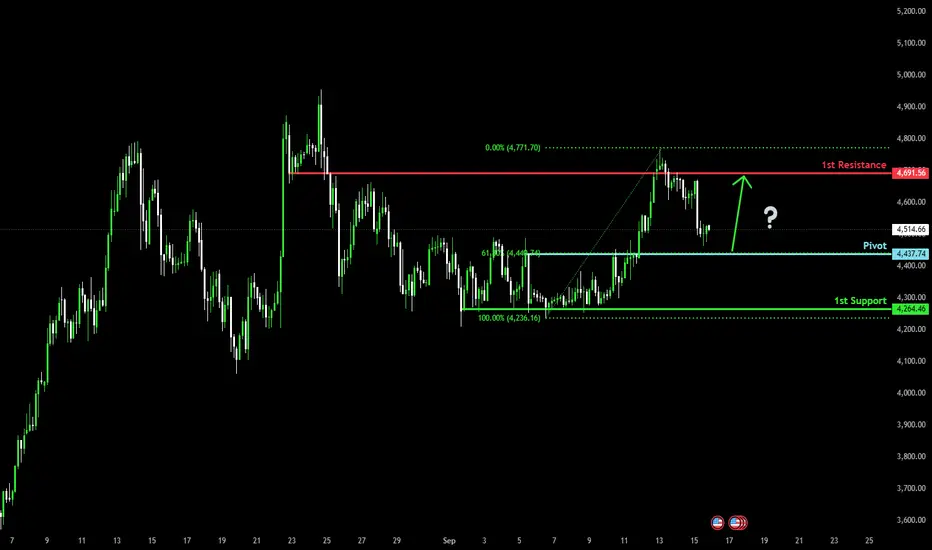
Bullish bounce off 61.8% Fibonacci support?The Ethereum (ETH/USD) is falling towards the pivot, which acts as a pullback support that aligns with the 61.8% Fibonacci retracement and could bounce to the 1st resistance.
Pivot: 4,437.74
1st Support: 4,264.46
1st Resistance: 4,691.56
Disclaimer:
The above opinions given constitute general market commentary, and do not constitute the opinion or advice of IC Markets or any form of personal or investment advice.
Any opinions, news, research, analyses, prices, other information, or links to third-party sites contained on this website are provided on an "as-is" basis, are intended only to be informative, is not an advice nor a recommendation, nor research, or a record of our trading prices, or an offer of, or solicitation for a transaction in any financial instrument and thus should not be treated as such. The information provided does not involve any specific investment objectives, financial situation and needs of any specific person who may receive it. Please be aware, that past performance is not a reliable indicator of future performance and/or results. Past Performance or Forward-looking scenarios based upon the reasonable beliefs of the third-party provider are not a guarantee of future performance. Actual results may differ materially from those anticipated in forward-looking or past performance statements. IC Markets makes no representation or warranty and assumes no liability as to the accuracy or completeness of the information provided, nor any loss arising from any investment based on a recommendation, forecast or any information supplied by any third-party.
Ethereum (ETHUSD) Technical OutlookEthereum remains in a critical yet bullish consolidation phase, trading sideways near all-time highs. This kind of price action often precedes major breakouts, especially with macro tailwinds building — the Fed is expected to cut rates this week, adding liquidity to the market.
🔍 Technical Setup
ETH is currently attempting a breakout from a symmetrical triangle — a bullish continuation pattern in trending markets.
✅ Uptrend confirmed by:
Higher highs
Higher lows
Strong support structure
🎯 Key Levels to Watch
Immediate target zone: $5,700 – $5,800
Macro rally potential: $7,000 – $8,000
Crucial support: $4,000 – $4,200
As long as ETH holds above $4,000, there’s no technical reason to be bearish.

#ETH/USDT Testing Wedge Breakout Amid Key Support#ETH
The price is moving within a descending channel on the 1-hour frame, adhering well to it, and is heading for a strong breakout and retest.
We have a bearish trend on the RSI indicator that is about to be broken and retested, which supports the upward move.
There is a major support area in green at 4480, which represents a strong support point.
For inquiries, please leave a comment.
We are in a consolidation trend above the 100 Moving Average.
Entry price: 4524
First target: 4585
Second target: 4645
Third target: 4715
Don't forget a simple matter: capital management.
When you reach the first target, save some money and then change your stop-loss order to an entry order.
For inquiries, please leave a comment.
Thank you.

ADA/USDT | Cardano Targets $1 – Pump Ahead? Let's See!By analyzing the Cardano (ADA) chart on the 3-day timeframe, we can see that after our last analysis, the price corrected down to $0.78. Then, with renewed demand, it started rising again and has so far reached $0.89.
Based on the price action, if ADA can hold above $0.85, we could see a strong rally or even a pump. The possible bullish targets are $0.93, $1.00, and $1.05.
Please support me with your likes and comments to motivate me to share more analysis with you and share your opinion about the possible trend of this chart with me !
Best Regards , Arman Shaban

ethereum bullishThose who say Ethereum is dead with every drop will witness the demise of bears with every rise.

Long ETHUSDTHello traders!
After a succesful break above resistance, I'm looking for this scalp long.
Don’t forget to like and share your thoughts in the comments! ❤️

Where Is ETH Going This Cycle? (Educational Perspective)
Every cycle brings the same question:
Where is Ethereum heading next? Most look for price guesses, but that’s a distraction. The real advantage comes from knowing what factors will drive ETH’s direction. Understanding the drivers doesn’t require prediction, it requires planning.
A Look Back: ETH in Previous Cycles
Ethereum has repeatedly proven its resilience and innovation leadership:
2016–2017: Breakout fueled by ICO boom—ETH became the token-launch backbone.
2018–2019: Bear market and ICO collapse—but builders persisted.
2020–2021: DeFi and NFT surge—Ethereum powered the blockchain economy as “digital oil.”
2022–2023: Post-Merge era—transition to PoS and reduced issuance amid regulatory uncertainty.
Through every phase, ETH stayed central to crypto’s evolution.
On-Chain Metrics to Watch
Ethereum’s transparency lets us monitor structural strength in real time:
Active addresses gauge real network use.
Staking levels shrink available supply—over 35M ETH (≈30%) staked by mid-2025.
ETH locked in DeFi reflects collateral demand.
Gas fee burn continues to tighten supply post-EIP-1559.
Macro & Narrative Drivers (2024–2025 Upgrades & ETF Momentum)
Stories move markets, and Ethereum has some strong ones now:
Spot ETH ETF Launch: Nearly $500M in institutional inflows since mid-2024.
Staking Supply Constraint: Record ETH locked → tighter supply.
Technical Enhancements: Dencun (2024) and Pectra (2025) improving scalability and validator usability.
Regulatory & Macro Tailwinds: GENIUS Act, institutional adoption, favorable policies.
The Real Question Traders Should Ask
Price targets are clickbait. The real question is:
“Which factors will move ETH this cycle?”
By tracking ETF flows, staking ratios, upgrades, and macro conditions, traders avoid being surprised.

WEEKLY UPDATE ON BTC, ETH, BTC.D - 9/7/2025This weekend's technical analysis is an update from previous week's analysis posted. I am expecting BTC to continue it's price action to the daily 200 EMA after the relief bounce off from the weekly 21 EMA as noted last week. Our BTC analysis will be invalidated if the on the daily chart we get a candle open and close above $114k on good volume and momentum as the weekly and monthly chart is still in a strong uptrend.
ETH pullback is also intact as discussed from last week and approaching the breakout price level of $4000 which coincides with the weekly 9EMA support zone. I will be expecting ETH bulls to battle this level in a consolidation price action before a break down to the weekly 21 EMA target of 3,500.
Bitcoin Dominance did follow through our analysis last week with the inverted hammer play and has now also given some confirmation of a temporal reversal based on indicators. I will be expecting a bounce on Bitcoin Dominance to the resistance level of 59.2% and if there enough momentum to break through the resistance then next target will be 60.64%.
That's a summary of what I will be looking for on these charts as the week unfolds. Thanks for spending time to listen to my analysis and opinion and I wish you the best of trading this week. Cheers !!!

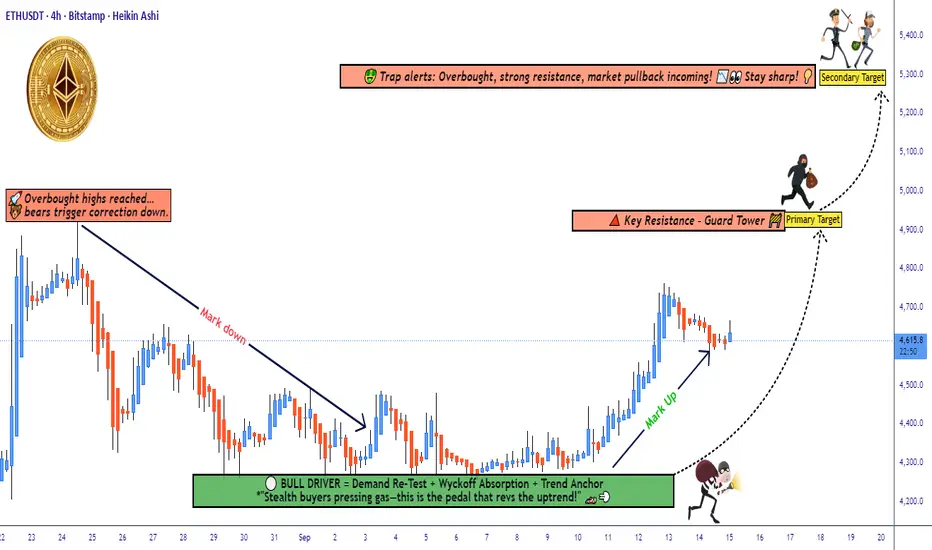
ETH/USDT Technical Outlook: Demand Layer Entries vs Trap Risk🚀 ETH/USDT | Ethereum vs Tether 💎
Crypto Market Money Looting Plan (Swing/Day Trade)
📌 Trade Plan (Bullish Outlook)
Setup: Demand Re-Test ✅ + Wyckoff Absorption 🔑 + Trend Anchor ⚓ (buyers confirmed presence)
Entry Style (Thief Layers 🪙): Using layered limit entries — examples: 4500, 4550, 4600, 4650 (you can add more layers as per your own method).
Stop-Loss (Protect the Vault 🔒): Example zone near 4400 after breakout. Adjust SL to fit your own risk appetite & personal strategy.
Target 🎯:
🎯 Primary: 4900 (local resistance)
🎯 Secondary: 5300 (major resistance / overbought zone)
🧾 Notes for Thief OG’s
This plan is not financial advice, only an idea. Always manage your own entries, SL, and TP.
Think of it as a vault strategy: take money, then protect money.
🔗 Related Pairs to Watch
BINANCE:BTCUSDT → ETH often follows BTC’s momentum. A BTC breakout/false move can affect ETH.
BINANCE:ETHBTC → Good pair to confirm ETH’s relative strength vs BTC.
BINANCE:SOLUSDT & BINANCE:BNBUSDT → Correlated majors; watch for rotation of capital in altcoins.
✨ “If you find value in my analysis, a 👍 and 🚀 boost is much appreciated — it helps me share more setups with the community!”
#ETH #Ethereum #Crypto #USDT #Altcoins #SwingTrade #DayTrading #LayerStrategy #Wyckoff #ThiefPlan #TradingView #CryptoTrading
Ethereum - follow the plan Ethereum - follow the plan
new long after a local range
1st target 4957
full TP - 5393

Volatility Period: Around September 7th (September 6th-10th)
Hello, traders!
Follow us to get the latest information quickly.
Have a great day!
-------------------------------------
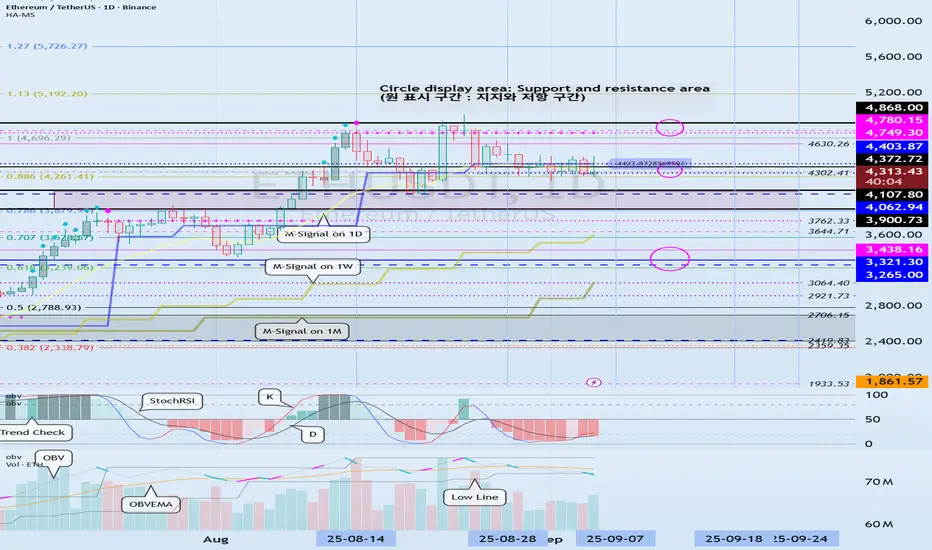
(ETHUSDT 1D Chart)
This volatility period is around September 7th (September 6th-10th).
After this period of volatility, the key question is whether the price can find support and rise above the 4403.87-4749.30 level.
-
To continue the cascading upward trend, the price must rise above 4749.30.
Therefore, we need to monitor whether the price maintains above the 4749.30-4868.0 level.
-
If resistance is encountered at 4403.87 and the price declines, it is likely to decline until it meets the HA-Low indicator.
Therefore, we need to check for support around 4302.41-4403.87.
However, there is a possibility of a rise after touching the previous all-time high (ATH) range of 3900.73-4107.80, so we need to consider a response plan.
If the price falls below 4107.80, it is expected to touch the M-Signal indicator on the 1W chart and resume the trend.
-------------------------------
The On-By-Signal (OBV) indicator is falling below the Low Line.
The TC (Trend Check) indicator is below 0.
The K value of the StochRSI indicator is showing signs of rising from the oversold zone.
If the High Line of the OBV indicator falls and forms a downward channel, it is highly likely that selling pressure will continue to dominate, so caution is advised when trading.
Therefore, the key issue this time is whether support is found around 4302.41-4403.87.
The TC (Trend Check) indicator is a comprehensive evaluation of the StochRSI, On-By-Signal (OBV), and PVT-MACD Oscillator indicators.
Therefore, if the TC indicator is below 0, selling pressure is dominant, and the price is likely to decline.
If the K value of the StochRSI indicator continues to rise, the price is likely to rise after this period of volatility.
However, for the uptrend to continue, the OBV and TC indicators must show upward trends.
-
Thank you for reading to the end.
We wish you successful trading.
--------------------------------------------------
- Here's an explanation of the big picture.
(3-year bull market, 1-year bear market pattern)
I'll explain more in detail when the bear market begins.
------------------------------------------------------
Is Crypto About To Explode: New Highs? The total crypto market cap is retesting $4 trillion.
We are now looking much more bullish on a technical basis across Ethereum & Bitcoin.
We may have had a failed breakdown in the Total Crypto market cap, which could provide the additional liquidity for another surge.
Recapturing Key Daily 7 & 20 MA's is a very positive sign.
Although still being net short BTC & ETH - I now have breakeven stop losses in place.
Ethereum chart is looking very explosive like it could have a move to $5500
ETH recently has defended a massive volume shelf which is a very bullish sign.
Keep on your radar: BMNR / SBET / MSTR / COIN / MARA
