BTC: Hold Here or Drop to 104K?CRYPTOCAP:BTC is currently retesting a crucial zone after facing rejection from the recent resistance area.
This “important zone” around $111K–$110K will likely decide the next move, a strong hold here could trigger a bounce back toward the highs, while a breakdown below it might open the doors toward $108K or even $104K.
In short — this is a key make-or-break level. Keep a close eye on how the daily candle closes here.
DYOR, NFA
#BTCUSDT #unichartz
Ethereum (Cryptocurrency)

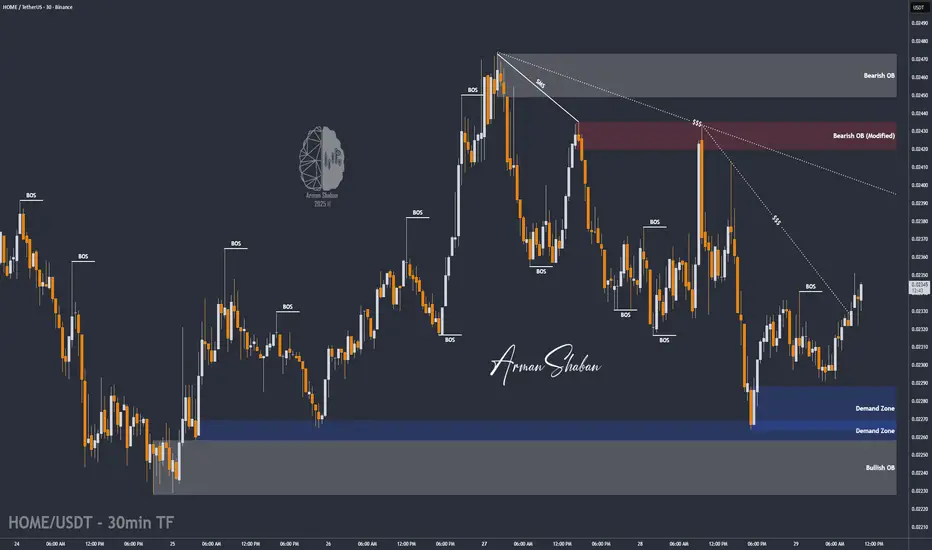
HOME/USDT | $HOME Ready to Pump – Watch $0.0232 Breakout!By analyzing the BME:HOME chart on the 30-minute timeframe, we can see that after a correction down to $0.02265, the price found strong buying interest and is now trading around $0.02338.
If the price manages to hold above $0.02320, we can expect a strong bullish move from this token.
The key demand zone lies between $0.02265–$0.02288, and the next targets for this potential rally are $0.02350, $0.02375, $0.02410, $0.02435, and $0.02450.
Please support me with your likes and comments to motivate me to share more analysis with you and share your opinion about the possible trend of this chart with me !
Best Regards , Arman Shaban
Ethereum is deciding where it wants to live.This is not a trade idea, this is a long term concept, most of my portfolio is swing when bull market comes (monthly/yearly) not trade (daily/weekly).
This is a solid question that will have to be played out in the upcoming years, Ethereum keeps changing its monetary policy and right now has less supply increase than BTC (due to burning mechanisms), will that stay forever? What will happen in the future to the policy? What it will mean for price?
Right now we can clearly see this is a bull case for future months.

We will witness a powerful bullish rally !!After breaking out of the bullish wedge, the price has entered a phase of accumulation. This is a very strong signal on the weekly timeframe and could quickly lead to a price surge. I believe that after Christmas, we will witness a powerful bullish rally.

Ethereum $ETH still has weekly demand in control. Will it rally?Ethereum CRYPTOCAP:ETH still has weekly demand in control. Will it rally higher? Waiting for some more bullish price action or a pullback to the weekly demand lower at $2,600.

#ETH/USDT Buy Opportunity#ETH
The price is moving within an ascending channel on the 1-hour timeframe and is adhering to it well. It is poised to break out strongly and retest the channel.
We have a downtrend line on the RSI indicator that is about to break and retest, which supports the upward move.
There is a key support zone in green at the 3900 price level, representing a strong support point.
We have a trend to stabilize above the 100-period moving average.
Entry price: 4020
First target: 4050
Second target: 4100
Third target: 4179
Don't forget a simple point: capital management.
Upon reaching the first target, save some money and then change your stop-loss order to an entry order.
For any questions, please leave a comment.
Thank you.

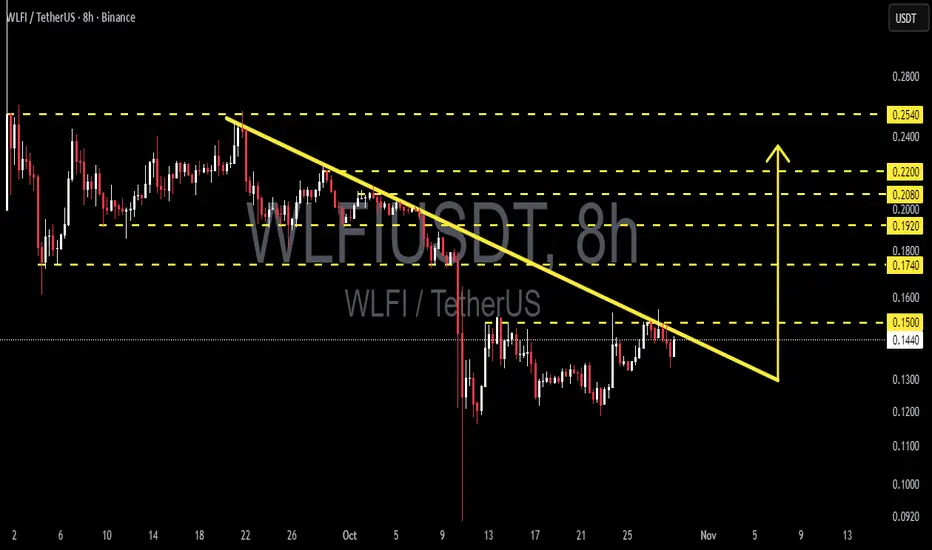
WLFI/USDT — Ready to Explode from Final Consolidation Zone?After weeks of staying under heavy selling pressure within a descending trendline, WLFI is finally showing early signs of life around the 0.13–0.14 demand zone.
The current structure indicates a phase of capitulation followed by silent accumulation, where sellers are losing strength while smart money gradually steps in.
A clear series of lower highs has formed since early October, pressing the price down under a strong descending resistance line (yellow) — and now, price is testing that barrier once again.
A confirmed breakout from this line could mark the beginning of a mid-term trend reversal.
---
Pattern Structure
The chart reveals a descending triangle pattern that’s losing momentum, combined with a potential double-bottom formation near 0.13.
If WLFI manages to break and close above the yellow trendline with solid 8H candle confirmation, the market could shift decisively to bullish territory.
---
Bullish Scenario
If price successfully breaks and closes above 0.1500, momentum will flip in favor of the bulls.
A confirmed breakout could unlock the next targets:
0.1740 – 0.1800 → first breakout zone,
0.1920 – 0.2000 → medium-term expansion area,
0.2200 – 0.2540 → final swing target zone.
Additional confirmation signals:
Rising breakout volume,
8H or daily candle closing firmly above trendline,
RSI & MACD showing early bullish crossover from neutral zone.
This scenario could signal the end of accumulation and the start of a new impulsive wave.
---
Bearish Scenario
If price fails to break the descending line and gets rejected again, the 0.13–0.12 zone becomes the last defense for bulls.
A breakdown below 0.1200 would re-confirm bearish control, targeting:
0.10 as the next liquidity pool,
and possibly 0.0920 if another liquidation spike occurs.
Rejection at the trendline would reinforce seller dominance and continue the broader downtrend until a new higher low forms.
---
Technical Conclusion
WLFI is standing at a make-or-break level, where just one decisive candle can flip the entire structure from bearish to bullish.
This setup is ideal for position traders seeking early accumulation before full breakout confirmation.
However — caution is key.
A breakout without volume is a trap, and a breakdown without confirmation could be a fakeout.
Watch the price reaction closely around the descending trendline, as this is where the next major move will be defined.
---
#WLFI #WLFIUSDT #CryptoBreakout #TrendlineResistance #CryptoAnalysis #ChartPattern #TechnicalAnalysis #CryptoTrading #AltcoinSetup #SwingTrade #SupportResistance #MarketStructure
ETHUSDT.P - October 28, 2025Price has broken the short-term descending trendline, showing early bullish momentum towards the profit level 4228.35, with the stop level at 4061.07 and breakeven adjustment at 4148.53. Given the wide stop distance relative to recent volatility, this is a medium-risk setup.

Bearish drop off?The Ethereum (ETH/USD) has rejected off the pivot whic has been identified as an overlap resistance and could drop to the 1st support.
Pivot: 4,262.14
1st support: 3,693.05
1st Resistance: 4,440.49
Disclaimer:
The above opinions given constitute general market commentary, and do not constitute the opinion or advice of IC Markets or any form of personal or investment advice.
Any opinions, news, research, analyses, prices, other information, or links to third-party sites contained on this website are provided on an "as-is" basis, are intended only to be informative, is not an advice nor a recommendation, nor research, or a record of our trading prices, or an offer of, or solicitation for a transaction in any financial instrument and thus should not be treated as such. The information provided does not involve any specific investment objectives, financial situation and needs of any specific person who may receive it. Please be aware, that past performance is not a reliable indicator of future performance and/or results. Past Performance or Forward-looking scenarios based upon the reasonable beliefs of the third-party provider are not a guarantee of future performance. Actual results may differ materially from those anticipated in forward-looking or past performance statements. IC Markets makes no representation or warranty and assumes no liability as to the accuracy or completeness of the information provided, nor any loss arising from any investment based on a recommendation, forecast or any information supplied by any third-party.

ETHUSD bullish breakout supported at 4,056The ETHUSD remains in a bullish trend, with recent price action indicating a corrective pullback within the broader trading range.
Support Zone: 4,056 – a key level from previous consolidation. Price is currently testing or approaching this level.
A bullish rebound from 4,056 would confirm ongoing upside momentum, with potential targets at:
4,312 – initial resistance
4,410 – psychological and structural level
4,520 – extended resistance on the longer-term chart
Bearish Scenario:
A confirmed break and daily close below 4,056 would weaken the bullish outlook and suggest deeper downside risk toward:
3,990 – minor support
3,920 – stronger support and potential demand zone
Outlook:
Bullish bias remains intact while the ETHUSD holds above 4,056. A sustained break below this level could shift momentum to the downside in the short term.
This communication is for informational purposes only and should not be viewed as any form of recommendation as to a particular course of action or as investment advice. It is not intended as an offer or solicitation for the purchase or sale of any financial instrument or as an official confirmation of any transaction. Opinions, estimates and assumptions expressed herein are made as of the date of this communication and are subject to change without notice. This communication has been prepared based upon information, including market prices, data and other information, believed to be reliable; however, Trade Nation does not warrant its completeness or accuracy. All market prices and market data contained in or attached to this communication are indicative and subject to change without notice.

TAO Could Explode if This Zone BreaksBINANCE:TAOUSDT has been repeatedly testing the resistance zone and is now making another strong attempt with solid momentum.
If the price manages to break and close above this zone, it could trigger a massive upside move. Keep a close eye, momentum is building up fast.
DYOR, NFA

Ethereum (ETH/USDT): Possible Short OpportunityHi guys!
ETH is currently testing the ascending trendline support after forming a potential lower high near the $4,165 zone. The structure shows early signs of weakness as buyers failed to maintain momentum above the last swing top.
A clean break below the trendline could confirm a short-term bearish shift, targeting the $4,030–$4,000 support zone, which aligns with the previous breakout level. The invalidation of this setup would occur if the price breaks and holds above $4,165, signaling renewed bullish momentum.
important levels:
Resistance: $4,165
Support: $4,030 – $4,000
Bias: Bearish below $4,165

ETH Analysis (4H)After the heavy dump on altcoins, the market is still quite volatile. However, after several days and weeks of ranging, it’s gradually returning to normal and becoming more predictable for analysis.
Ethereum has formed a reversal pattern at the bottom and has made three higher lows. It’s expected to move toward the red zone while holding the green area, and then get rejected toward lower levels.
The best area for a long buy is the green box, and the best area for a short sell is the red box.
Let’s wait and see what happens next.
For risk management, please don't forget stop loss and capital management
When we reach the first target, save some profit and then change the stop to entry
Comment if you have any questions
Thank You

DeGRAM | ETHUSD is above the support area📊 Technical Analysis
● ETH/USD broke above its descending resistance line and retested the 4,000 support zone, confirming a breakout from a medium-term accumulation structure.
● The price now targets 4,300 as the next resistance, with ascending channel dynamics supporting continued bullish momentum.
💡 Fundamental Analysis
● Ethereum gains traction amid rising DeFi activity and institutional accumulation, while stable macro sentiment boosts broader crypto risk appetite.
✨ Summary
● Long bias above 4,000; targets 4,300. Breakout confirmation and improving fundamentals support medium-term upside.
-------------------
Share your opinion in the comments and support the idea with a like. Thanks for your support!
ETHEREUM BULL-RUNI believe Ethereum is doing what bitcoin did in 2020-21 and 300% rise to about 14k in 2 months is pretty normal in cryptos

AIXB/USDT — Decision Zone: Reversal or Major Breakdown Ahead?
Main Summary:
AIXBT is currently standing at a critical juncture. After a strong rejection from the descending trendline, price has pulled back to retest the key demand zone at 0.0793–0.0690, which also aligns perfectly with the Fibonacci retracement 0.5–0.618 area — a golden pocket where buyers often reappear.
This is the balance point between buyers and sellers, where the next move will define the mid-term direction of this market.
---
Structure & Technical Pattern
Price continues to print lower highs since May, forming a clear descending structure.
The yellow zone 0.0793–0.0690 has acted as a major accumulation base, providing strong reactions in previous cycles.
The pattern resembles a Descending Triangle, where an upside breakout could trigger a reversal, while a downside break could accelerate the bearish continuation.
---
Bullish Scenario — Golden Zone Reversal Setup
Confirmation Required: Daily close above the descending trendline and a breakout above 0.102.
Once confirmed, it would mark the first higher high after a prolonged downtrend — signaling a potential trend reversal.
Upside targets:
1. 0.128 → first psychological resistance & supply zone
2. 0.181 → mid-term target if momentum sustains
3. 0.234 → full measured move from triangle breakout
A strong bullish reaction here could ignite the start of a major reversal phase, especially if supported by increasing volume.
---
Bearish Scenario — Breakdown Confirmation
Confirmation Required: Daily close below 0.0690 with strong selling volume.
This would confirm a descending triangle breakdown, signaling the continuation of the broader downtrend.
Downside target: around 0.046, the previous swing low and last major demand zone.
Losing the yellow block means buyers lose full control, pushing price into an extended distribution phase.
---
Momentum Key Points
Zone 0.0793–0.0690 = Decision Area.
This is where the real battle happens — either as a launchpad for a strong reversal or a trap zone before deeper decline.
Volume and candle reaction in this area will be crucial to confirm direction.
Watch for bullish engulfing, hammer candles, or RSI divergences to confirm potential reversal setups.
---
Conclusion
AIXBT is now entering a “do or die” phase, where the yellow block will determine the next major market structure.
A sustained hold above and breakout through the trendline could spark a strong recovery rally toward 0.128–0.181.
A confirmed breakdown below 0.069 could drag the market back down to 0.046.
This is not just another support — it’s the final accumulation zone before a possible structural shift.
---
#AIXBT #CryptoAnalysis #PriceAction #BreakoutSetup #DescendingTriangle #CryptoTrading #AltcoinWatch #SupportAndResistance #FibRetracement #MarketStructure

Potential bearish drop off?Ethereum (ETH/USD) has rejected off the pivot, which is an overlap resistance and could drop to the 1st support.
Pivot: 4,263.96
1st Support: 3,938.73
1st Resistance: 4,455.38
Disclaimer:
The above opinions given constitute general market commentary, and do not constitute the opinion or advice of IC Markets or any form of personal or investment advice.
Any opinions, news, research, analyses, prices, other information, or links to third-party sites contained on this website are provided on an "as-is" basis, are intended only to be informative, is not an advice nor a recommendation, nor research, or a record of our trading prices, or an offer of, or solicitation for a transaction in any financial instrument and thus should not be treated as such. The information provided does not involve any specific investment objectives, financial situation and needs of any specific person who may receive it. Please be aware, that past performance is not a reliable indicator of future performance and/or results. Past Performance or Forward-looking scenarios based upon the reasonable beliefs of the third-party provider are not a guarantee of future performance. Actual results may differ materially from those anticipated in forward-looking or past performance statements. IC Markets makes no representation or warranty and assumes no liability as to the accuracy or completeness of the information provided, nor any loss arising from any investment based on a recommendation, forecast or any information supplied by any third-party.

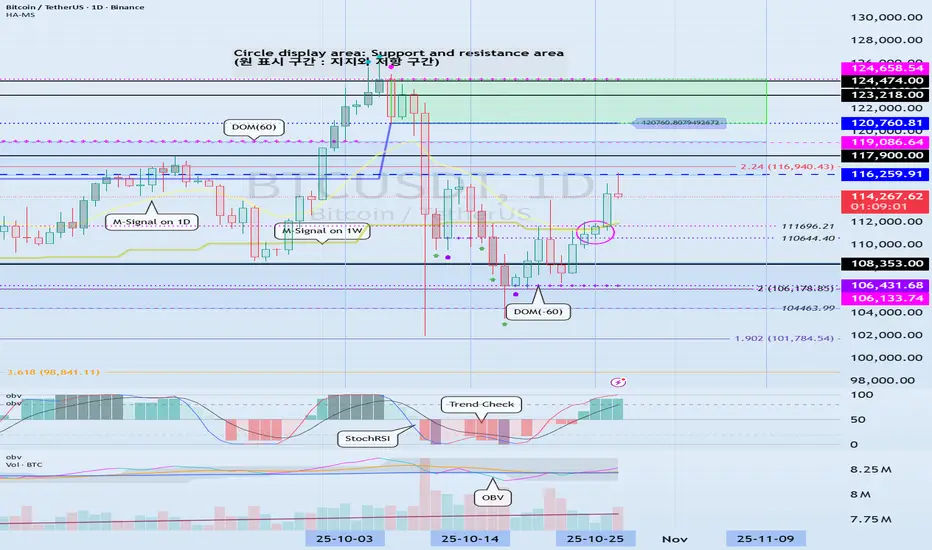
Examples of Chart Interpretation Methods
Hello, fellow traders!
Follow us to get the latest information quickly.
Have a great day!
-------------------------------------
#BTCUSDT
To break above a key point or range and continue the uptrend,
1. The StochRSI indicator must be trending upward. Ideally, it should not enter the overbought zone. 2. The On-By-Signal (OBV) indicator must show an upward trend. If possible, it should remain above the High Line.
3. The TC (Trend Check) indicator must show an upward trend. If possible, it should remain above the 0 level.
Currently, only the TC indicator satisfies the above conditions.
Therefore, if the price remains above the 110644.40-111696.21 range and the above conditions are met, we should see if the price rises above 116259.91 and remains there.
If the On-By-Signal (OBV) indicator remains above EMA 1 and EMA 2 and rises above the High Line, further upside is likely.
However, if the K indicator of the StochRSI indicator enters the overbought zone and the slope changes, the upside may be limited.
When the TC (Trend Check) indicator touches its highest point, there's a high probability of forming a new high, so you should consider a response plan.
Summary of the above:
Support Zone: 110644.40-111696.21
Resistance Zone: 116259.91-119086.64 (up to 124658.54)
------------------------------------
#ETHUSDT
As mentioned in the BTC chart description, ETH is also showing similar movements.
However, the OBV indicator is just about to break above EMA 1 and EMA 2, so if it finds support near 4109.80, there's a possibility of further upside.
-------------------------------------
#ZECUSDT
Based on the BTC chart description, ZEC is likely to continue its upward trend.
The chart is broken due to the sudden surge, making it difficult to determine the duration of volatility.
--------------------------------------------
#XRPUSDT
The key is whether the price can find support at key support and resistance levels and rise above 2.9092.
------------------------------------------
Ultimately, trading will be based on the support and resistance levels drawn on the 1M, 1W, and 1D charts.
However, it is recommended to use auxiliary indicators to confirm whether to initiate a trade.
The basic trading strategy is to buy in the DOM(-60) ~ HA-Low range and sell in the HA-High ~ DOM(60) range.
However, if the price rises in the HA-High ~ DOM(60) range, a step-up trend is likely, while if the price falls in the DOM(-60) ~ HA-Low range, a step-down trend is likely.
Therefore, a fractional trading strategy is recommended.
In this context, the coin (token) currently closest to buying is XRP.
-
Thank you for reading to the end.
I wish you successful trading.
--------------------------------------------------
Ethereum - This triangle decides everything!🪄Ethereum ( CRYPTO:ETHUSD ) still respects the triangle:
🔎Analysis summary:
As we are speaking, Ethereum is creating the fourth retest of the previous all time high. Since Ethereum has been trading in a bullish triangle pattern for the past four years, a bullish breakout remains likely. But short term volatility remains totally expected.
📝Levels to watch:
$4,000
SwingTraderPhil
SwingTrading.Simplified. | Investing.Simplified. | #LONGTERMVISION

ETHEREUM climbing up slow and steadyETH is slowly breaking above resistance levels. However, the hard work is not over. As ETH tries to reclaim its range, it's important that the bull maintain momentum. Volume is a factor in with current price action. Without volume back PA, it will be difficult to sustain the bullish move.

Eth Short :: ETF Outflows / DAT RiskETH is in a descending triangle on the 4 hour chart which is a bearish pattern.
A few other factors outside of price action that suggest a possible correction:
Net weekly ETF outflows. -63k ETH last week.
Potential multi-year double top playing out but that won't be invalidated until price falls below $1,000ish which is highly unlikely.
ETH validator exit queue at record high level of 43 days with roughly 25 million ETH queued to exit staking. Not all is likely to be sold, but the record exodus can't be bullish. www.validatorqueue.com
Proliferation of Digital Asset Treasuries (DATs) that add very little value to the ecosystem to justify a premium over readily available ETFs. Given the recent decline in ETH price, many are now trading at a discount to NAV. This creates the potential for a negative spiral by forcing sales of assets which adds further pressure to others. Tom Lee who has a vested interest in DAT success said the DAT bubble has started to pop (DAT bubble..not specifically ETH). This by far is the biggest risk to the space. It may take some time to materialize but if it does, I suspect that it will be unwind rapidly.
There are many incredibly bullish counterarguments that could easily take this back up quickly, so this idea will be invalidated when the upper trend line is broken on volume.
My long-term view is bullish but there is a lot of hype and excess in the space that periodically needs to be cleared out. If the descending triangle plays out, we could see another ~20% drop to the $3,000 range.
I am already short but the more cautious approach is to wait until the lower support is broken on volume.
History Repeats? BTC Dominance Rejected at the Same Zone AgainBTC Dominance is currently facing rejection from the key resistance zone after multiple failed attempts to break above it.
If it continues to struggle here and fails to reclaim the upper zone, a potential drop could follow — which might give altcoins some room to breathe and rally.
Keep an eye on how dominance reacts here; this zone has historically triggered major trend shifts across the market.
DYOR, NFA
Thanks for reading! Appreciate your support and engagement 🙏

ZCASH Breaks 3-Year Accumulation!$ZCASH has finally broken above its 2021 high after spending over three years in a long accumulation phase. This breakout above the major resistance zone signals a clear shift in momentum and could mark the start of a strong bullish cycle.
As long as the price holds above the breakout zone, the structure remains solid, any retest toward $240–$260 could offer a healthy entry point before the next leg higher. Momentum looks powerful here.
DYOR, NFA
