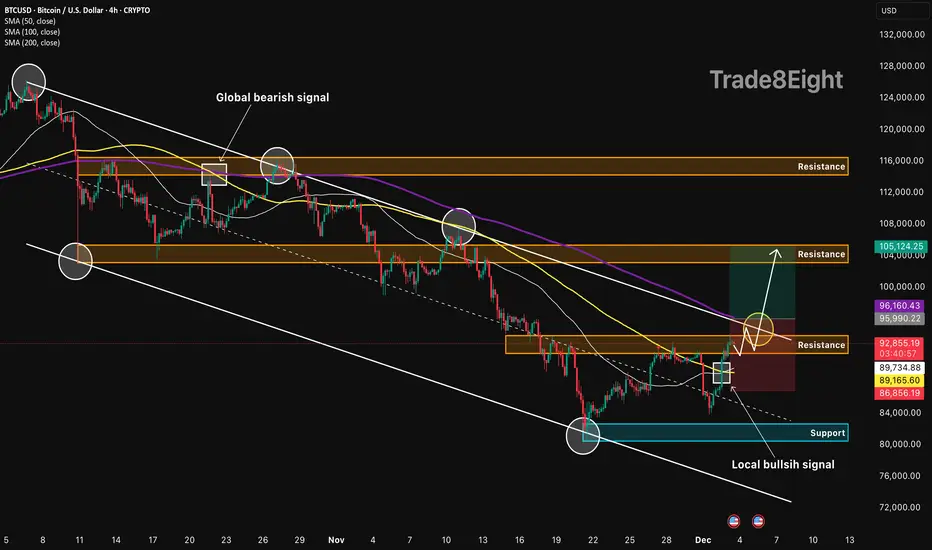
BTCUSD: channel breakout setup🛠 Technical Analysis: On the 4-hour timeframe, Bitcoin (BTCUSD) is trading within a descending channel but has recently printed a "local bullish signal" after bouncing from the 82,000 support zone. The price is currently compressing against the channel's upper trendline and the immediate resistance block at 92,877, with the moving averages (SMA 50, 100) flattening to support a potential reversal. The projected trade setup anticipates a high-momentum breakout above the SMA 200 and the diagonal resistance, targeting the liquidity pool at the 105,000 level.
❗️ Trade Parameters (BUY) ❗️
➡️ Entry Point: Buy on confirmed breakout of resistance (approx. 95,500 – 96,200)
🎯 Take Profit: 104,500 – 105,120
🔴 Stop Loss: Below SMA (approx. 86,850)
⚠️ Disclaimer: This is a potential trade idea based on current analysis; market conditions and price direction are subject to change based on news factors and volatility.
Ethereum (Cryptocurrency)
$ETH: Ethereum seems to be pointing toward a bottom at $...What I’m seeing on the daily chart is pretty clear:
The MACD is already deeply oversold, yet Ethereum continues to fall. Normally, such a setup would trigger a technical rebound — but the price action is not following.
This tells us one thing: bearish absorption.
Whales are unloading into every attempt to push upward, absorbing the buys and slowly forcing the price down. The ETH being sold is still changing hands, and until this process completes, CRYPTOCAP:ETH remains pressured to the downside.
Because the MACD is extremely oversold, we should expect some technical bounces — but opening a long here is extremely risky. Patience is better than gambling in a downtrend without support beneath your feet.
Right now, $2100 looks like the strongest support zone and a likely level for a meaningful bounce.
But in a broader bearish environment, even that bounce could just be a short-term relief before a new leg down or a reaccumulation phase.
So there’s no need to rush or FOMO into every green candle.
Bounces are normal — the trend remains bearish until ETH reaches the demand zone around $2100.
And if ETH doesn’t react at that level… that would be a very bad signal.
Statistically, $2100 has a high probability of being reached and acting as a solid reaccumulation zone.
DYOR
#Ethereum #ETH #CryptoAnalysis #TechnicalAnalysis #Altcoins #CryptoTrading #MACD #PriceAction #BearishTrend #SupportZone #CryptoMarket #BTC #CryptoNews
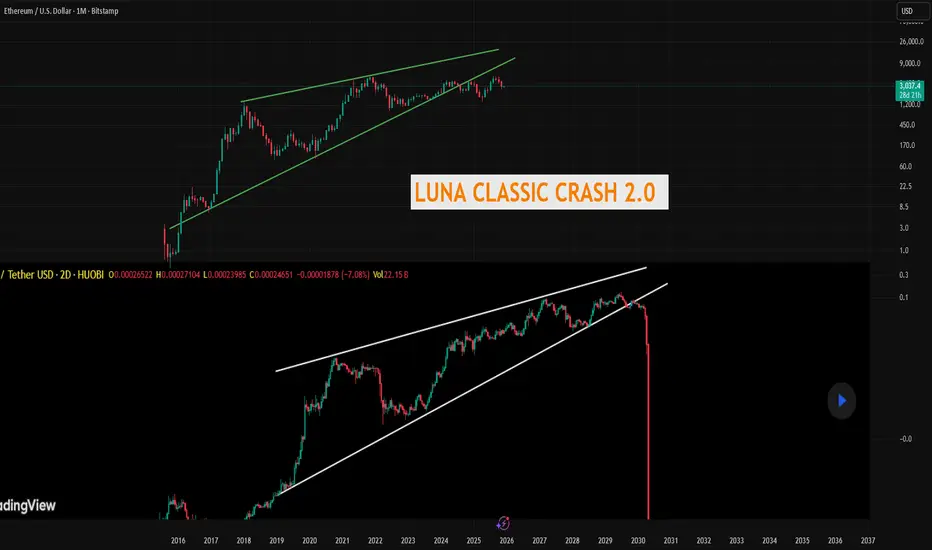
IS ETH ABOUT TO CRASH LIKE LUNA CLASSIC?I pointed this out a couple years ago you can fins my chart in my profile but I think ETH might crash like Luna Classic did. Look at the similarities with the massive rising wedge. ETH is actually outdated, clunky, the fees are stupid high, and its extremely overvalued, in my opinion. I called the Luna Classic crash down to about 50 cents from when it was at its high around 70 dollars, Ill link it below, it went waaay below even my crazy target. People thought I was crazy, go read the comments.
I think the same is on tap for Ethereum. Its already broken below if it cant get back above, I see a waterfall of red candles. What the narrative will be who knows but its coming.
The chart I added of Luna you cant even find it anymore on here this is a screenshot of that chart from my previous ideas.
Not financial advice just my opinion.
Ethereum continues to dance for dollars. Eth continues to trade inside a wide range. Buyers stepped in again at the same demand zone that has held multiple times, but price is now pushing back into a heavy resistance area on the volume profile.
Momentum shows the same pattern we’ve seen at previous local tops: strong bounce into overbought conditions without a confirmed trend change. Until ETH breaks above this high-volume cluster, the broader structure stays neutral to bearish.
For now, ETH remains range-bound. Key levels are clear, and a breakout on either side will determine the next major move.

SOL Near Inflection PointCRYPTOCAP:SOL is holding well above the mid S/R zone and showing solid strength. If it continues to rebound from this area, price could push back toward the upper resistance.
But if SOL breaks below this zone, it may slide down toward the $80 levels.
DYOR, NFA
Please hit the like button if you like it, and share your views in the comments section.

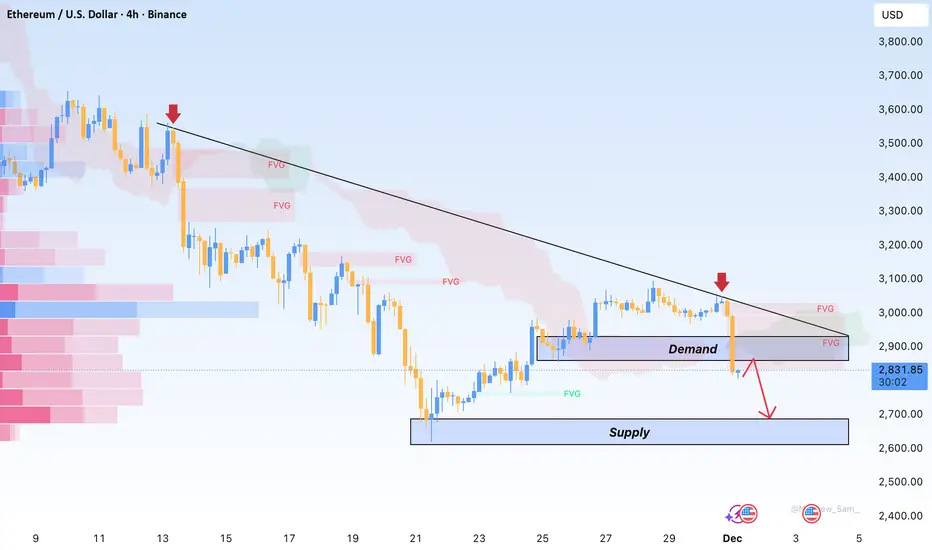
ETHUSD 1H — Short Opportunity After Channel BreakCOINBASE:ETHUSD
Price is trading inside a broad descending structure, and the recent move appears corrective, forming a rising channel. This type of structure often represents distribution before continuation lower.
A sweep into the 3,250–3,320 supply zone aligns with previous imbalance and trendline rejection. If the price rejects this zone with momentum, the bearish continuation setup becomes valid.
Key Scenarios
❌ Bearish Case (Primary Setup) 📉
Ideal Entry: 3,250–3,320 Zone (Supply)
→ 🎯 Target: 2,700–2,650 (Liquidity Sweep + Demand Zone)
→ 🛑 Stop Loss: Above 3,380
Confirmation triggers:
• Break of rising channel
• Bearish engulfing candle
• Wick rejection into the zone
Levels to Watch
Type Price
Short Entry 📍 3,250–3,320
Target 🎯 2,650–2,700
Stoploss ❌ 3,380
Invalid if Broken Trendline + Structure Flip
⚠️ This analysis is for educational purposes only — not investment advice.

LINK Showing Strength at Long-Term Support ZoneBIST:LINK is bouncing cleanly from its long-term weekly trendline support, keeping the bullish structure intact.
Price is still moving inside a large wedge, and if this rebound continues, a retest of the upper resistance line is likely.
A breakout above that level could open the door for a stronger move.
DYOR, NFA
Please hit the like button if you like it, and share your views in the comments section.

ETH mid-term TAEthereum as well as Bitcoin has stopped the distribution on daily time frame and both may have a relief X-mas rally, but it's too early to confirm yet and it's not a reversal of a downtrend either, the indicators remain in the bearish territory which may result in a short-lived rally. Be cautious of the current high risk. Technically mid-term trend remains bearish.

ETHUSD (30m) – Liquidity Trap & Bearish Continuation OutlookFX:EURUSD
Price has already cleared several liquidity points and broken a major descending trendline. As long as the structure remains intact and support holds, continuation toward the next premium level is likely.
Key Scenarios
✅ Bullish Case 🚀
If price retests and holds above 4,154 zone
→ 🎯 Target 1: 4,210
→ 🎯 Target 2: 4,250–4,270 major resistance
❌ Bearish Case 📉
Break and close below 4,129 invalidation zone
→ 🎯 Downside Target: 4,105–4,070
Current Levels to Watch
Resistance 🔴: 4,210 🡆 4,250–4,270
Support 🟢: 4,154 🡆 4,129 (invalidation)
Liquidity Swept: Prior highs cleared
⚠️ Disclaimer: This analysis is for educational purposes only — not financial advice

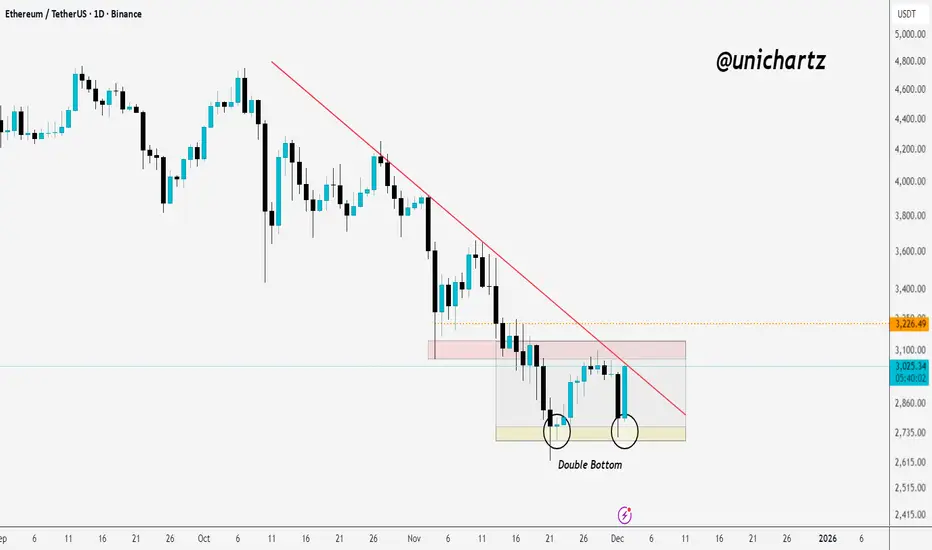
ETH Daily Structure Turning Bullish?CRYPTOCAP:ETH has formed a clear double-bottom pattern on the daily timeframe.
A breakout above the trendline and the consolidation zone would be a strong signal of a potential trend reversal.
Keep an eye on this setup, it could turn bullish quickly if confirmed.
DYOR, NFA
Please hit the like button if you like it, and share your views in the comments section.
ETH Demand Zone Activated: Trend Shift or Dead Cat?CRYPTOCAP:ETH 3Days Technical Analysis:-
ETH is showing a steady bounce after tapping the 0.618 Fib level, which aligns perfectly with the FVG (green zone) acting as a strong demand area.
Price reclaimed the trendline breakdown region and is now holding above the key support zone.
A sustained move above $3,175 (0.5 Fib) could open the door for a retest of $3,596 (0.382 Fib).
Structure will remain intact as long as ETH stays above the FVG block.
Levels to watch:
• Support: $2,750 – $2,850 (FVG / 0.618 Fib)
• Resistance: $3,175 → $3,596
DYOR / NFA
Please hit the like button if this post helped you in any way.
Thank you.
#PEACE

ETHUSD downtrend continuation below 3,185The ETHUSD pair continues to display a bearish outlook, in line with the prevailing downward trend. Recent price action suggests a corrective pullback, potentially setting up for another move lower if resistance holds.
Key Level: 3,185
This zone, previously a consolidation area, now acts as a significant resistance level.
A failed test and rejection at 3,185 would likely resume the bearish momentum.
Downside targets include:
2,730 – Initial support
2,640 – Intermediate support
2,513 – Longer-term support level
Bullish Scenario (breakout above 3,185):
A confirmed breakout and daily close above 3,185 would invalidate the bearish setup.
In that case, potential upside resistance levels are:
2,640 – First resistance
2,513 – Further upside target
Conclusion
ETHUSD remains under bearish pressure, with the 3,185 level acting as a key inflection point. As long as price remains below this level, the bias favours further downside. Traders should watch for price confirmation around that level to assess the next move.
This communication is for informational purposes only and should not be viewed as any form of recommendation as to a particular course of action or as investment advice. It is not intended as an offer or solicitation for the purchase or sale of any financial instrument or as an official confirmation of any transaction. Opinions, estimates and assumptions expressed herein are made as of the date of this communication and are subject to change without notice. This communication has been prepared based upon information, including market prices, data and other information, believed to be reliable; however, Trade Nation does not warrant its completeness or accuracy. All market prices and market data contained in or attached to this communication are indicative and subject to change without notice.

Ethereum Price Prediction: Can New Holders Fill the LTH Gap?Ethereum is trading at $2,805 at the time of writing, reflecting a 6% daily decline. The asset is sitting just below the $2,814 resistance level after its latest failed attempt to break through $3,000.
Based on current sentiment and market structure, ETH could stabilize and attempt a rebound, but a strong recovery will require consistent investor support. In the near term, Ethereum will likely fluctuate between $2,814 and $3,000 as it searches for direction.
If bullish momentum strengthens and fresh demand remains steady, Ethereum could finally break above the $3,000 barrier. A successful breach would pave the way for a move toward $3,131 and potentially $3,287, invalidating the short-term bearish thesis.

ETHUSDT /// 2DECEthereum lately has been showing signs of weakening after losing the support area around $3400–$3600. With this break, the market structure has shifted toward a more bearish tone, meaning the asset may continue forming lower highs and lower lows as long as downward momentum remains dominant.
At the moment, price reactions around the $3000 zone suggest that supply is still relatively strong. If this structure continues, several potential bearish paths remain valid.
⸻
Possible scenarios toward the $2000 region
Scenario 1
If the $3000 area acts as a local high, Ethereum could continue its downward trajectory toward the $2000 zone.
In such a case, the price might develop smaller corrective upward movements within the broader bearish leg.
⸻
Scenario 2
Another possibility is that the $2800 area generates a short-term bullish reaction.
Such a move could push the price toward the $3600–$3800 range before facing renewed selling interest.
If that happens, a continuation toward the $2000 zone could remain on the table.
⸻
General outlook
In both scenarios described above, a revisit of the $2000 area is one possible development based on the current technical structure.
This outlook is purely scenario-based and may change if the market structure shifts.
⸻
About the possibility of $1000 ETH
Reaching the $2000 zone does not automatically imply deeper downside.
However, the manner in which price approaches that area could provide clues:
• A sharp, capitulation-type decline toward $2000 might suggest that a local bottom has formed.
• A slow, corrective decline could indicate weakening momentum, in which case observing price behavior after reaching $2000 becomes important.
If bearish continuation patterns appear at that stage, lower levels — including the $1000 region — cannot be ruled out as long as the downtrend structure persists.
Once price interacts with the $2000 zone, I will share an updated analysis based on the new market structure.

ETH Faces Heavy Rejection, Downside Risk IntensifiesETH printed a strong 4H bearish candle as soon as price retested the 3,030–3,100 supply zone, confirming that sellers still dominate this area. The sequence of lower highs remains intact, and the sharp break below 2,900 with increased volume signals a genuine sell-off rather than a routine shakeout.
Price is currently hovering around the 2,820–2,850 support, but buying interest is weak. The 2,750–2,780 pocket carries deeper liquidity and is a more realistic area for the market to stabilise if downward momentum continues.
Macro conditions also lean bearish: US yields are climbing, expectations for prolonged high rates from the Fed persist, regulatory pressure from the SEC remains, and whale flows to exchanges add further weight on crypto sentiment.
My view: ETH is more likely to slide toward 2,750–2,780 before any meaningful recovery. Only a 4H close above 3,030 would provide early signs of a short-term reversal.
HUMA/USDT – Reversal Incoming or Deeper Breakdown?HUMA has been moving inside a large Descending Channel for months, forming a repeated yet controlled pattern of selling pressure. Every rally has consistently failed to break the upper trendline, maintaining a strong lower-high structure. But now, something important is happening:
👉 Price is sitting directly above the Key Support at 0.025–0.0225, a long-standing “life-or-death” zone for buyers.
This is not just another support — this is the final defense before a major structural breakdown or a powerful market reversal.
---
🔶 Clear Technical Structure
1. Descending Channel (Major Trend)
The trend remains bearish, but the channel is tightening — an early sign of momentum shift.
2. Key Support Box (0.025–0.0225)
This zone has acted as a strong demand area multiple times.
The more it gets tested, the bigger the potential move — either a breakout upward or a sharp breakdown.
3. Midline Reaction
Price frequently reacts around the midline, showing that market participants are respecting this dynamic level.
4. Key Horizontal Targets
0.031 → 0.037 → 0.0445 → 0.055 → 0.067
These levels are not only resistance but also potential rally checkpoints if structure shifts bullish.
---
🟢 Bullish Scenario (Major Reversal Potential)
Bullish bias becomes valid only if:
1. Price breaks the upper trendline with clean momentum.
A breakout without volume is not valid.
2. Daily close above 0.031.
This confirms the long-term downtrend is weakening.
If confirmed, bullish targets:
TP1: 0.037 (nearest resistance, minor rejection zone)
TP2: 0.0445 (major structural resistance)
TP3: 0.055 (bullish structure activation)
TP4: 0.067 (high-value upside target)
Bullish Intent
The channel has extended for a long period — sellers may be exhausted.
Price is stabilizing near strong support.
Large reversals often begin from areas like this.
---
🔴 Bearish Scenario (Trend Continuation)
Bearish momentum continues if:
Daily close falls below 0.0225.
This would indicate the final support has failed.
Bearish downside targets:
T1: 0.018 (mid-to-lower channel zone)
T2: 0.015–0.0135 (lower boundary, potential capitulation sweep)
Bearish Intent
The Descending Channel remains dominant.
Selling pressure is still strong near the upper trendline.
Losing the key support can trigger panic-driven moves.
---
🎯 Market Psychology
The 0.025–0.0225 level currently represents:
A slow accumulation zone for smart money, or
A distribution zone before continuation downward
At this stage, the market is choosing its next direction — and the move that follows this zone is usually significant.
---
#HUMA #HUMAUSDT #CryptoAnalysis #TechnicalAnalysis #DescendingChannel #ReversalZone #BreakoutWatch #CryptoTrading #AltcoinAnalysis #MarketStructure #SupportAndResistance #ChartPatterns

The MicroStrategy Bitcoin Bottom!Today MicroStrategy formed a beautiful daily chart bottoming tail on extreme volume.
Its truly a picture perfect reversal signal.
This reversal came on the back of BTC being very weak and still down 5% at market close.
Michael Saylor announced an addition of a 130BTC purchase, but also has set aside a billion dollar expense fund if he needed to sell some BTC.
The likely hood of MSTR having to sell BTC is very unlikely.
We traded MSTR today for a lovely gain. Riding 180 calls to the upside.

$ETH, $4.7K+ Before End of 2027? Retracement Potential?Ethereum is one of those that I am neutral on but invested for long term holds. They have a monopoly on tokenization, yet at the same time, the whole purpose of Ethereum has changed dramatically.
The PoS transition when Ethereum Classic was the original Ethereum and Ethereum PoW is currently the "decentralized newer Ethereum" have left various technologist confused along with the removal of the Ropsten testnet. This has shown Ethereum to be much more centralized than promised and it is entering muddy waters in that sense.
Likewise, can Ethereum differentiate itself from Namecoin, Peercoin and these original PoS forks who got outpaced? Ethereum's technical transition also emphasizes the need for subnets, rollups and speed. Currently they are competing against Solana as well as other players including Z-Cash or minimal small players like Celo and Cardano. The technical differentiation needs to be expanded however in order to allow for scalability. Likewise, Ethereum is still prime in terms of PoS and name-brand but may not be prime in terms of technology.
That said, the long-term potential is still there and Ethereum has a hard to replace developer ecosystem. The patterns when considering fib retracement along with the past cipher and PnL setup showcase the potential of a $4.7K price point by October 2027. As always, none of this is investment or financial advice. Please do your own due diligence and research.

BTCUSD | Rejected Posted this idea few days ago and worked out a bit to well maybe :).
We are still in a downtrend so that's the reasoning behind the short idea from the red zone.
looking forward to see what happens at the 81.500 level.
What are your insights on Bitcoin?
Stay safe out there and do your own due diligence, this is not investment advise!

How to Build a Consistent Execution Checklist on TradingViewMost trading mistakes don’t come from bad strategy, they come from inconsistent execution.
An execution checklist removes guesswork and replaces it with structure.
When your actions follow a routine, your results stabilize.
TradingView gives you everything you need to build a checklist that stays visible, actionable, and tied directly to your chart.
1. Define Your Core Conditions
Before any trade, the bigger picture must be clear.
Start your checklist by answering three questions:
What is the higher-timeframe direction
Where is price relative to key levels
Is price approaching with strength or weakness
Use TradingView’s drawing tools to mark support, resistance, value zones, and session highs and lows.
Add a simple text note on the chart listing your core conditions so they are always visible.
If the market context fails this first screen, the trade is already invalid.
2. Build Confirmation Criteria
Once structure is confirmed, you move to evidence.
Mark confirmation areas directly on your chart:
Liquidity pools
Fair value zones or imbalances
Previous session highs and lows
Asian range or New York open
If your strategy uses indicators, document exact conditions:
Moving average position and slope
Volume behavior
VWAP location
Volatility expansion or contraction
Define rules that don’t change based on emotion.
Confirmation should prove your bias, not justify your urge to trade.
3. Validate Risk Before Execution
Every setup must survive a risk checkpoint before it’s allowed to go live.
Your checklist must answer:
Where is my invalidation level
How much capital am I risking
Does this violate any daily limits
Is the reward worth the risk
Use TradingView’s long or short position tool to visualize risk directly on the chart.
Save it as a template so your risk process stays uniform across all trades.
No trade is valid if risk isn’t clean.
4. Create a Pre-Execution Routine
A checklist only works if you actually follow it.
Add a short pre-trade process directly to your chart notes using checkboxes or bullet points:
Example execution checklist:
Market phase confirmed
Level identified
Confirmation present
Risk valid
Entry condition active
Walk through this list before clicking buy or sell.
If one item fails, the trade fails.
Over time, this routine removes emotional impulse completely.
5. Review and Refine Weekly
Your checklist isn’t static, it evolves.
Every week ask:
Where did I break my rules
What conditions led to losses
Which confirmations work best
What rules saved me from bad trades
Use TradingView’s trade replay and journaling features to review execution quality, not just profit.
Consistency improves when your system evolves with you.
Final Thought
A checklist doesn’t restrict your trading, it frees you from emotion.
When your process is clear, your confidence increases.
When your confidence increases, discipline follows.
Good traders make decisions.
Great traders execute procedures.
Stay Green!
ETHUSD | Let that sink in...Understand the chartTL;DR: This chart looks like what happened in 2021 in a ridiculous way. A breakout, a rejection, a relief rally, then a painful descent through layered support zones.
I really don’t want to be the guy who says “I told you so” but charts teach with loss as often as profit.
Look at what happened when ETH reached ATH in 2021. A clear breakout and immediate rejection. Price then collapsed with multiple spikes to trick HODLers and bull for life traders.
----------------------------------------------
The lesson the chart here to offer
If our analysis is correct, we’ll see a short-lived manipulation into resistance ($3.6–$4.0k) that will suck in all longs.
What happens next you may ask? Straight down to support zones.
Breaking one support usually leads to the next.
----------------------------------------------
Practical rules to survive this (educational only):
Assume rallies are traps until proven otherwise. Wait for structure (higher lows + higher highs) on higher timeframes before adding long positions.
Manage size. If you trade this, keep position sizing small and protect capital with stops and trailing stops when in a winning trade.
Use multi-timeframe confirmation. Don’t buy solely on daily candles. Micro structure of a daily candle forms on smaller timeframes.
If you want to accumulate, always scale. Don’t all-in. That way you better position yourself, increase your profit and decrease your loss
As always...Stay disciplined.
----------------------------------------------
Good Luck!
P.S: Check the linked idea for a better understanding.

ETHUSD | Don’t get fooled...Understand the chartTL;DR: This chart looks like what happened in 2021 in a ridiculous way. A breakout, a rejection, a relief rally, then a painful descent through layered support zones.
I really don’t want to be the guy who says “I told you so” but charts teach with loss as often as profit.
Look at what happened when ETH reached ATH in 2021. A clear breakout and immediate rejection. Price then collapsed with multiple spikes to trick HODLers and bull for life traders.
----------------------------------------------
The lesson the chart here to offer
If our analysis is correct, we’ll see a short-lived manipulation into resistance ($3.6–$4.0k) that will suck in all longs.
What happens next you may ask? Straight down to support zones.
Breaking one support usually leads to the next.
----------------------------------------------
Practical rules to survive this (educational only):
Assume rallies are traps until proven otherwise. Wait for structure (higher lows + higher highs) on higher timeframes before adding long positions.
Manage size. If you trade this, keep position sizing small and protect capital with stops and trailing stops when in a winning trade.
Use multi-timeframe confirmation. Don’t buy solely on daily candles. Micro structure of a daily candle forms on smaller timeframes.
If you want to accumulate, always scale. Don’t all-in. That way you better position yourself, increase your profit and decrease your loss
As always...Stay disciplined.
----------------------------------------------
Good Luck!
P.S: Check the linked idea for a better understanding.

ETHEREUM HIGH PROBABILITY LONG SETUP SOON!!!🚨 ETHER HIGH PROBABILITY BUY SETUP 🚨
* Here We Can See Clearly The Next Potential Moves For ETHUSD Coming Hours/Days.
* Keep Your Eyes Close On Your Trading Positions.
* Happy PIP Hunting Traders.
FXKILLA.
