ETH/USD LONG SET UP ON PULLBACKLast week’s major sell-off saw ETH/USD experience one of its most dramatic sell-offs ever, a move that exacerbated the downturn from the 290.00 area that began in February. Traders exited long positions and decoupled from risk associated with ETH/USD and a series of major Stops were triggered during the crushing move lower at many levels. These price areas included the 177.39, 161.62, 154.03, 133.40, 130.67, 105.18, and 101.76 levels. Additional downside price objectives include the 111.69, 103.40, 95.66, 90.00, and 80.60 levels.
MavRich Premium Signals (Faris Issa)
Title :ETH/USD BUY LIMIT ORDER
Asset : Crypto Symbol : ETH/USD
Type : Limit Order
Time Frame : 1Month
Entry Price 1 : $96.68
Entry Price 2 : $82.50
Stop Loss : $72.68
Take Profit 1: $120.68
TP 2: $132.50
TP3: $140.50
TP.4 $160.68
Price activity is nearest the 50-bar MA (4-hourly) at 158.83 and the 50-bar MA (Hourly) at 120.51.
Technical Support is expected around 100.15/ 95.66/ 80.60 with Stops expected below.
Technical Resistance is expected around 125.08/ 133.37/ 140.95 with Stops expected above.
On 4-Hourly chart, SlowK is Bearishly below SlowD while MACD is Bullishly above MACDAverage.
On 60-minute chart, SlowK is Bullishly above SlowD while MACD is Bullishly above MACDAverage
Ethereumanalysis

ETH 4H DivergenceBullish divergence on the 4H chart, this may result in a short term upside. My 'bait' wick analysis was incorrect, and i apologize to anyone that entered a trade. I will link it. This divergence shows promise for the short term, and margin / leverage traders however. Fortune favors the bold! Currently analyzing the success rate of these divergences.

Ethereum SHORTwe can stop in this zone 0.38 fibonacci and continue towards the objective or complete the B wave in the marked area

ETH cap wide trading rangeETH cap can be seen to have a wide trading range, as indicated by the support and resistance provided by the parallel channel that is currently present. Massive opportunity for upsides.

Don't miss the great buy opportunity in ETHUSDTrading suggestion:
. There is a possibility of temporary retracement to suggested support line (238.70). if so, traders can set orders based on Price Action and expect to reach short-term targets.
Technical analysis:
. ETHUSD is in a Uptrend and the Continuation of uptrend is expected.
.The price is above the 21-Day WEMA which acts as a dynamic support.
. The RSI is at 80.
Take Profits:
TP1= @ 275.30
TP2= @ 319.45
TP3= @ 362.75
SL= Break below S2

Ethereum : Double Bottom pattern.Ethereum : Double Bottom pattern.
Note: This is only for Educational purposes; this is not investment advice.
ETHUSD Elliot Impulse WaveElliot impulse wave, currently beginning 5th wave, supported by a strong linear regression uptrend. 4H chart. Broadening ascending wedge.

Ethereum - $ETH - Heads-Up! I am Very optimist. The price close weekly above $166.75 a green candle in $ETH is coming.
Would be impressive though...
I really thought that we would see a retracement... but here we are... Welcome to trading.
Next levels to focus on are $167.4 and $174.
Reaching $174 will be a bullish heads up! Come on $ETH!
#ETHEREUM #CRYPTO

Don't miss the great buy opportunity in ETHUSDTrading suggestion:
. There is a possibility of temporary retracement to suggested support line (146.85). if so, traders can set orders based on Price Action and expect to reach short-term targets.
Technical analysis:
. Ethereum/US Dollar is in a range bound and the beginning of uptrend is expected.
.The price is above the 21-Day WEMA which acts as a dynamic support.
. The RSI is at 65.
. The RSI downtrend #1 is broken, so the probability of beginning of uptrend is increased.
Take Profits:
TP1= @ 163.30
TP2= @ 191.75
TP3= @ 223.20
SL= Break below S2

ETHEREUM 1/20 MOON TARGET DATEHello personal traders,
This is no secret.
Ethereum is on the rise.
Check ETH/BTC if you need reference, as well as market caps.
My logic is shown clearly on the graph with my indicators.
Buy and Hold Ethereum is my final call.
Thank you,
-dysonring2050
#whatwhalesdon'twantyoutoknow

My first ever fractalConstructive criticism encouraged! I'm new to fractals and they seem to be a great and very exciting tool for trading, long term Ethereum chart.

Don't miss the great buy opportunity in ETHUSDTrading suggestion:
. There is a possibility of temporary retracement to suggested support line (147.35). if so, traders can set orders based on Price Action and expect to reach short-term targets.
Technical analysis:
. ETHUSD is in a range bound and the beginning of uptrend is expected.
. The price is below the 21-Day WEMA which acts as a dynamic resistance.
. The RSI is at 38.
Take Profits:
TP1= @ 168.00
TP2= @ 191.75
TP3= @ 224.15
SL= Break below S2

Ethereum Analysis: Daily Timeframe Conclusion for today's Ethereum Analysis: Price closing below ~176.49 implies more downside momentum in Ethereum.
The Daily timeframe (log scale) is examined in today's Ethereum analysis. Chart patterns examined that are plotted include a bearish price channel and a bullish trendline. The 200 day moving average is also plotted to help provide perspective for future development of price action. December 15, 2018 price swing that reached the 363.30 price peak (on June 26, 2019) has since been followed by a downtrend in Ethereum.
Part of the current downtrend includes a July 16, 2019 break below the long term bullish trendline that lasted over 6 months. Price action also did break below the 200 moving average after closing below the bullish trendline, adding to a current bearish bias in Ethereum.
Price levels plotted on the chart offer areas of support (188.81 to 167.64) and resistance (363.74 to 307.08) for Ethereum and need to be monitored closely for bullish or bearish swings. A close above the 200 day moving average is bullish and implies price resuming an uptrend that should reach the resistance zone at the minimum.
A break below 176.49 on the other hand improves the chances of continuing the downtrend from June 26, 2019.

Ethereum market cap update 11.6.2019Possible reversal point incoming on didi index. Also increasing momentum on TSI. Possibly very bullish immediately above 20B :)

ETHUSD formed bullish Butterfly | A long opportunityPriceline of Ethereum / US Dollar cryptocurrency has formed a bullish Butterfly pattern and entered in potential reversal zone.
This PRZ area should be used as stop loss in case of complete candle stick closes below this zone.
I have used Fibonacci sequence to set the targets:
Buy between: 181.73 to 180.32
Sell between: 182.82 to 185.47
Regards,
Atif Akbar (moon333)

Ethereum Price Analysis: 3 Things You Must KnowConclusion for today's Ethereum Analysis: A break above ~196.88 is required as a minimum to consider any bullish position(s) in Ethereum.
Ethereum Analysis for today is presented on a log scale on the Daily timeframe. Price action from December 17, 2019 shows an overall upswing, followed by a bearish trend since June 25, 2019.
Three crucial points to keep in mind that provide context for Ethereum’s future price development are the following:
(1) Falling Wedge chart pattern: Part of the establishment of the falling wedge includes a break below the previous bullish price channel that lasted over 7 months. The falling wedge is currently active, but eventually implies a bullish breakout for Ethereum.
(2) 200 Day moving average: A break below the 200 day moving average on September 22, 2019 is bearish for Ethereum and price has traded under the average ever since then. Added confirmation of more momentum to the downside involves the 200 day moving average slope changing from zero to negative.
In such a scenario, a break below the lower boundary of the wedge would be anticipated as opposed to an upside breakout (ideal implication of a falling or descending wedge).
(3) Price level between 196.88 and 153.02: The aforementioned price level is important to watch in Ethereum as price has already successfully tested the lower boundary of the range on September 24, and 27, 2019. Another successful test occurring on October 23, 2019 improves the chances of the 153.02 level offering support for the price of Ethereum.
Momentum indicators can also be used to used to provide added confirmation of potential support. The upper region of the boundary at ~196.88 is tentative. Price reaching 196.88 and failing to close above it could serve as a breeding ground for more selling.
Conservative strategies to buy Ethereum includes waiting for price to close above 196.88 and also Ethereum’s 200 day moving average.

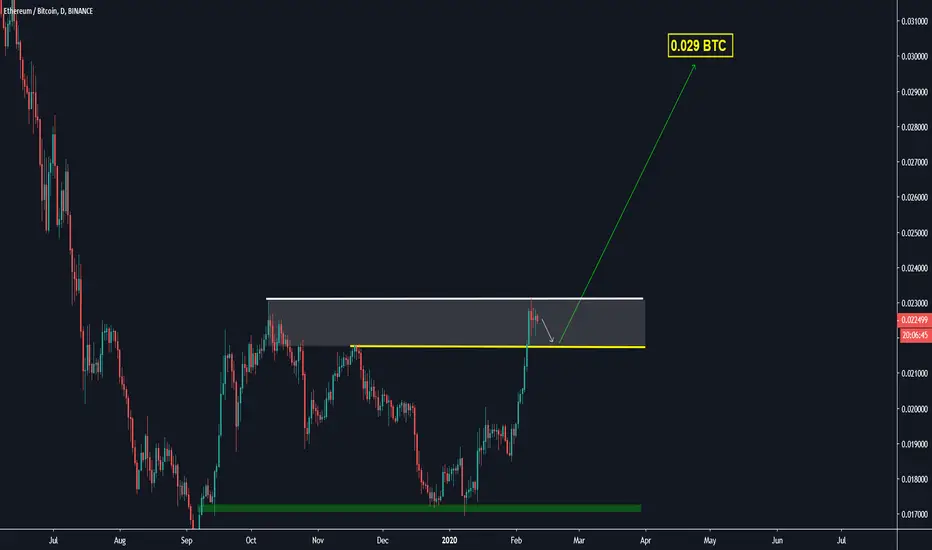
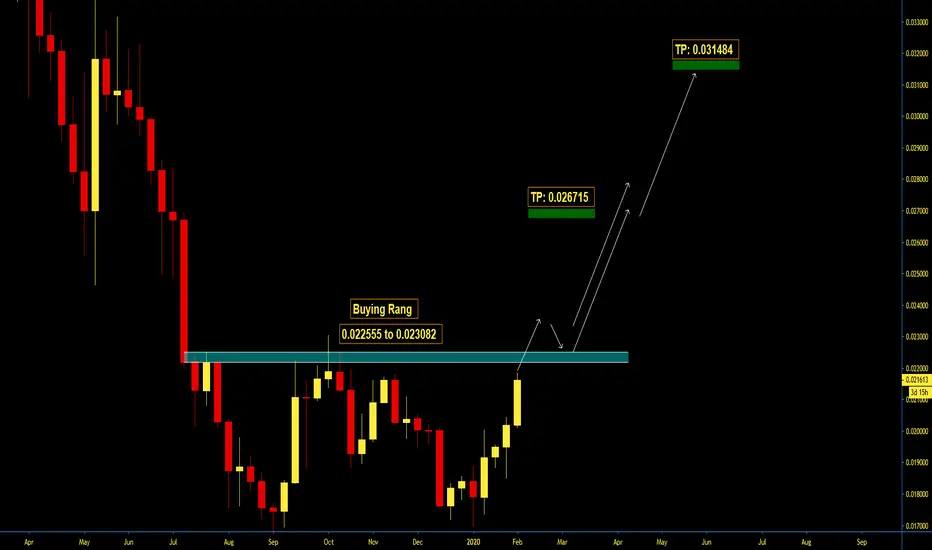
ETHBTC formed bullish Gartley | A good long opportunityPriceline of Ethereum / Bictoin has formed a bullish Gartley pattern and entered in potential reversal zone.
This PRZ area should be used as stop loss in case of complete candle stick closes below this area.
We have a strong support of 100 simple moving average beneath the PRZ level.
I have used Fibonacci sequence to set the targets:
Buy between: 0.021817 to 0.021624
Sell between: 0.021968 to 0.022332
Regards,
Atif Akbar (moon333)

Ethereum analysis: Daily Timeframe Chart Patterns and 3 Things YConclusion for today’s Ethereum technical analysis: Key support for Ethereum lies between 123.87 and 139.31. A break below 123.87 implies more selling ahead...
The Daily timeframe chart is used in today’s Ethereum analysis (log scale) to provide the alternatives for future price action.
The previous uptrend in Ethereum from December 2018 to June 2019 has been broken to the downside (i.e. confirmation or close of price outside of bullish channel) and price remaining in the current downtrend.
The following are 3 important ideas and/or areas to focus on for future development in Ethereum price.
(1) Current falling wedge chart pattern (tentative): The downside motion of price from the June 25, 2019 peak to current date is captured using a falling wedge (or falling diagonal).
Eventual resolution to the upside is anticipated i.e. a break above the upper boundary of the wedge. This therefore presents a foundation for considering long positions from a conservative point of view with risk: reward ratios calculated accordingly before attempting a long (bullish) trade.
(2) Action of the 200 Day and 50 moving average: The 50 day moving average did cross below the 200 day moving average on September 4, 2019. This implies bearish sentiment in Ethereum is still active and reduces the chance of bullish momentum developing. Price action at the minimum should therefore close above the 50 moving average before the potential for any bullish trade can be considered. Even better is a close above the 50 moving average and also its slope turning upwards.
(3) Support at 123.87 and 139.31: The support region is crucial for Ethereum and requires monitoring to see if price gives way to the downside or if there is consolidation at or close to the support region. The aforementioned support region also coinciding with the bottom of the falling wedge signifies the validity of the region as support.
A break below the lower boundary (123.87) reduces the chances of any bullish price swing developing and rather argues for more downside action in Ethereum. Momentum indicators can also provide additional guidance.
Above all, the best course of action is to wait to see what transpires before pulling the trigger (long or short).

Is ETH beacon of hope?
Ethereum is right now exchanging at the estimation of $172.47 and its worth is expanding by 0.91%. The market capitalization of the money is $18,707,468,198 and the 24-hour volume of the cash is $7,158,803,681. The flowing inventory of the money is 107,953,283 ETH and the ROI of the cash is 6,019.90%.
Recently has been intense for the money as it experienced a great deal of high points and low points in the market. The worth arrived at the low estimation of $167.00 at 21:00 UTC, nonetheless, the money recuperated the worth and accomplish the estimation of $169.56. Then again, the money likewise exchanged at the high estimation of $175.43 at 15:39 UTC yet it doesn’t remain there for long and esteem before long began diminishing and reach up to the $167. The money is consistently under bearish weight this week, it begins the week with the high estimation of $200 however the cash began exchanging under bearish weight.
News Source: TheCoinRepublic

Ethereum Technical Analysis: Bearish Momentum Slowing Down?Conclusion for today’s Ethereum Analysis: Price closing above ~204.18 implies higher Ethereum price.
Ethereum Analysis for today is provided on the 6 hour (intraday) timeframe that covers over 9 months of market action. The bullish channel in Ethereum that started in December 2018 and reached a price peak of 363.18 on June 26, 2019 is plotted on the chart.
A reversal candle marked the end of the channel with Ethereum selling off to not only test the lower boundary of the channel, but break and close below it. A falling wedge chart pattern is indicated on the chart to provide perspective for the meandering price action from the June 26, 2019 peak to date. The falling wedge is ideally bullish and implies price eventually breaking the upper boundary of the pattern and moving upwards.
The 200 moving average along with the 50 moving average both maintain a down trending slope which suggests that bearish force in Ethereum is still very active and therefore provides chances for more downside action. Any movement to the downside would be expected to test the lower boundary of the wedge and should not move past if any bullish momentum is to develop.
Alternatively, price moving past ~176.58 that goes on to break the upper boundary of the wedge (confirmation of pattern) should produce fresh bullish momentum in Ethereum.

ETH Bears Continue to Push ETH Price Down?In the ongoing fall of the Crypto advertise, Major Cryptos have declined in the exchange against USD. Ethereum has indicated major Bearish conduct from the previous week, Ethereum is positioned at #2 in the crypto showcase and has an all out inventory of 107,885,087 ETH. It has a net market top of $18,234,913,436 USD .
Ethereum is presently exchanging at $169.02 USD, and in the previous 24 hours, its volume is seen at $13,159,465,485 USD with a coursing supply of 107,885,087 ETH. Ethereum hit a record-breaking high of $1,432.88 USD on the thirteenth of January 2018, likewise its least worth was estimated at $0.420897 USD on the 21st of October 2015. In the previous day, Ethereum exchanged its most astounding at $203.50 USD and the least at $162.73 USD. As thought about today, Ethereum has diminished a sum of - 16.71%, which is $-33.73 USD.
News Source: TheCoinRepublic
