Not the end of the ups! #ETHUSD#EthereumThe Ethereum range from 228 support to 288 resistance, because we are very close to support we recommend Buy, according to the Stochastic the Ethereum has reached the bottom and the rallies on the way
Take profit: 288
Ethereumanalysis

Ethereum Price Analysis: 6 Hour Timeframe Chart PatternsConclusion for today’s Ethereum technical analysis: Price closing above ~325.30 implies further bullish strength in Ethereum.
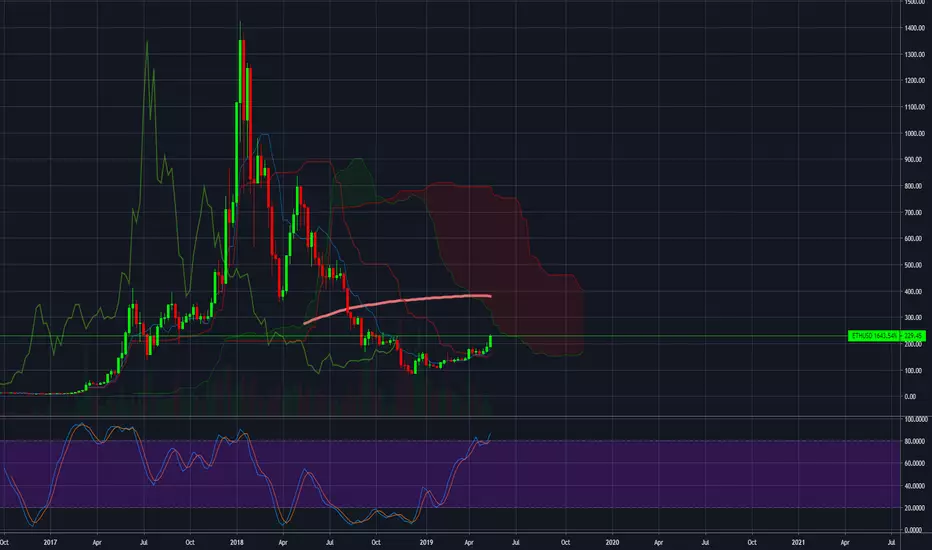
Ethereum analysis for today is presented on a 6 hour timeframe candlestick chart with major focus on the uptrend in Ethereum (ETHUSD) since December 15, 2018. Context is provided for price action ever since then using a bullish price channel.
Ellipses on the chart indicate price pivots used to draw the channel with the most recent pivot i.e. (148.88) occurring on April 25, 2019. The most recent peak in Ethereum achieved on May 16, 2019 at ~279 failed to test the upper boundary of the channel and is therefore a sign of weakness in bullish strength.
Also indicated close to the recent peak in price action for Ethereum is a pennant structure which is ideally a continuation pattern, and in this case, bullish. On the other hand, price closing below ~224.77 further decreases the chance of a bullish move and suggests the bottom of the channel at ~186.84 as the next target.
Trading Ethereum for a bullish (long) position(s) is considered most conservative if an order(s) is placed upon break above ~325.30. This ensures that price has successfully ejected from the bullish channel and also the pennant structure would have been confirmed.
Less conservative strategies would seek to buy as soon as pennant is confirmed by price closing above ~262.25 since the implication of the chart pattern in a continuation position is the resumption of the previous trend.
On the other hand, price closing below ~224.77 further decreases the chance of a bullish move and suggests the bottom of the channel at ~186.84 as the next target. 156.73 and 148.43 represents immediate support for Ethereum below the bullish channel and price closing below 148.43 indicates further bearish strength.

Ethereum Makes a Bullish crossover against BitcoinPast week has been quite crazy in terms of the crypto market with Bitcoin dominance rising, but now overall we see a trend of altcoins rising and this seems to be confirmed by the bullish cross over by Ethereum. The Bollinger bands suggest that ETH did hit the resistance line and then bounced back and has crossed the neutral line to the outer band. The RSI Indicator also is on the rise and is at 61 which confirms the Momentum.
The next target price seems to be 0.035 against BTC, but it wouldn't come without the necessary corrections in between as the ETCHBTC is hovering around 0.032.
Please note that the trade calls are the authors opinions based on technical analysis and hence readers are requested to do their own in depth study before investing.

Simple logic why we are on the way to 370 #EHT/USDIn recent years, Bitcoin has set the tone for all other currencies, including the Ethereum.
A few days ago, the Bitcoin began a big climb and after a few days, the rest of the cryptocurrency joined the party.
On the weekly chart of the Bitcoin we can see that the Bitcoin has already crossed the 100 moving average line and here too we believe that it will at least touch it and perhaps even cross it.
Therefore our signal is a buying signal with a target of 370.
A trading opportunity to buy in ETHUSDMidterm forecast:
While the price is above the support 162.650, beginning of uptrend is expected.
We make sure when the resistance at 264.800 breaks.
If the support at 162.650 is broken, the short-term forecast -beginning of uptrend- will be invalid.
Technical analysis:
While the RSI support #1 at 44 is not broken, the probability of price decrease would be too low.
A trough is formed in daily chart at 148.700 on 04/26/2019, so more gains maximum to Major Resistance (264.800) is expected.
Price is above WEMA21, if price drops more, this line can act as dynamic support against more losses.
Relative strength index (RSI) is 74.
Trading suggestion:
. There is a possibility of temporary retracement to suggested support zone (187.50 to 162.65). if so, traders can set orders based on Price Action and expect to reach short-term targets.
Beginning of entry zone (187.50)
Ending of entry zone (162.65)
Entry signal:
Signal to enter the market occurs when the price comes to "Buy zone" then forms one of the reversal patterns, whether "Bullish Engulfing" , "Hammer" or "Valley" in other words,
NO entry signal when the price comes to the zone BUT after any of the reversal patterns is formed in the zone.
To learn more about "Entry signal" and the special version of our "Price Action" strategy FOLLOW our lessons:
Take Profits:
TP1= @ 264.800
TP2= @ 309.100
TP3= @ 348.800
TP4= @ 393.550
TP5= @ 475.300
TP6= @ 534.700
TP7= @ 630.500
TP8= @ 822.550
TP9= @ 970.450
TP10= @ 1229.700
TP11= @ 1415.950
TP12= Free

Ethereum Technical Analysis: Next Bullish Target.... Conclusion for today’s Ethereum price analysis: Price closing above ~252 implies more bullish upside in Ethereum.
Ethereum chart provided for this analysis is a Daily timeframe candlestick chart that uses a logarithmic scale. Previous Ethereum analysis focused on the 6 hour timeframe and the chart pattern formations (tentative) to be aware of for future price development.
The main goal for today gives major consideration to the chart pattern developing on the Daily timeframe to understand the tendencies for price action. A rising wedge (diagonal) chart pattern is identified to provide context for Ethereum price from the low achieved on December 14, 2018 to current date.
The above mentioned chart pattern is ideally bearish. However, price trading currently between 192 and 194 at the upper boundary of the wedge implies a potential breakout to the upside and bullish momentum strengthening.
Of important notice also is 192.30, which is the lower boundary of horizontal resistance coinciding with the upper boundary of the wedge. A close above the aforementioned price level presents 252.84 as the next challenge for continuation of bullish momentum.
Buying on a breakout above 252.84 is thus considered a conservative strategy to go long (buy) Ethereum while buying prior to that is less conservative. Lastly, the Average Directional Index (ADX) shown at the bottom of the Daily timeframe Ethereum chart shows the ADX line with a positive rising slope with the +DI line well above –DI line.
This implies that current trend strength favors Ethereum bulls and prices should keep moving higher.
Price closing below ~148 and also the bottom of the wedge implies an increase in bearish strength that could lead to price closing below its December 14, 2018 low of ~80.96.

eth/usdt is ready to dump/short now !ethusdt is forming ascending triangle on week chart and price is at strong resistance just wait when price break the ascending triangle downward then take a short trade or exit from a buy trade it is giving good risk reward so you can go for it ;)
PLEASE LIKE THIS POST AND SHARE WITH YOUR FRIENDS .
FOLLOW ME FOR FUTURE ANALYSIS ON OTHER PAIRS :)
disclaimer : I could be wrong please take trade at your own risk .

Ethereum Price Analysis: 3 Crucial Chart Patterns to Keep in MinConclusion for today’s Ethereum Price Analysis: A break below 157.01 implies resumption of bearish strength in Ethereum with lower prices anticipated.
Ethereum analysis for today takes a look at the chart patterns that are currently active and/or tentative to help guide long (buy) or short (sell) decisions based on future development of price action. Ethereum chart presented is a 6 hour timeframe (log scale) with 3 main chart patterns for consideration that are discussed below.
These are the rising wedge (diagonal), bearish channel and bullish price channel.
The rising diagonal (wedge) pattern covers price action from 84.00 price low achieved on December 15, 2018 to the price peak established on April 08, 2019. The bearish implication of this pattern suggests that price will re-visit the December 15 (84.00) price low as a minimum expectation. The condition to satisfy the price swing above is a confirmation of the pattern via price closing below ~148.07.
A parallel line to the lower boundary of the rising diagonal is also highlighted to establish a tentative bullish channel in Ethereum (ETHUSD) that can be monitored going forward should bullish momentum pick up and be re-established. Confirmation of the channel can help provide the basis for future projection or forecast in Ethereum price.
Last but not the least is the current bearish price channel that is active. This implies that its width is highly invaluable to provide estimates or target for price action upon price breaking above or below the channel.
Price closing below ~147.01 suggests that bearish momentum has resumed that will at least take Ethereum price to the lower boundary of the wedge and even lower.

TIGER "WOOD" GO LONG ON ETHEREUM (ETHUSD - DAILY)ETH price holding above the $160 level, no further retracement.
Looking to fade sellers and enter about +/- $170, for a 2.4/1 Risk vs Reward
Upside to Take Profit at $210 with a trailing SL.
Looking for precise entry on the correction from $210. (long)
I think Tiger Wood go long....

Ethereum Price Analysis: Crucial Chart Patterns to Keep in Mind Conclusion for today’s Ethereum Analysis: A close above 187.45 is crucial for Ethereum to maintain its current bullish momentum from 84.00
Ethereum technical analysis for today is presented on the 6 hour time frame candlestick chart using a logarithmic scale. The only goal of using a chart pattern is to make profit. For this to happen, the most crucial aspect is in the early recognition of the potential pattern(s) that the market is presenting, a thorough understanding of their implications, and also projection.
The different chart patterns that formed from August 14, 2018 as part of the bearish move that terminated on December 15, 2018 are highlighted on the Ethereum chart. 84.00 marked the price low on December 15, 2018, after which price made its most recent peak at 187.98 on April 08, 2019. A rising wedge chart pattern is used to describe price action between the aforementioned dates.
A bullish price channel is another chart pattern that can be monitored as part of the future development of price action. The top boundary of the channel is drawn in dotted red lines, while its bottom (parallel line) is also the lower boundary of the wedge.
The bullish channel as drawn is tentative. A break above 187.98 increases the chance of Ethereum targeting the upper boundary of the bullish channel and eventual break above the channel itself can provide a guide for the minimum projection of price action.
The implication of the rising diagonal (wedge) pattern is ideally bearish and suggests that a sell off should ensue in the price of Ethereum with the minimum expectation being the origin of the chart pattern at ~ 84.00.

#Ethereum Next step!In this review, I would like to talk about some important things that can be seen in the Ethereum graph above.
Let's start from the beginning - I added 2 red lines that show solid support in the 81.33 area and resistance in the 167.60 area, that these words are written we are still within this range.
2 The red circles are located in two places where the Ethereum tried to break the resistance without success.
Yesterday we had another attempt to break the Ethereum price resistance that succeeded for a while and then became Star Candlestick, the definition of this candle is-"Small-bodied candles in the star position often suggest that market participants are becoming indecisive and that the strength of the current trend could be reversing" (according to Investopedia).
After analyzing all of the parameters mentioned above we recommend a sell signal as long as the Ether does not break the resistance.
Sell Ethereum:
Entry price: 161.30
Take profit: 102
Stop loss:180

Daily Bullish Signal $ETH #ETH #ETHUSDT $USDT #USDT (02-04)RED ARROW indicates the EXPECTED Time and Targets
Level Stoploss point up to maximize profit and reduce risk
I'm working all the time, even in Bearish Market

Ethereum technical analysis: Chart Pattern Breakout Conclusion for today's Ethereum analysis: A breakout above 168.40 implies further higher prices in Ethereum
Ethereum price analysis for today is examined on a logarithmic scale on the Daily timeframe. Coverage of price action is from September 12, 2018 to current date. Bullish trendline in Ethereum is drawn on the chart to highlight the current momentum ever since Ethereum sold off from ~$255.00 to $83.17.
168.40 indicates previous support for Ethereum that has presented resistance or selling point and therefore, change in polarity at the price level. A parallel line to the 168.40 price level is drawn across 104.42 to present a range bound movement in market action, with ellipses showing pivots used to establish the sideways movement in price.
March 5 to April 1 saw the price of Ethereum remain inside of an ascending triangle chart pattern with a breakout occurring today. The aforementioned chart pattern is ideally bullish and thus higher prices can be anticipated.
Conservative strategies for going long (buying) Ethereum involve waiting for price to breakout above $168.40. The width of the range bound price movement can also be used for projection of price upon breakout (above 168.40).

Sharks Are Homing In For Ethereum - ETHUSDThe near-term outlook of the Ethereum market has turned bearish following a quick dip below Key Level 1 at 135 that broke its near-term market structure. Though Vitalik is still clinging to that level for dear life, that tiny drop of blood he spilled into the calm waters is enough for the sharks to home in for the kill. It is just a matter of time before his skinny arms give up to exhaustion and let nature takes its course. That is when price pushes through Key Level 1 once more and decline further to test Key Level 2, a level where we anticipate a technical rebound to materialize.

Ethereum price analysis: Chart pattern for Intraday TradersConclusion for today’s Ethereum analysis: Price breaking above 168.40 confirms more bullish upside in the price of Ethereum.
Ethereum analysis for today is carried out on a 4 hour time frame with coverage of market action from November 7, 2018 to current date. Ethereum has managed to sustain a bullish price swing or trend (based on the current timeframe) ever since price hit a price low of 83.19 on December 15, 2018.
A range or sideways duration of price movement is observed and plotted on the chart between 168.40 and 104.42 with the former representing the upper boundary of the range and 104.42 the lower boundary. In addition, the bullish trend line from the December 15, 2018 price low is indicated on the chart and does provide an ascending triangle (ideally bullish) chart pattern when combined with the top of the range for the ranging environment.
A break the bullish trendline is bearish, and the December 15, 2018 price low of 83.19 is likely to be challenged should price refuse to hold at 104.42 on a break below the bullish trendline.
The most conservative, bullish Ethereum trade would seek to buy Ethereum on a breakout above 168.40, while less conservative options of entering a long (buy) position involves waiting for price to successfully test the 4 hour time frame bullish trendline or 104.42.

ETH rally or crashPlease take this analysis not too serious - but take in mind nevertheless.
As the most of the cryptocurrencies Ethereum has had a really bad time since beginning 2018. It has lost 94% from the high to the low. The lowest price on bitfinex was 82$. Todays price is at 134$.
Fundamentally it doesn´t look too bad for the token, the last hardfork (constantinople) has been realized in the second attempt. But still there are a couple of things to do, as the casper-protocol, if ETH want to have a prosperous future.
On the other hand, the ETHEREUM blockchain is one of the most known blockchain and has been implemented in various use cases, beeing the source of some other coins and tokens.
As Bitcoin is the most important coin, Ethereum is the most important token (blockchain); up to now.
So what´s the current situation for the token in technical analysis?
The token has had three periods of falling prices since january 2018.
The first and steepest from jan 15 2018 to april 07 2018.
The second from may 06 2018 to november 14 2018 - with an smaller angle.
And the third with a beginning september 22 2018 - overlapping the second period - and still going on. This third has an even smaller angle than the second one.
What will be the angle of the previous period? Negative or positive?
There are two scenarios in my opinion.
A) positive
The price falls back on the support (lower limit of the wedge), rebounding on this line and beginning a rally. This rally will lead the token out of the wedge and ends the long declining trend. Of course, some resistances are to be taken - as the upper limit of the wedge and some swing trend lines. After having crossed the fib retracement 23.6% at ~324$ Ethereum would enter the zone, which I named "land of the free".
B) negative
Ethereum loses more momentum and breaks out of the wedge to the bottom. The negative trend continues and with breaking the first support it gains even more dynamic. Perhaps the negative move ends on the first supportzone, which is a swing trend line that had some importance in 2017. Or it ends on the second supportzone, which also has been a swing trend line and was probably the starting point of the rally in 2017 (~ 50$). Below this support Ethereum would enter the zone, I named "Doom zone".
The most important coins and tokens are correlated. If Bitcoin resumes new terrain, Ether will do too and vice versa. Not 1 on 1, but nearly.
I hope my thoughts have been helpfully for your decisions.

Ethereum Technical Analysis for Swing TradersConclusion for today’s Ethereum price analysis: 168.40 is critical for the price of Ethereum and a breakout above the price level implies resumption of bullish momentum.
Ethereum analysis for today is carried out on the 6 hour timeframe using a logarithmic scale, and chart inspection is from September 12, 2018 to current date.
A range bound price movement is identified for Ethereum and drawn on the chart between 168.40 and 104.42. Of particular importance is the former price level (i.e. 168.40) as it was previously a support level for Ethereum back in September of 2018.
Same support price level presented resistance for price action in the week of January 02, 2019, and also again on January 24, 2019 as highlighted by the blue ellipses. The implication of the above is that the upper boundary of the range movement indicates a change in polarity and/or significance of the price level for Ethereum going forward.
Current bullish trend on the 6 hour timeframe chart from a price low of 84.00 on December 15, 2018 is also important to pay attention to as price breaking below improves the likelihood of testing the bottom of the price range at 104.42.
Retracement of price to 104.42 and consolidation that is confirmed by momentum presents a buying (long) opportunity in Ethereum. This strategy is considered less conservative than if price attempts a breakout above 168.40.

Ethereum Price Analysis: Limited Bearish Potential.Here's WhyEthereum technical analysis for today is carried out on a 1 hour timeframe that examines price action from December 07, 2018 to current date.
Bullish price swing in Ethereum from the December 15, 2018 low of 83.19 culminated in a top formation best described as a complex head and shoulders top pattern. Confirmation of the pattern came in ~151.22 on January 10, 2019 when price closed below the neckline of the aforementioned bearish pattern.
An ending wedge (ideally bullish) in red helps to capture price action close to support for Ethereum between 101.71 and 93.91.
A break below 93.91 implies further downside in the price of Ethereum.
On the other hand, price breaking out above the upper boundary of the ending wedge indicates the resumption of bullish momentum in Ethereum. 135.04 is used in this analysis as a more conservative price level for entry into a long (bullish) position compared to buying on an immediate breakout from the wedge.

Ethereum Price Analysis: Live Update
Conclusion for today’s Ethereum Analysis: Price breaking out above $167.10 can be used to initiate long (buy) position(s) provided momentum offers evidence.
Ethereum price analysis for today is presented on a logarithmic scale with the chart covering over 11 months of price action. Bearish trendline drawn on the chart is used to highlight the overall trend in price for the duration mentioned.
Important attention is drawn to ~$167.10 price level as it did offer support for price on September 11, 2018, but currently presents resistance, and hence retracement in price considering the bullish price swing from ~$81.96.
$167.10 and $134.33 is therefore considered in this analysis as the upper boundary and lower boundary respectively for resistance/overhead supply.
A conservative way to enter a long (buy) position(s) is on a breaking out above the upper boundary of resistance.

Megalodon Trading - Ethereum - Short Term BullMegalodon Pro+ Long Term Isolator is green on 1D. Pull backs on Megalodon Pro+ Short Term Isolator on 240 or 60 will bring a good trade for ETH/USD
--------------------------------------
Swing and day traders —> Look for 1D confirmation(green rectangle close) on Megalodon Pro+ Long Term Isolator. —> Look for 240 min & 60 min confirmation(green rectangle close) on Megalodon Pro+ Short Term Isolator.
1) Take the next red confirmation on the hourly if you believe the market state is bear.
2) Wait for daily confirmations(red rectangles) if you think market is more uppy.
Learn more about it on our website. Go to our TradingView profile for how to gain access.
--------------------------------------
MEGALODON PRO+ Long Term Isolator
Megalodon Pro+ is designed for longer term and shorter term investors.
Megalodon Pro+ is really simple to use.
Megalodon Pro+ combines 16 different back-tested indicators, that each have more than 66% win rate.
Megalodon Pro+ lets you turn on or off any setups that has been used for a better analysis.
Megalodon Pro+ works with any kind of market state, and any kind of asset.
Megalodon Pro+ can be used to set alarms as soon as a candle closes with a green or red bar.
Megalodon Pro+ has more features than any other indicator in the market, these features can also be turned off in the settings:
Looks for 12 different investing setups automatically and prints them out.
Shows 2 different viewing options: Setups View that shows how many bear or bull setups are currently formed, Isolator View that shows Megalodon Price, Volume and Momentum isolators.
Prints green or red bars for longer term signals.
--------------------------------------
MEGALODON PRO+ Long Term Isolator is designed for longer term and shorter term investors!
All you have to do is:
1- Apply it on any asset with 1Day time frame and combine it with 240minutes and 60 minutes Megalodon Pro+ Short Term Isolator.
2- Look for green bar confirmation on all isolators.
3- Define your stop losses.
4- Define your target before you enter.
5-Repeat
--------------------------------------
~Megalodon Trading~
Enlighten others

Ethereum creating Wave 5 little bullish !Hello guys this is ETHUSD 4 Hour Chart, currently Ethereum is on support zone & Elliott wave 4 and pullback from here will create wave 5.
After breaking resistances Ethereum retested the resistances as support by creating and following Elliot wave, so a bounce back will complete the wave 5

ETH/BTC Long Term Trend ViewHey all!
Haven't posted in ages so I thought why not post a chart again so here we are with ETH/BTC since that one is the most intriguing in my opinion.
The recent move down has nearly gotten exponential and now we are at a point of a old support level that has been tested two times that triggered a heavy bull trend but the market in which ETH finds itself is still bearish.
Even if ETH/BTC goes up it might be more beneficial to be in USD till the market turns around. ( If BTC/USD goes down but ETH/BTC goes up you gain more if you are in USD. )
Regardless lets take a look at the trends and how the next one might form.
To keep it simple and quick I have put all references towards trend finding in the chart for bearish and bullish cases.
Sideways has not been mentioned since you can't easily and accurately spot that until it happens ( hence why whipsaws exist ).
In short it looks like ETH/BTC's down trend is out of it's current pace and has stopped following the bearish momentum trend ( green arc ) which is a "bullish" indication since it got less bearish.
The green support line is the next support to keep a eye on if it does go lower. It is far from bullish, the current trend switched momentum which means that a reversal is possible but there are no signs of it yet but it is a indication for a mean reversion scenario which can whipsaw longs that get late to the party.
Some of the early signs are pointed out in the chart for later reference.
TLDR:
Bearish Market Influence
Bearish Trend
Momentum Trend switched
Support Level Coming Up
Mean Reversion
USD vs BTC vs ETH = USD is beneficial
ATR is the earliest bullish trend sign
Mean Reversion could end up with whipsaws
I hope this helped you and you liked reading this, if you have thoughts about ETH/BTC/USD share in the comments!
As Always,
Happy Hunting!
All information found here, including any ideas, opinions, views, predictions, forecasts, commentaries, suggestions, or stock/cryptocurrency picks, expressed or implied herein, are for informational, entertainment or educational purposes only and should not be construed as personal investment advice. These are not facts but my personal views and opinions.
I will not and cannot be held liable for any actions you take as a result of anything you read here.

ETH H4 RSI Bearish Divergence On the 4 Hour Chart of ETHUSD we have 2 bull and 2 bear target.
1st bull target is 270$
2nd bull Target is 298$
1st bear Target is 167$
2nd bear target is between 110$ - 90$
RSI is showing bearish divergence.
Most likely Ethereum will Break the Red Trend support, we should look at the trend support & Resistance 224.44$. 100 MA will also work as resistance on the 4 Hour Chart.
