Ethereum Builds Strength: Day Trading Blueprint🔥 ETH/USD — Ethereum Day-Trade Breakout Blueprint 🚀 | Bullish Momentum Setup 🔍
📌 Asset: ETH/USD — Ethereum vs U.S. Dollar
📈 Market Type: Crypto | DAY TRADE Blueprint
📖 Trade Plan — Bullish Breakout Structure
ETH is building strong upward momentum with clean higher-lows and tightening price compression. Buyers are stepping in across major crypto pairs, signaling strength in the broader market cycle.
🎯 Entry
Any price-level breakout entry depending on your execution style.
🛑 Stop Loss (Risk Management First)
This is Thief SL → @ 2760
Dear Ladies & Gentlemen (Thief OG’s), adjust your SL based on your OWN strategy and risk.
⚠️ I'm NOT recommending to use ONLY my SL — your money, your rules, your risk tolerance.
🏆 Target
Moving Average is acting as strong resistance + market is entering overbought zones + potential trap formation for late buyers.
Our TP Zone → @ 3000
⚠️ Dear Ladies & Gentlemen (Thief OG’s), TP is your personal choice.
You can take profits the way YOU manage risk.
🔗 Related Pairs to Watch (Correlation Radar)
Watching correlated pairs gives confirmation + early signals of ETH strength or weakness.
1️⃣ BTC/USD (Bitcoin) — King Maker
ETH usually follows BTC’s momentum.
If BTC shows bullish continuation + strong volume → ETH breakout becomes HIGHER probability.
If BTC stalls or rejects → ETH breakouts often fail or become fakeouts.
2️⃣ ETH/BTC — Relative Strength Pair
A rising ETH/BTC = Ethereum outperforming Bitcoin.
A falling ETH/BTC = ETH lagging → Breakouts weaken.
Key Significance: Shows where smart money is rotating.
3️⃣ NASDAQ 100 / US Tech Index ( NASDAQ:NDX / NASDAQ:QQQ )
ETH has high correlation with risk-on tech sentiment.
If US tech rallies → Crypto liquidity flows → ETH bullish pressure increases.
If tech sells off → Crypto often follows.
4️⃣ DXY — U.S. Dollar Index ( TVC:DXY )
Weak USD → Crypto strengthens (inverse correlation).
Strong USD → Crypto cooling or correcting.
Watching DXY helps understand global risk appetite.
5️⃣ SOL/USD, AVAX/USD, MATIC/USD — Layer-1 Competitive Coins
High performance in these alt L1s often triggers rotation flows into ETH.
When these pump together → ETH usually follows with momentum.
📊 Why These Correlations Matter
Crypto → Highly interconnected; no asset moves alone.
BTC controls trend direction.
TradFi indices & USD influence liquidity conditions.
ETH/BTC shows smart-money rotation.
Alt-L1s show risk appetite in the broader ecosystem.
Tracking these pairs = fewer fake breakouts + stronger conviction.
Ethereumbitcoin

LOOK OUT FOR ETHERUM HIGH PROBABILITY LONG SETUP SOON!!!🚨ETHER HIGH PROBABILITY BUY SETUP 🚨
* Here We Can See Clearly The Next Potential Moves For ETHUSD Coming Hours/Days.
* Keep Your Eyes Close On Your Trading Positions.
* Happy PIP Hunting Traders.
FXKILLA.

ETHEREUM/BITCOIN riseETH/BTC has broken above the trendline, closed the weekly candle above it, and backtested it. Now it's time for Ethereum to outperform. This is interesting for altcoins.

ETHUSD Momentum Building! MA Breakout Keeps Bulls in Control📘 **ETHUSD “Ethereum vs U.S. Dollar”
Crypto Market Opportunity Blueprint (DAY Trade)**
🚀 Plan Overview
A bullish continuation scenario is active following a clear Moving Average breakout and clean retest. This structure builds a favorable environment for controlled entries backed by momentum confirmation.
🎯 Entry
👉 You can enter at any price level once your personal confirmation aligns with the ongoing MA structure.
The breakout + retest provides the core framework.
🛡️ Stop Loss Strategy
📍 This is the Thief SL @ 3050 Dear Ladies & Gentleman (Thief OG’s)
Adjust your Stop Loss based on your own strategy, risk tolerance, and trade model.
⚠️ Place the SL only after the MA breakout confirmation, not before.
📝 Note:
Dear Ladies & Gentleman (Thief OG's) I am not recommending that you use only my SL. It’s your own choice; you can make money then take money at your own risk.
🎯 Target
The SuperTrend ATR line is acting as a strong resistance, and current conditions suggest:
📈 Overbought signals building
Trap zones developing
📌 Smart exit required
👉 Our target: 3600
📝 Note:
Dear Ladies & Gentleman (Thief OG’s) I am not recommending that you set only my TP. It’s your own choice; you can make money then take money at your own risk.
🔍 Related Pairs to Watch (Correlation & Key Notes)
1. BITSTAMP:BTCUSD (Bitcoin vs USD)
ETHBTC correlation remains high during MA-driven moves.
BTC’s trend strength often dictates crypto-wide volatility.
Strong BTC breakout boosts ETH’s bullish follow-through potential.
2. BINANCE:ETHBTC (Ethereum vs Bitcoin)
Great pair to measure Ethereum’s relative strength.
Rising ETHBTC = ETH outperforming BTC → supports the bullish ETHUSD narrative.
Useful for detecting early reversals before USD-pairs show it.
3. CRYPTOCAP:TOTAL2 (Altcoin Market Cap)
Represents overall altcoin strength excluding BTC.
If TOTAL2 breaks resistance with volume, ETH usually moves aggressively.
Helps confirm whether the market supports a broad-based ETH rally.
4. COINBASE:SOLUSD (Solana vs USD)
Competes for capital rotation with ETH.
When SOL pumps aggressively, ETH sometimes lags before catching momentum.
Watching SOL gives early hints of altcoin capital flow.
5. TVC:DXY (US Dollar Index)
Inverse correlation with major crypto assets.
Weak DXY = supportive environment for ETHUSD upside.
Strong DXY = caution for crypto longs.

ETH/USDT Bearish Roadmap: Structure + MA Break AligningAsset: ETH/USDT — “Ethereum vs Tether”
Market Context: Crypto Market | Swing Trade | Bearish Profit Pathway Setup
📉 Market Outlook: Bearish Plan Confirmed
Ethereum is displaying a bearish continuation structure, with price breaking below the Triangular Moving Average zone, signaling shifting momentum from buyers to sellers. Market structure is weakening, liquidity is building above the recent highs, and major supports remain untested below.
This creates a clean swing-trade opportunity for disciplined traders.
🎯 Trade Plan: Thief Layered Entry Strategy
The plan uses a layered sell-limit approach to capture premium retracement entries.
🧩 Sell-Limit Layers (Short Entry Zones):
1st Layer: 3200
2nd Layer: 3100
3rd Layer: 3000
(Traders may add additional layers depending on preference, liquidity, and volatility.)
Layering helps reduce emotional entry pressure and allows scaling into premium short zones rather than rushing into the move.
🛑 Stop-Loss: Structural SL @ 3300
This is the Thief SL reference level at 3300, positioned above structural liquidity.
Ladies & Gentlemen (Thief OG’s): adjust SL according to your own risk tolerance, capital, and strategy framework.
Risk is personal — protect your account.
🏆 Target Zone: 2700
The downside objective aligns with:
Strong support retest
Oversold region confluence
Trap-pattern breakdown
Correlation pressures across major crypto pairs
Ladies & Gentlemen (Thief OG’s): this is a community target reference — take profit based on your own comfort and risk appetite. Profit is profit.
🔍 Related Pairs to Watch (Correlation Insights)
1️⃣ BTC/USDT ( CRYPTOCAP:BTC )
Bitcoin leads crypto directional momentum.
ETH generally mirrors BTC swings with slightly slower volatility.
If BTC struggles to reclaim resistance zones, ETH downside probability strengthens.
2️⃣ ETH/BTC ( BINANCE:ETHBTC )
Key ratio indicating Ethereum’s strength vs Bitcoin.
ETHBTC downtrend continues → ETHUSD bearish continuation becomes more reliable.
3️⃣ SOL/USDT ( CRYPTOCAP:SOL )
Strong competitor in Layer-1 ecosystem.
SOL weakness often reflects broader market appetite decreasing → ETH follows.
4️⃣ TOTAL2 (Altcoin Market Cap)
Tracks overall strength of altcoins excluding BTC.
Breakdown in TOTAL2 = bearish environment = supports ETH downside targets.
Monitoring these pairs provides confirmation of:
Trend alignment
Market-wide weakness
Strength of bearish momentum
Liquidity flows across majors
✅ Final Notes
This setup is built for traders who prefer structured entries, disciplined layers, clear SL zones, and realistic targets.
Trade smart, manage risk, and follow your own strategy refinement.

ETH vs BTC- Sometimes when we look at markets, we get confused by all the noise, Trump and governments news, ETFs, FED, bans, SEC, FUD, FOMO, fake stories, and more.
- As a trader, you must always step back from news, view the trend from a distance, and filter out that noise.
--------------------------------------------------------------------------------------------------------
Trading Parts (Monthly TF) :
--------------------------------------------------------------------------------------------------------
- Look at the trend and indicators, that’s what you should focus on first. ETH reached its all-time high in November 2021, and then retested that same ATH level in August 2025.
- Now look at the RSI and MACD levels at that time... In 2021, the RSI was overbought and the MACD crossed downward.
- Alright, now compare with where we are today. The RSI is only halfway to the top (even though ETH has already reached $5K again), and the MACD just crossed upward a few months earlier.
--------------------------------------------------------------------------------------------------------
In my opinion, we’re not topped yet and ETH still low. They will always try to scare you out so they can buy your bags cheaper.
Keep your attention on the opportunities others can’t see.
Happy Tr4Ding !

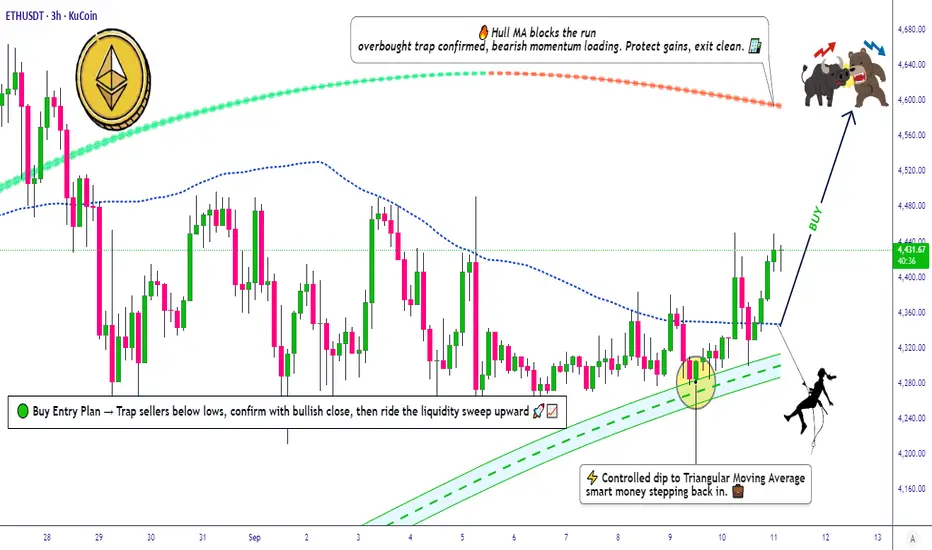
ETH/USDT Swing Trade | Heikin Ashi Confirmation + Pullback Plan🚀 ETH/USDT: The Great Crypto Heist — Swing/Day Trade Wealth Strategy! 🤑
Ladies and Gentlemen, welcome to the Thief’s Master Plan for ETH/USDT (Ethereum vs. Tether)! 🎩 This is a fun, professional, and calculated swing/day trade setup designed to catch the bullish wave while dodging the traps. Let’s break down this heist with style, precision, and a sprinkle of humor! 😎
📊 Asset: ETH/USDT (Ethereum vs. Tether)
Market: Crypto (High Volatility, High Reward!)
Strategy: Swing/Day Trade with a Thief’s Layered Entry approach
Vibe: Bullish, sneaky, and ready to outsmart the market! 🦹♂️
🧠 The Plan: Bullish Breakout with Technical Confirmation
✅ Bullish Confirmation: We’re riding the bullish wave with a Triangular Moving Average (TMA) pullback. This confirms the trend direction and filters out noise.
✅ Heikin Ashi Magic: A strong bullish Heikin Ashi candle signals momentum. Watch for smooth green candles to confirm the trend’s strength! 📈
🔑 Key Insight: The TMA pullback combined with Heikin Ashi gives us a high-probability setup for a breakout. Stay sharp, Thieves!
🚪 Entry: The Thief’s Layered Approach
🕵️♂️ Strategy: Use a layered entry (multiple buy limit orders) to scale into the trade like a true market bandit!
📍 Entry Levels:
Buy Limit @ $4250
Buy Limit @ $4300
Buy Limit @ $4350
Buy Limit @ $4400
💡 Pro Tip: Feel free to add more layers based on your risk appetite! Stack those orders like a master thief stacking loot. 💰
⚠️ Note: You can enter at any price level within this range if you spot momentum. The layered approach maximizes flexibility!
🛑 Stop Loss: The Thief’s Escape Route
🚨 Stop Loss: Set at $4150 to protect your loot.
⚠️ Thief’s Disclaimer: This is my suggested stop loss, but you’re the boss of your own heist! Adjust based on your risk tolerance. Don’t get caught by the market cops! 👮♂️
🎯 Target: Steal the Profits, Dodge the Trap!
🏦 Target Price: Aim for $4700 as our primary profit zone.
🚨 Resistance Alert: A police barricade (strong resistance) lurks around $4800. This level is overbought and a potential trap for greedy thieves. Cash out early to secure your gains!
💡 Pro Tip: Don’t get too greedy — take profits at your own discretion. The market is full of traps, so escape with your loot! 🏃♂️
👀 Related Pairs to Watch
Keep an eye on these correlated pairs to confirm market sentiment and strengthen your setup:
BTCUSDT ($): Bitcoin often leads the crypto market. If BTC is pumping, ETH is likely to follow. Watch for BTC breaking key resistance at $60,000 for added bullish confirmation.
ETHBTC: This pair shows ETH’s strength relative to BTC. A rising ETH/BTC ratio suggests ETH is outperforming, reinforcing our bullish bias.
SOLUSDT ($): Solana often moves in tandem with ETH. A breakout in SOL above $150 could signal broader altcoin strength.
Key Correlation: ETH’s price action is tightly linked to BTC and overall market sentiment. Monitor BTC’s trend and crypto market cap for context.
🔍 Key Points & Why This Setup Works
TMA Pullback: Acts as a dynamic support zone, ensuring we enter after a healthy retracement.
Heikin Ashi Confirmation: Filters out choppy price action, giving us clear bullish signals.
Layered Entries: Spreads risk and allows flexibility in volatile markets.
Risk Management: Tight stop loss at $4150 keeps the risk-reward ratio attractive.
Market Context: Crypto markets are volatile, but ETH’s bullish structure and correlation with BTC make this a high-probability trade.
📝 Thief’s Code: Risk Management
Dear Ladies and Gentlemen (Thief OGs), this is a fun strategy, but trading is serious business! 🕴️
Set your own stop loss and take profit based on your risk tolerance.
Never risk more than you can afford to lose — this is a heist, not a gamble!
Stay disciplined, and don’t let the market cops catch you off guard! 🚓
“If you find value in my analysis, a 👍 and 🚀 boost is much appreciated — it helps me share more setups with the community!”
Disclaimer: This is a Thief-Style trading strategy crafted for fun and educational purposes. Always do your own research and trade at your own risk. The market is a wild place — stay sharp, Thieves! 🦹♂️
#ETHUSDT #CryptoTrading #SwingTrading #DayTrading #ThiefStrategy #Bullish #TechnicalAnalysis #HeikinAshi #TradingView

EthereumETHUSD
- Bearish Channel as an corrective pattern in Short Time Frame
- Sell Side Liquidity
- Change of Characteristics
- Completed " 1234 " Impulsive Waves
- Order Block

ETH/USDT Technical Roadmap | Bullish Swing & Day Trade Levels📌 ETH/USDT "Ethereum vs Tether" Crypto Market Plan (Swing/Day Trade)
🔹 Plan: Bullish (Pending Order Breakout Plan)
We are preparing for a breakout setup around 10.000⚡ TRIANGULAR MOVING AVERAGE BUY PLAN.
Price action shows strong buyer strength with signs of institutional accumulation on dips.
🛠️ Thief Strategy (Layered Entry Style)
This strategy uses multiple limit orders (layering method) after breakout confirmation.
✅ Example buy limit layers (can be adjusted to your own risk):
4350
4370
4390
4420
👉 Please set a TradingView alert near the breakout level so you don’t miss confirmation.
🛑 Stop Loss (Risk Management)
📍 Suggested risk level: 4300 (after breakout confirmation)
This is the Thief SL reference point, but remember:
Adjust your SL based on your personal risk tolerance & strategy.
🎯 Target (Profit Zone)
Price may face resistance near moving averages with possible overbought traps.
📍 Planned exit zone: 4600
Manage your own TP — use targets that fit your risk/reward ratio.
🔗 Related Pairs to Watch
BINANCE:BTCUSDT – Bitcoin breakout strength often leads ETH moves.
BINANCE:ETHBTC – Key ratio showing ETH’s relative strength vs BTC.
BINANCE:SOLUSDT – High-beta crypto that often correlates with ETH sentiment.
BINANCE:BNBUSDT – Another major altcoin for cross-market momentum comparison.
✨ “If you find value in my analysis, a 👍 and 🚀 boost is much appreciated — it helps me share more setups with the community!”
#ETH #ETHUSDT #Ethereum #Crypto #SwingTrade #DayTrade #BreakoutStrategy #LayeredEntries #CryptoTrading #TradingPlan
ETHBTC vs BTC.DEthereum / Bitcoin 📈 Bitcoin Dominance 📉
CRYPTOCAP:ETH / CRYPTOCAP:BTC vs. CRYPTOCAP:BTC.D

ETH/USDT Price Action Analysis — Bullish Continuation Expected 📊 ETH/USDT Price Action Analysis — Bullish Continuation Expected 🚀
🔍 Chart Overview (as of June 9, 2025):
This chart of ETH/USDT highlights a well-defined support and resistance structure, projecting a potential bullish move toward a main resistance target at $2,788.00.
🧱 Key Zones:
🔵 Support Zone: $2,440 – $2,480
Price rebounded strongly from this area, showing buyer interest and liquidity absorption.
🟠 Resistance Zone: $2,660 – $2,690
Previously rejected zone where supply overtook demand. Price must break and hold above this for further upside.
🔺 Main Resistance Target: $2,788.00
If resistance is cleared, this is the next major supply area, acting as a potential take-profit level.
📈 Price Action Insight:
Price is currently hovering near $2,538.37, approaching resistance.
The chart suggests a potential breakout scenario after a short consolidation.
A bullish breakout above $2,690 could trigger a sharp rally toward the $2,788 target.
The chart projects a pullback-retest pattern (break, retest, and continuation) before the final leg up.
⚠️ Risk Management:
Invalidation Level: $2,381.49
A break below this level would invalidate the bullish setup and could lead to further downside.
✅ Summary:
Bias: Bullish 📈
Entry Area: Break and retest above resistance zone ($2,660–2,690) 🔓
Target: $2,788 🎯
Invalidation: Below $2,381.49 🚫
📌 Note: Always use proper risk management and confirm breakouts with volume or momentum indicators (e.g., RSI, MACD).

Ethereum vs. Bitcoin (3D)This analysis is an update of the analysis you see in the "Related publications" section
We have slightly updated the Demand zone.
Ethereum has reached a strong support zone compared to Bitcoin. From this green zone, we expect a bullish move towards the red zone. This indicates that in the coming weeks and months, Ethereum is likely to outperform Bitcoin.
These zones should not be ignored. Ignoring these high-timeframe support zones would be a critical mistake.
For risk management, please don't forget stop loss and capital management
Comment if you have any questions
Thank You

ETHEREUMUSDT | Risky Hedge ShortIn our previous ETHUSDT analysis, we mentioned the importance of the $4102 level and the possibility that our rapid entry into the range with its manipulation could lead to bad possibilities.
The price has entered the range again and continues to fall, but it is not nice that the liquidity remaining above is very open. Still, taking a short hedge is not a bad trade by taking the possibility of a losing 1R from here.
I keep my charts clean and simple because I believe clarity leads to better decisions.
My approach is built on years of experience and a solid track record. I don’t claim to know it all, but I’m confident in my ability to spot high-probability setups.
My Previous Analysis
🐶 DOGEUSDT.P: Next Move
🎨 RENDERUSDT.P: Opportunity of the Month
💎 ETHUSDT.P: Where to Retrace
🟢 BNBUSDT.P: Potential Surge
📊 BTC Dominance: Reaction Zone
🌊 WAVESUSDT.P: Demand Zone Potential
🟣 UNIUSDT.P: Long-Term Trade
🔵 XRPUSDT.P: Entry Zones
🔗 LINKUSDT.P: Follow The River
📈 BTCUSDT.P: Two Key Demand Zones
🟩 POLUSDT: Bullish Momentum
🌟 PENDLEUSDT.P: Where Opportunity Meets Precision
🔥 BTCUSDT.P: Liquidation of Highly Leveraged Longs
🌊 SOLUSDT.P: SOL's Dip - Your Opportunity
🐸 1000PEPEUSDT.P: Prime Bounce Zone Unlocked
🚀 ETHUSDT.P: Set to Explode - Don't Miss This Game Changer
🤖 IQUSDT: Smart Plan
⚡️ PONDUSDT: A Trade Not Taken Is Better Than a Losing One
💼 STMXUSDT: 2 Buying Areas
🐢 TURBOUSDT: Buy Zones and Buyer Presence
🌍 ICPUSDT.P: Massive Upside Potential | Check the Trade Update For Seeing Results
🟠 IDEXUSDT: Spot Buy Area | %26 Profit if You Trade with MSB
📌 USUALUSDT: Buyers Are Active

ETH/USD "ETHEREUM" Crypto Market Heist Plan on Bullish SideHi there! Dear Money Makers & Robbers, 🤑 💰
Based on Thief Trading style technical analysis, here is our master plan to heist the ETH/USD "ETHEREUM" Cryptocurrency market. Please adhere to the strategy I've outlined in the chart, which emphasizes long entry. Our aim is the high-risk Red Zone. Risky level, overbought market, consolidation, trend reversal, trap at the level where traders and bearish robbers are stronger. So Be Careful, wealthy and safe trade.
Entry 📈: Acceptable anywhere; I advise placing buy limit orders within a 15-minute Chart. The entry for the Recent/Nearest Low Point should be in pullback.
Stop Loss 🛑: Using the 4H period, the recent swing low
Goal 🎯: 4600.0
Scalpers, take note: only scalp on the long side. If you have a lot of money, you can go straight away; if not, you can join swing traders and carry out the robbery plan. Use trailing SL to safeguard your money 💰.
Warning : Our heist strategy is incompatible with Fundamental Analysis news 📰 🗞️. We'll wreck our plan by smashing the Stop Loss 🚫🚏. Avoid entering the market right after the news release.
Take advantage of the target and get away 🎯 Swing Traders Please reserve the half amount of money and watch for the next dynamic level or order block breakout. Once it is resolved, we can go on to the next new target in our heist plan.
💖Supporting our robbery plan will enable us to effortlessly make and steal money 💰💵 Tell your friends and family to follow, like, and share. Boost the strength of our robbery team. Every day in this market make money with ease by using the Thief Trading Style.
I'll see you soon with another heist plan, so stay tuned 🫂

ETHBTC To the Moon ScenarioScenario: Macro Cup & Handle plays out...
This assumes the crypto market becomes bullish again and we get that final leg up in the bull market. ETH will become the strongest altcoin ever EOY.

ETH will push to demand zoneEthereum will push to demand zone soon around 2800-2850$.
Then we have a fuel to run to 4000$ in first push.
Then 5200$.
Be ready and don't get shaken out.
PS: Don't worry, ethereum is not dead. Many L1 altcoins are sleeping right now for example AVAX and BNB.

$ETHBTC x $BTC.D#Altseason is inevitable!
CRYPTOCAP:BTC.D ➡️📉 BINANCE:ETHBTC ➡️📈
#Ethereum is undeniably a major leading force and a major indicator for #Alts .
#Bitcoin dominance is at major resistance level while BINANCE:ETHBTC is rejected at major support level and is poised for an epic comeback!

$ETH is weakening against $BTC in LTF?#eth / #btc pair rallied in last 2 months period and needs to rest i think. A bearish divergence is formed in #ethereum against #bitcoin chart. Retrace to red box is necessary. Breaking up the channel with huge volume is the invalidation of divergence. Not financial advice.

$ETHBTC chart's falling channel#ethereum against #bitcoin chart, #ETHBTC has reached top of the channel before ETF approval. Volatility will be insane.

ETHUSDPair : ETHUSD ( Ethereum / U.S Dollar )
Description :
Completed " 1234 " Impulsive Waves and Rejecting from Daily Demand Zone or Fibonacci Level - 38.20%. Break of Structure and Completed the Retracement. Break out of Upper Trend Line of Consolidation Phase to make Fake Breakout. Strong Divergence in RSI

ETHBTC looking strong and ready to rallySince BTC topped around 31k, ETH has outperformed BTC. It looks like ETH is slowly gaining more and more, as more ETH is being slowly burned through EIP-1559 and more ETH is being staked. As ETH outflows since the Shapella upgrade have peaked and inflows are dominating, ETH now has a yield of about 5%; ETH looks more attractive than BTC.
Of course, BTC has its upcoming halving less than a year from now, and recently Ordinals have given Bitcoin new life. As gold was rallying, the digital gold narrative was also more robust. However, Ethereum has seen its Layer 2 protocols gain more and more traction while AI stocks are pumping like crazy and gold is dumping. Essentially flexible tech is preferred to stable and inert metals.
ETHBTC has almost completed a breakout, as it hasn't fully reclaimed all key diagonals and the yearly pivot. It has reclaimed all critical support, penetrated the 0.06-0.066 area, which I was expecting to happen for a while, and is now looking solid.
Someone could go long now, with a stop loss below 0.064 or waiting for the full breakout. Someone could wait before going long for BTCUSD and ETHUSD to have a failed breakdown by hitting 25700$ and 1720$, respectively.

ETHBTC: targeting the top of the Channel Down.ETHBTC is consolidating right now on neutral 1D technicals (RSI = 55.810, MACD = 0.001, ADX = 53.149) supported by the HL trendline. A bounce on the 1D MA50 would be ideal for a new buy, but if it breaks the trend turns bearish. Until it does, we are bullish, targeting the 0.9 Fibonacci (TP = 0.07200) as it happend on January 2023. But of those where the bullish waves inside a long term Channel Down.
## If you like our free content follow our profile to get more daily ideas. ##
## Comments and likes are greatly appreciated. ##

ETHBTC Bullish Cross completed on 1W. Rally ahead.The ETHBTC pair has been trading inside a Triangle pattern for almost a year (since the June 13 2022 Low). For the past 3 weeks the 1D MA50 (blue trend-line) has been supporting while the 1D MA200 (orange trend-line) has been the Resistance since January 21 as the price has failed to close a 1D candle above it (having 3 clear rejections on it).
The key difference here is the formation of a Bullish Cross on the 1W MACD. In the past 12 months, this has always been a Buy Signal. We are buying and targeting the 1D MA200, and if it closes a 1D candle above the 1D MA200, we will extend buying towards the 0.618 Fibonacci level.
-------------------------------------------------------------------------------
** Please LIKE 👍, FOLLOW ✅, SHARE 🙌 and COMMENT ✍ if you enjoy this idea! Also share your ideas and charts in the comments section below! **
-------------------------------------------------------------------------------
💸💸💸💸💸💸
👇 👇 👇 👇 👇 👇
