ETHUSD forming a bullish gartley | A good long opportunityPriceline of Ethereum / US Dollar is forming a bullish gartley and soon it will be entered in potential reversal zone insha Allah.
We have a golden cross formation expected below the PRZ are between 100 simple moving average and 200SMA.
I have used Fibonacci sequence to set the targets:
Buy between: 180.27 to 178.55
Sell between: 181.61 to 184.85
Regards,
Atif Akbar (moon333)
Ethereumdollar

ETHUSD formed Crab and entered in potential reversal zonePriceline of Ethereum / US Dollar cryptocurrency has formed a bullish Crab pattern and entered in potential reversal zone to hit the sell targets soon insha Allah.
MACD is strong bullish
Stochastic is oversold and has given bull cross
RSI is coming out form oversold zone
Volume profile of complete pattern is showing less interest of traders at this area
The potential reversal zone can be used as stop loss in case the complete candle stick closes below the PRZ area.
I have used Fibonacci sequence to set the targets:
Buy between: 188.92 to 141.16
Sell between: 226.21 to 317.04
Regards,
Atif Akbar (moon333)

ETHUSD formed bullish BAT | A good long opportunityPriceline of Ethereum / US Dollar cryptocurrency has formed a bullish BAT pattern and entered in potential reversal zone.
I have defined the targets using Fibonacci sequence:
Buy between: 175.64 to 174.67
Sell between: 177.96 to 181.45
Regards,
Atif Akbar (moon333)

ETHUSD formed bullish butterfly | Upto 24% possiblePriceline of Ethereum / US Dollar cryptocurrency has formed a bullish butterfly and entering in potential reversal zone.
I have defined targets using Fibonacci as below:
Buy between: 166.18 to 155.82
Sell between: 174.15 to 193.91
Regards,
Atif Akbar (moon333)

now we got confirmation to buy ether !!take action fast as possible we have very secure stop loss
good luck join our team soon !!
#bank trader

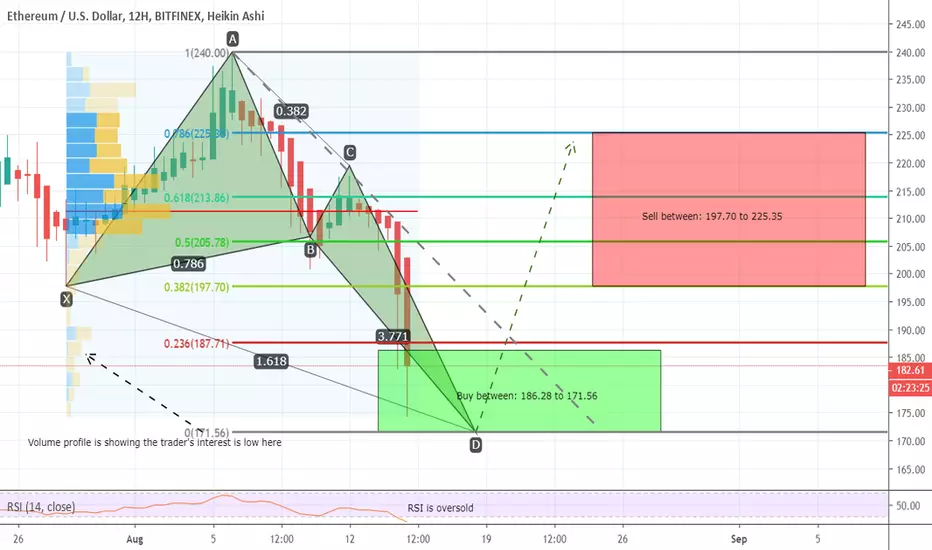
ETHUSD has formed bullish butterfly | Upto 31% profit potentialPriceline of Ethereum / US Dollar has formed a bullish butterfly and entered in potential reversal zone.
RSI is oversold.
Volume profile of complete pattern is showing less interest of traders at PRZ area.
I have usded Fibonacci sequence to set the targets and those targets are as below:
Buy between: 186.28 to 171.56
Sell between: 197.70 to 225.35
The MACD is strong bearish therefore I would suggest to take long position after when atleast 6hr MACD's histogram gives weak bearish signals.
Regards,
Atif Akbar (moon333)
btcusd will go up as we mentioned but ether goes down !!very good point to enter sell with low risk high reward
good luck ,

we found it good to take action ether usd in bank level buy zone ,
hopefully reach our target soon
good luck

ETHUSD Ethereum Bearflag Trading SidewaysEthereum USD is in a Bearflag realyl just trading sideways right now look for the breakouts to buy!

Ethereum - $230 Top or New Bull Run ?Using the Fib Retracement tool on the Ethereum charts gives us a good perspective on the meaning price points and reactions.
In the following representation , we have a slow breakout scenario with a market finding continuous support and weak bearish energies.
Currently we are support by the previous trending resistance line and finding heavy resistance at $230 which seems to be our next target if the support line won't break.
$230 is also 0.236 pattern line with meaningful previous movements and radical activity.
Feel to check out my profile for other educational content and private coaching.
Thank you
Scrembo

ETHEREUM has completed cypher | 64% expectedThe priceline of Ethereum / U.S Dollar Cryptocurrency has formed cypher pattern.
The price action is entered in potential reversal zone and we has 50 simple moving average and 100 SMA supports in PRZ area.
The MACD is turning bullish.
Stochastic is oversold.
From here the price action can move up to hit the sell targets soon insha Allah.
The targets are set using Fibonacci sequence.
The targets are:
Buy between: 224.73 to 191.33
Sell between: 251.00 to 314.20
Regards,
Atif Akbar (moon333)


ETHEREUM $850??Hey Everyone!
was just going through charts and updating, and noticed ETH is in one of my favourite patterns to trade! Reason being it is not only supported by the PARABOLA, the cup pattern is usually a good indicator of higher prices to come!
As I explained previously in ADA USDT chart, which has so far only had a fake out and dropped back into the handle for support.
ETH pattern shows that the current movement should achieve just under the $500 mark and with some added FOMO push us over the line!
Currently I think ETH will have a minor drop here to retest the parabola before taking off.
The CUP AND HANDLE is one of the easiest patterns to recognize and usually quite reliable. Remember no trade goes the way you want it to go 100% of the time - and that is why MONEY MANAGEMENT is essential to make money over a period of time. If you are winning an average of 50% of your trades with strict money management, you are going to win the marathon!
REMEMBER IF YOU ARE PRACTICING SAFE... TRADING ALWAYS USE PROTECTION
(minimize your risk, use a stop loss. Especially in Margin Trades) ALWAYS!!!!!!!!!!!!!!!!!!!
<3 Lisa
DISCLAIMER:
The Legal stuff - I'm not financial adviser. Just a few quick thoughts - remember you sit at your computer, you push the buttons...
PS make sure you give me a like, that way you get updates as I post them.... :) <3

refresh our ether forecast again we check bank levels now we decide to update it its our last view on this chart
good luck
ether still downtrend here is our view about ether bank levels i hope you enjoy and bank profit
good luck

ETH/BTC IS READY FOR NEW HIGHS! *DON'T MISS OUT*As you can see from the split chart, we have an inverted scale of Bitcoin Dominance %, and on the right we have Ethereum/Bitcoin chart showing an amazing setup with multiple bullish divergences presented on the Relative Strength index & a clear cyclical bottom.
Ethereum is showing that we've just finished final sell-off before entering into an accelerated advancement where we will then see new highs for not only the BTC pair, but also the USD pair as well.
BTC dominance will move in opposition to ETH/BTC, I have the charts scale on the left inverted for easier viewing & comprehension!
Happy Trading!

BSVUSD LongHey Guys, BSV looks like it might be ready to take off towards the 300 usd mark,
although there remains a possible visit back to the recent lows if we can't break here
steemit.com
www.twitch.tv
www.facebook.com


WHY ETHEREUM IS HOLDING THIS REGION! Hey Everyone,
A few weeks back I gave you a chart with some higher targets for ETH , this chart is pretty self explanatory and simple. No ELLIOTT WAVE, NO FANCY JARGON, just a few support regions that will hold in order to move us higher!
Now I want to show you the hidden resistance (similar to my BTC chart)
In 2017 we saw the All Time High for many coins and tokens and this rise and subsequent fall has created numerous support regions with strength due to the parabolic movement and decline of the patterns. On ETH we see 3 strong support regions cross and form an almost unbreakable support zone, (where we are right now) something catastrophic would need to happen for this to break, and at this present time, it is looking really good for ETH to reach the $350.00 and beyond targets.
REMEMBER IF YOU ARE PRACTICING SAFE... TRADING ALWAYS USE PROTECTION
(minimize your risk, use a stop loss. Especially in Margin Trades) ALWAYS!!!!!!!!!!!!!!!!!!!
<3 Lisa
DISCLAIMER:
The Legal stuff - I'm not financial adviser. Just a few quick thoughts - remember you sit at your computer, you push the buttons...
PS make sure you give me a like, that way you get updates as I post them.... :) <3

Ethereum Bullish Continuation?Welcome back!
Today we will be taking a look at Eth to decide where we can go from here.
There is a couple options I am watching both bullish and bearish.
Let's jump right into it!
From sub $200 Eth rallied and broke up to $280 before we had our eventual retrace.
Prices now are consolidating in what looks to be a symmetrical triangle.
Symetrical triangles are 50-50 bullish and bearish so this is showing indecision inside the market.
What we need to see is a positive bull break out of this resistance before we can except to see continuation.
Whether we breakout or not is Dependant on BTC.
Based off my analysis it looks like were will get one more drop to our trend line before we see either side impulse the market.
If we break lower, expect a retrace to around $200 or our 200MA.
From an Elliott Wave perspective it appears we are consolidating before our final wave 5x3x3.
Once this impulse is over that will complete wave 3x3 before we start the final 5x3 to complete wave 3 entirely.
Overall this looks more bullish than bearish but it depends on what BTC decides to do.
Overall count has us completed wave 1 with current prices finishing out wave 3x3.


A trading opportunity to buy in ETHUSDMidterm forecast:
While the price is above the support 162.650, beginning of uptrend is expected.
We make sure when the resistance at 264.800 breaks.
If the support at 162.650 is broken, the short-term forecast -beginning of uptrend- will be invalid.
Technical analysis:
While the RSI support #1 at 44 is not broken, the probability of price decrease would be too low.
A trough is formed in daily chart at 148.700 on 04/26/2019, so more gains maximum to Major Resistance (264.800) is expected.
Price is above WEMA21, if price drops more, this line can act as dynamic support against more losses.
Relative strength index (RSI) is 74.
Trading suggestion:
. There is a possibility of temporary retracement to suggested support zone (187.50 to 162.65). if so, traders can set orders based on Price Action and expect to reach short-term targets.
Beginning of entry zone (187.50)
Ending of entry zone (162.65)
Entry signal:
Signal to enter the market occurs when the price comes to "Buy zone" then forms one of the reversal patterns, whether "Bullish Engulfing" , "Hammer" or "Valley" in other words,
NO entry signal when the price comes to the zone BUT after any of the reversal patterns is formed in the zone.
To learn more about "Entry signal" and the special version of our "Price Action" strategy FOLLOW our lessons:
Take Profits:
TP1= @ 264.800
TP2= @ 309.100
TP3= @ 348.800
TP4= @ 393.550
TP5= @ 475.300
TP6= @ 534.700
TP7= @ 630.500
TP8= @ 822.550
TP9= @ 970.450
TP10= @ 1229.700
TP11= @ 1415.950
TP12= Free
