ETHEREUM'S NEXT STEPS...This is just technical analysis. Do not follow this trade blindly!
Hi fellow traders!
ETHUSD is currently 3.19% up from yesterday in terms of market price, seeing a surge over the past 24 hours.
So, is it now time for a pullback, or to try and break through all-time highs?
Personally, looking at ETH from a technical stance, it is currently in a parallel channel, where I believe we will see it float about rising till we look to hit around its first daily resistance region, which is around $177.00.
This could occur in 2 ways, so I will go through both specifically.
Scenario 1: (WHITE ARROWS)
Considering this pair from the 4H chart (although the 1H is posted on this trade analysis), there looks like there is time to see some bullish price action, so we could see a bounce towards the resistance region of $177.00, and then a consequent sell-off as this resistance region has been a strong barrier for the bulls from the 11/04/2019. This could mean a pullback, as forecasted from the 1D chart towards the $165.25 support region.
Scenario 2: (GREEN ARROWS)
On the 1H, there appears to be a bullish hammer printed on the chart. This will pave way for bullish price action, but there is more to think about. The 1H support level drawn in a yellow box has acted as support of the past couple of hours, and I think there is a possibility that in the next few hours, this could break as it is retested. This could give way for a tap of the support line on the parallel channel drawn in blue lines, before seeing a tap to the upside.
In the end, we are looking for an upside push!
The main targets of this trades are as follows:
First Upside Target: AROUND $177.00
Consequent Main Downside Target: AROUND $165.25
If you managed to read it this far down, thanks for reading this! If you could, please do offer your ideas & perspectives on this pair. Buy or Sell and why? Additionally, drop me your charts for it, that'd be great so I can see where you are coming from. I'm a new guy to the FX & Crypto market, trying to learn FX & Crypto, and I'd appreciate any help people may offer!
Please drop a follow! I need reputation points!!
Ethereumdollar

Ethereum Price TargetsWelcome Back!
My last Ethereum post was a bearish continuation update however, based off accumulation we invalidated that count.
Eth continues to look more and more bullish and I expect it to jump nicely and outperform Bitcoin in the coming months.
Based off my analysis we have hit a very decisive point in the current market structure moving forward. For over a month we have been accumulating inside an ascending triangle which we have just broken out of. Currently prices are working on the retest of resistance which is now acting as support. I expect some nice upside to follow over the next few months.
My target moving forward is $350. Short term target is $240.


TIGER "WOOD" GO LONG ON ETHEREUM (ETHUSD - DAILY)ETH price holding above the $160 level, no further retracement.
Looking to fade sellers and enter about +/- $170, for a 2.4/1 Risk vs Reward
Upside to Take Profit at $210 with a trailing SL.
Looking for precise entry on the correction from $210. (long)
I think Tiger Wood go long....

A trading opportunity to buy in ETHUSDMidterm forecast:
While the price is above the support 80.350, beginning of uptrend is expected.
We make sure when the resistance at 200.000 breaks.
If the support at 80.350 is broken, the short-term forecast -beginning of uptrend- will be invalid.
Technical analysis:
While the RSI uptrend #1 is not broken, bullish wave in price would continue.
A peak is formed in daily chart at 180.000 on 04/03/2019, so more losses to support(s) 162.650, 136.500, 99.900 and minimum to Major Support (80.350) is expected.
Price is above WEMA21, if price drops more, this line can act as dynamic support against more losses.
Relative strength index (RSI) is 73.
Trade Setup:
We opened 12 BUY trade(s) @ 206.43 based on 'Valley' entry method at 2018.09.13.
Total Profit: -32628 pip
Closed trade(s): 0 pip Profit
Open trade(s): -32628 pip Profit
Open Profit:
Profit for one trade is 179.24(current price) - 206.43(open price) = -2719 pip
12 trade(s) still open, therefore total profit for open trade(s) is -2719 x 12 = -32628 pip
New Trading suggestion:
.Price is in the support zone (187.50 to 162.65), traders can set orders based on Daily-Trading-Opportunities and expect to reach short-term targets.
Beginning of entry zone (187.50)
Ending of entry zone (162.65)
Entry signal:
Signal to enter the market occurs when the price comes to " Buy zone " then forms one of the reversal patterns, whether " Bullish Engulfing ", " Hammer " or " Valley " in other words,
NO entry signal when the price comes to the zone BUT after any of the reversal patterns is formed in the zone.
To learn more about " Entry signal " and the special version of our " Price Action " strategy FOLLOW our lessons:
Take Profits:
TP1= @ 264.800
TP2= @ 309.100
TP3= @ 348.800
TP4= @ 393.550
TP5= @ 475.300
TP6= @ 534.700
TP7= @ 630.500
TP8= @ 822.550
TP9= @ 970.450
TP10= @ 1229.700
TP11= @ 1415.950


Ethereum - ETHUSD // Longterm OutlookCurrent Outlook
Bullish
I am Bullish as of now within the Crypto Markets. As we can see via our charts we are at resistance for the 3rd time. We have a Daily Demand within the bottom of our Trend Line @ $136 for buys.
Confluence -
- Third attempt @ Resistance.
- Supply Block @ $199 likely to be touched soon.
- We want to see $199 reject & allow our Daily S/R level to hold as SUPPORT from now on.
- This S/R flip will push us above this Supply Pivot and thus form it into Demand.
- Demand Pivot shift will signal a shift in market structure to the bullish side. We can project targets of $400-$460 if this scenario occurs.
- Telegram // Twitter

Ethereum - mid term overviewHi guys! Ethereum as other major cryptocurrencies is in decision phase where to go next days. In my opionion it's only about how the price finish consolidation phase before final capitulation. I expect short term more sideways (120-140 range) or final strong push to the upside to retest 200 heavy resistance (bull trap). Mid term still looking weak with potential 50 USD/ETH bottom.
Take care!
-DP-

ETH, triangle or ABC?Hi guys, although this is getting boring, at the same time the price has printed the way that we are going to follow soon, so you can be quiet just by placing yourself correctly in the market. Many think that we are leaving the bear territory and mooning just because alts did a very good performance in the last couple of months, but how many time have we seen it? Don´t play fundamentals, it doesn´t work well on cryptos, at least not until we have a massive adoption of Bitcoin.
In order to have an impulsive wave from 15 December, we shouldn´t have such corrections almost hitting 78.6 fibo retrace. When that happens, there is only 2 things that can play out, a big ABC correction or a triangle correction. We don´t know yet wether is one thing or the other until a whale come and move the market again. That will happen most probably on Monday/Tuesday, since I expect a boring weekend, so once the whale move the price just a bit we will know what´s next.
Then, what you should do now? If you see my charts, either we finish a big C and we go to around $170-180 territory or we go down from now, so the most practical thing to do is entering short 50% here and place a few orders completing another 50% from 170 to 180. When I mean 50% is not 50% of your capital, is 50% of what you trade for 1 position, let´s say if you trade 5% your capital in 1 position, place 2.5% here and 2.5% divided between 170 and 180.
I will update frequently this idea since after this correction up we may start to see a huge market decline bringing us to new yearly lows.

ETH ready for next plunge!!
ETH fell into the demand zone around right above $100 and tried to regain support now turned resistance but failed
We are sitting right under resistance as well as the bottom of the trendline support
Any breakdown from here will result in a stop raid and could bring us back down to the next demand zone around $95 or even as low as $88
The only way we can turn bullish is if we can regain the Monthly open and the supply block above returning into the range
Bears are in control now and any BTC weakness will most definitely drop ETH price to lower levels
Thanks guys!
ETHUSD - BREAKOUTBuy Price: Green Zone
SL: Below Red Line
Profit: Blue Zones
Invest Suggestion: 20 Percent
Profit Expectations: 10 - 45 Percent
Looking at the chart of ETH , we could see all technicall indicators pointing to buy it , like MACD lines crossed , EWO green and the HMA 13 crossed all others HMA's and we have volume! Also, we have a triangle in the weekly chart, showing to us a triangle reversal pattern, another call to us.
ETH has a lot of new fundamentals news, like the hard fork on 14th January and the news about the plans to cut its absurd energy consumption by 99%!
So, feel free to but it in the region of 140$-153$! Remember that's a short-mid therm call!!
See me previous analysis and how profitable the are!
Sell when you get some profit, according the way you trade.
Keep following us and please like this idea.
Any doubts? Send in the comments or in our telegram or Inbox here.
Thanks for visiting.

Ethereym Ascending triangle pattern (ETHUSD)Hello Traders,
An ascending triangle is a bullish chart pattern used in technical analysis that is easily recognizable by the right triangle created by two trendlines,
In an ascending triangle, one trend line is drawn horizontally at a level that has historically prevented the price from heading higher,
while the second trend line connects a series of increasing troughs. Traders enter into long positions when the price breaks out from the horizontal trendline.
In Ethereum chart you can see we're still uptrend and so many fundamentals news coming this month goo.gl
190 to 200$ strong resistance and 140-145$ strong support.
Wish you all the best.

ETH - how to put a BITMEX trade without getting REKT ?It is a to- the- point analysis without any frills and lets you know exactly how to put the trade .
A lot of trade pandits will beat around the bush without telling you exactly how to exceute an order on BITMEX . This will show you how to put an order without getting REKT .
First the TECHINCAL ANALYSIS
Eth analysis needs breakdown on all time frames 1 hr (green Trend line), 4hr ( blue trend line) & even Daily ( yelllow trend line ) as ETh is at its peak . Change time frames to check
Line analysis - Tom Demark ( modern TA - coloured trend lines as above )+ resistance support (Classic TA - pink lines ) agree at the following to buy at these levels
Harami cross - indicating sideways movement for some time so buy on break out.
MACD & CMF are not showing a BUY , CFI trending dowing so I will wait for a break out .
But you dont need to wait you can put an order with the following instructions RIGHT NOW.
HOW TO EXECUTE THE ORDER ?
Every BITMEX order will comprise of the following three orders , Trigger , stop loss & take profit
BUY @ greater than 167 ( Put STOP MARKET ORDER @ 167 , uncheck REDUCE ONLY )
TARGET @ 210(Put TAKE PROFIT ORDER @ 167 , check REDUCE ONLY )
STOP LOSS @154 (Put STOP MARKET ORDER @ 154 , check REDUCE ONLY )
Size- 30 % of your portfolio on BITMEX ( 2 % risk ) . This one is volatile so dont go beyond this position size .
Dont short for short term swings as it is trending up on the daily .
Visit us at www.cryptoanteg.com and have a look at our store . Join us on Telegram at t.me/catforcrypto . You can buy stuff with bitcoin over there . Also look at trading bot section .

Ethereum would probably start an uptrendETHEREUM/DOLLAR
Midterm forecast:
While the price is above the support 80.35, beginning of uptrend is expected.
We make sure when the resistance at 200.00 breaks.
If the support at 80.350 is broken, the short-term forecast -beginning of uptrend- will be invalid.
Technical analysis:
There is a divergence in RSI and price between the trough at 99.03 on 2018-11-25 and the trough at 80.355 on 2018-12-07, the probability of downtrend continuation is decreased and the probability of beginning of uptrend is increased.
The RSI resistance #1 at 62 is broken, so the probability of beginning of uptrend is increased.
While the RSI support #2 at 50 is not broken, the probability of price decrease would be too low.
Price is above WEMA21, if price drops more, this line can act as dynamic support against more losses.
Relative strength index (RSI) is 60.
Entry signal:
Signal to enter the market occurs when the price comes to " Buy zone " then forms one of the reversal patterns, whether " Bullish Engulfing ", " Hammer " or " Valley " in other words, NO entry signal when the price comes to the zone BUT after any of reversal patterns is formed in the zone. To learn more about " Entry signal " and the special version of our " Price Action " strategy FOLLOW our lessons :
Take Profits:
TP1= @ 264.800
TP2= @ 309.100
TP3= @ 348.800
TP4= @ 393.550
TP5= @ 475.300
TP6= @ 534.700
TP7= @ 630.500
TP8= @ 822.550
TP9= @ 970.450
TP10= @ 1229.700
TP11= @ 1415.950
TP12= Free

Eth a joy ? .. i am more curious :)Targets mentioned with T.1 and T.2
Major resistance is also identified
All things are visible in chart
Dont use complicated indicators to confuse yourself, Patience is the only keY!
Remember if recent bottoms fail to pull up the current price level
or falls unexpectedly below 4H bottoms then dont lose more emotionally that many people do !
Enjoy Trading
Have a good time!


ETH FLASH CRASH?!?!
Markets continue to bleed day after day and we witnessed something insane yesterday
ETH/USDC had a flash crash
As always with these crashes, algos most likely were the culprit as ETH prices saw a collapse to $13 before snapping back all the to $101.0
Whether bids got filled or not is up in the air and could very well have just been an exchange glitch.....if someone did get lucky enough to fill they walked away with a near 700% gain
If you do have some spare change, its never a bad idea to place SUPER low bids on various majors through various exchanges to catch a lottery ticket
Thanks guys!

Ethereum drops from the sky!
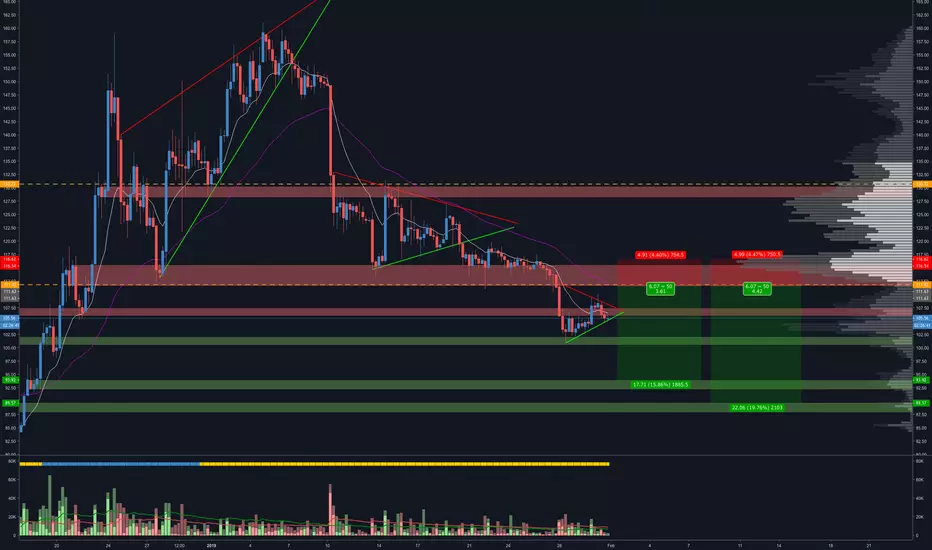
After hanging out near resistance for a few days, ETH was unable to muster any kind of strength
We did get a break down from the channel we formed near this supply zone and have been dropping ever since
We bounced perfectly at the bottom of the support OB at $103.50 on above-average volume
This is the line in the sand for bulls. If this zone isn't defended, we could see new lows as many expect to pick ether up in the low 90s
EMAs continue to trend lower and remain key resistance points
Thanks guys!

ETH needs to hold $100
ETH dipped below $100 for the first time since mid-2017 but saw a very strong reaction from buyers
We briefly saw wicks all the way back up to $120 but sellers have taken control once again
We are currently heading back down into the demand zone near $105 and bulls need to defend this zone to have any chance for a retest of local highs
The outlined path ETH could take is shown in the chart and the support OB holding will be critical
If we do get a reaction off it, we could see price return above and then find support near $110 before trying higher and tapping into the resistance zone
On the bearish side, a break below this block will see a test of lows and possibly see $80 price tag.
Thanks guys!

ETH needs to get back above $50!
ETH has bounced off of lows printed yesterday
EMAs have remained flat so far but a failure to break above this supply zone could cause us to revisit the lows
Two scenarios could play out here and the bears are in control of the markets and leaning towards another test and possibly break of yearly lows is very likely
Until we break above this resistance zone, new lows are still in the cards
Thanks guys!

ETH getting very close to BUY ZONE!
Ethereum finally broke the support zone it was holding despite the crash in BTC
Once price breached the lows, we saw a cascade of sell orders/stop-loss get triggered causing a quick drop to the $130s
EMAs continue to fall sharply with price
We are near the support OB below at around $95 but we bounced at the low of the previous drop back in August 2017
Whether we bounce strongly from here or make one last swoosh lower has yet to be seen but a nice squeeze could be on the cards
Thanks guys!
