ETH revisits $170's!
Ethereum dropped hard breaking through 2 levels of support OBs and rested in the demand zone around $173
EMAs have turned lower and gaining speed
This is a very strong support for ETH and holding here is critical
Despite BTC dropping hard and making new lows, some majors like ETH held up pretty well holding higher than the lows printed a few months ago
If BTC can return to $6000, we could see ETH get a short-term bounce back to $200
Thanks guys!
Ethereumdollar

Ethereum on its road to $180?!
Ethereum rejected the EMA and has been downhill since then
We have broken below the support OB and are now most likely heading to hit liquidity down in the $180 range
EMAs are starting to turn over so more pain could be in store
There is a lot of liquidity to be tapped in the $165-$180 area
Anywhere in this demand zone would be a decent zone to long but we need to see whether Bitcoin wants to test yearly lows
If BTC does test lows, we could very well see ETH test $165 or even make new lows so CAUTION is warranted here
Thanks guys!

ETH holding up well so far...$250 on the cards?
Ethereum has held up well so far holding that $205 level all weekend
This support OB remains a very strong level
ETH has been riding the EMA for a few days now acting as support but a break and close below would be very bearish
If this does happen, we will most likely see a test of the demand zone below possibly hitting sub-200 again
This level would need to hold or we could very well see another run at yearly lows
For bulls, a break above the supply zone would signal a very bullish push back up to $250
Thanks guys!

ETH taps into supply zone near $224
Ethereum continued its uptrend after bouncing off support near $208
Got a push above the EMA and spiked into the resistance zone where it was met with strong pushback
We could very well see a pullback down to the resistance now turned support highlighted by the green box
Bulls must hold this zone for continued upward momentum or we could be in trouble as sub-$200 could yet again be on the cards
Possible long entry if level holds would be around $210-$205 zone with stops right below the demand block

$225 next for ETH?
We finally did pullback as expected to the demand zone below but was a few days later than predicted
After tapping into support twice, we broke above 2 resistance levels before spiking as high as $218
That supply zone was met with heavy selling and price retreated back down into support
Bears have so far been unable to break this support zone and we seem to be creating some type of flag pattern
We could very well see a retest of the breakout zone before moving higher as it has remained untouched so far
EMAs continue to trend higher and will most likely provide support if we do pull back
Some might notice that we have a lower high on that spike compared to the previous one
Thanks guys!

ETH looking poised for a retest of $225!
Bounced nicely off support OB
Currently printing a CRUP but needs to close this way
Both EMAs continue to trend down but the fast-moving seems to be leveling off
Price has crept above EMA and could be heading up to test the other with the resistance zone right above
A retest of the supply zone is possible right now if BTC could break out here
Thanks guys!

ETH bear flag playing out?Ethereum has trended sideways with Bitcoin most of the month after that volatile Monday morning but it seems like might be playing out this bear flag we have been eyeing the past 2 weeks.
The initial breakdown was a -16.31% and if we project this move to complete the bear flag, we can see prices approach $166, which is almost perfectly aligned with a stop run right under the demand OB. We might not completely dip through this support zone but any entries scaled in this region could be a good spot for a long.
EMAs continue to trend lower and we could still see a pop higher before finally dropping into the demand area.
Thanks guys!

ETH dips back down to $190Ethereum followed Bitcoin down, breaking its support zone and slicing right through the first block and dipping slight into the next demand zone near $190. We have bounce nicely so far but would like to see a daily close above these 2 blocks. Our prediction for retracement was spot on but it did take a few more days to complete.
The EMAs have turned over and are catching up to price but we do expect this lower support zone to hold for now. If we do break below and close on the daily, we could very well be making new lows.
Thanks guys

Bearflag in the Ethereum chart?Ethereum continues to range in lockstep with Bitcoin PA but we seem to be forming a possible bearflag since dropping down to the top of the demand block.
We have trended upwards since the drop and volume has been on the decline besides that spike up last Monday as we dangle from the bottom support trendline at the moment.
The projection for a breakdown here would be a little lower from the bottom of this demand block around $165. Both EMAs continue to trend lower as the fast-moving EMA remains strong resistance.
Something to watch as a new low in Ethereum could itself cause lots of selling in altcoins and maybe even drag down Bitcoin but its way too early to tell, just something to keep an eye on.
Thanks guys
Ethereum getting ready to test resistance?Ethereum spiked all the way to $220, just shy of the supply zone around $222 before coming all the way back to the middle of the range. The EMAs have come together getting very tight after fallingg hard on that last down move. A break above in either direction will give us a better idea of where we head next as we are currently stuck in the POC.
A possible add area for a long would be in the demand zone below possibly all the way down to $192.
Thanks guys

ETHUSDETH/USD
Bearish dynamics persists.
Recession stopped at fibonacci level 78.6
Prog is in progress for further impulse reduction.

Ethereum still doesn't give us anything to be excited about! Ethereum popped up to the Tenkan Sen yesterday but was unable to close above this resistance zone and currently remains below the POC area. We would need to break above the Tenkan sen in order to magnet towards the Kijun and then the bottom of the cloud.
Check chart for annotations!
Thanks guys

Ethereum not out of the woods yet! Ethereum had a spike up but still hasn't really gotten anywhere and stuck near $200. For us to be bullish, we would need to need to close above this POC level we are currently stuck in.
Check chart for annotations!
Thanks guys
Ethereum was pulled in after it looked ready for a dive! Ethereum was looking very weak and about to fall off a cliff before Bitcoin & the Bitfinex/Tether FUD hit the wires and cause a huge spike market wide. This in turn moved Ether off the lows and spike into highs of around $220, which was not held and moved back under resistance at the moment where it is stuck.
Whether we get another pump from Bitcoin 9.04% or start to return back to equilibrium with other exchanges is yet to be seen.
Thanks guys

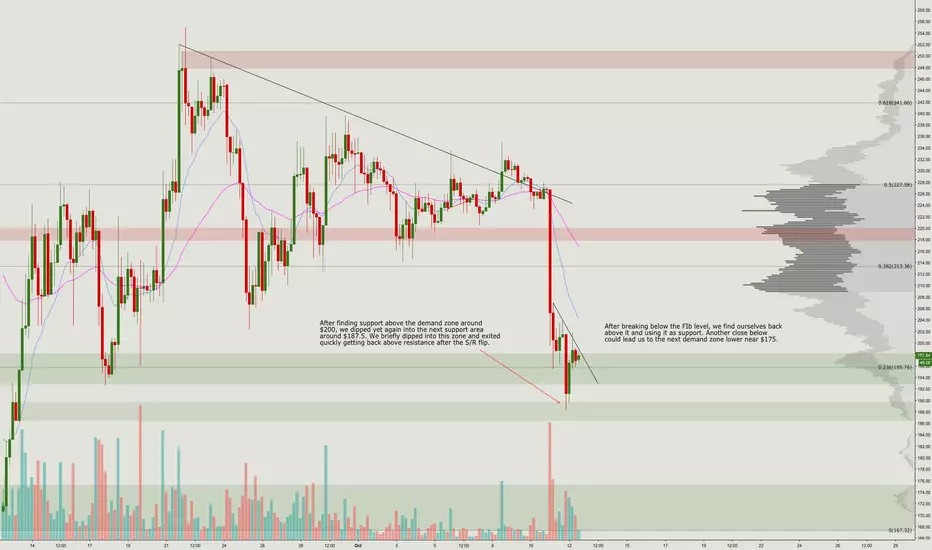
Ethereum finally gave way to sub-200! Ethereum was trying very hard to stay afloat above $200 but it finally gave way and dropped straight into the next demand zone around $187.50. The FIB level is acting as support at the moment but we need to move away from this area or else we could see $175. EMAs are still moving lower trying to catch up to price so some consolidating might occur here but we can't rule out a bounce back up to the fast-moving EMA before a continuation lower.
The only thing that can give bulls some hope is a strong bounce from here back above the $208 area with volume.
Thanks guys
Ethereum $170 coming up! Ethereum needs to hold this FIB support zone for bulls to have any type of hope or we will see the $170-handle again. If one is looking for a short, the ideal spot would be near the 38.2% FIB or better yet the resistance level right above it.
Thanks guys!

Ethereum could be booking a trip down under shortly! Ethereum is looking very bad after breaking below the triangle support yesterday and continues to look weak on every bounce. We fell down to support and we must hold this level or else we could revisit the lows once more causing even more panic!
We must wait and see what happens in the next few hours and how the daily candle closes.
Thanks guys

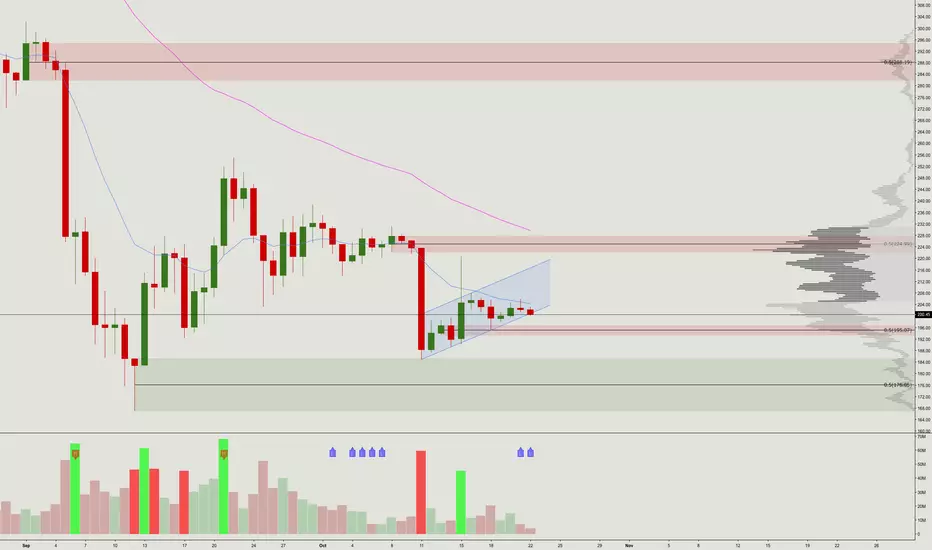
Ethereum continues printing grey candles! Ethereum continues to trend sideways in this range and as we can see on the chart using SCMR, indecision is the story being told by looking at the candle for the past few weeks. After breaking above the triangle and testing resistance we have returned right back into the range and yet again await some type of volatility to have a sense of direction.
Until we get a stronger move, sitting on your hands is probably the best play here.
Thanks guys

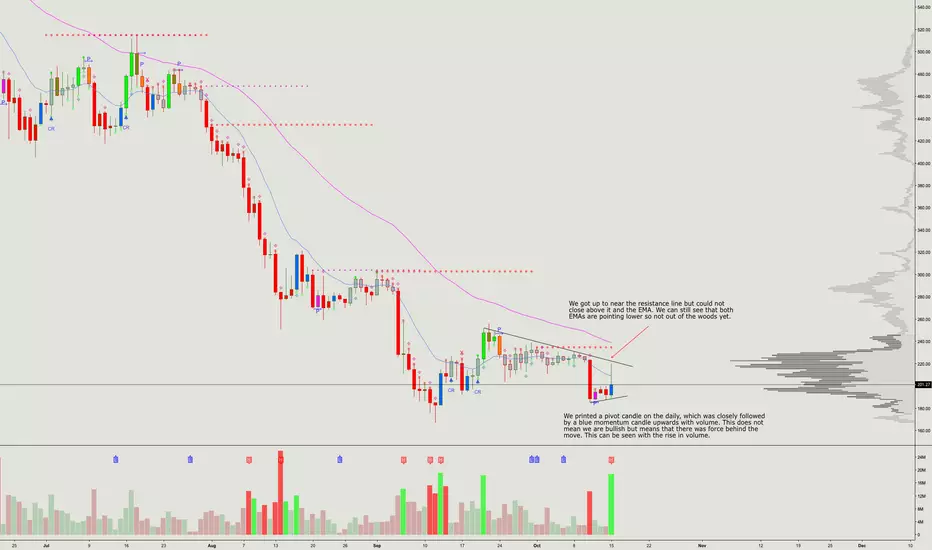
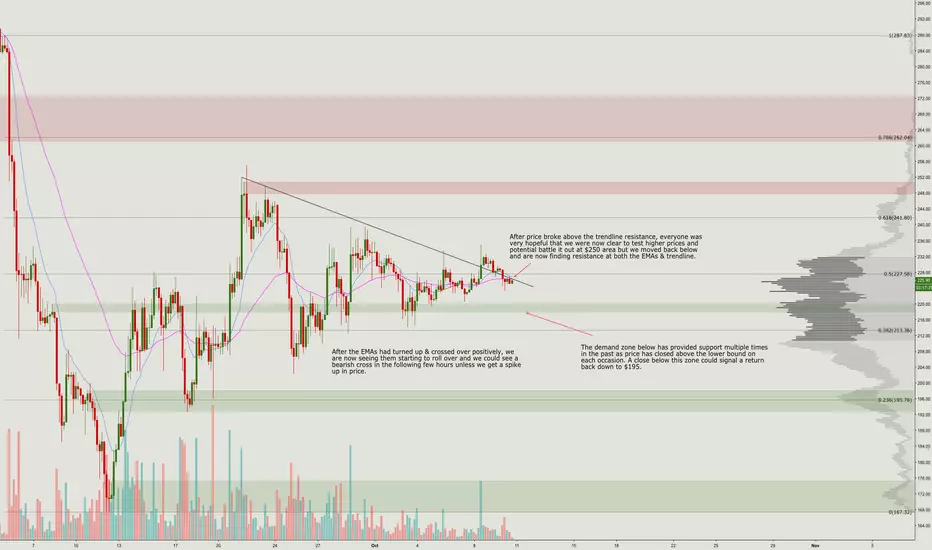
Ethereum looking worse as the days go by! Ethereum finally looked like it might be out of the doghouse and could possibly test supply above but yesterdays drop has put everything back into question. If we cannot get above the EMAs & trendline here and we drop back into the support area below could further put the nail in the coffin for Ether as it will most likely head back to $195.
We have seen in the past that ETH PA does sometimes lead the market so a breakdown here could spur a break down in Bitcoin and the rest of the market.
Thanks guys
Ethereum decision time approaching! Ethereum continues to remain range bound over the past few weeks and has found it hard, time and time again, to break the resistance around the $235 area. A break higher from this very big POC area could be the launch pad needed to propel ETH back to $300.
We will wait for some movement in either direction to post a possible trade.
Thanks guys!

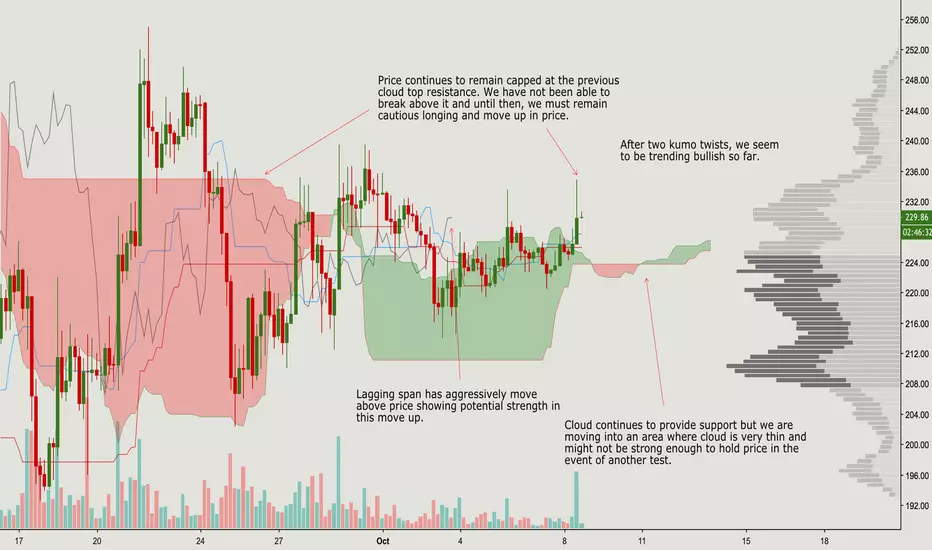
Ethereum finding it hard to break above cloud!Ethereum bulls have carved out a nice chunk from bear sell walls BUT the previous cloud resistance still remains top dog! We would need to see a break and close above that zone to have confidence that bulls are in control.
Check chart annotations for more info!
Thanks guys
Ethereum showing signs of life! Ethereum has remained support above the demand zone and needs to test high to continue bull momentum. Any break below this zone could spell trouble!
Check chart for annotations!
Thanks guys

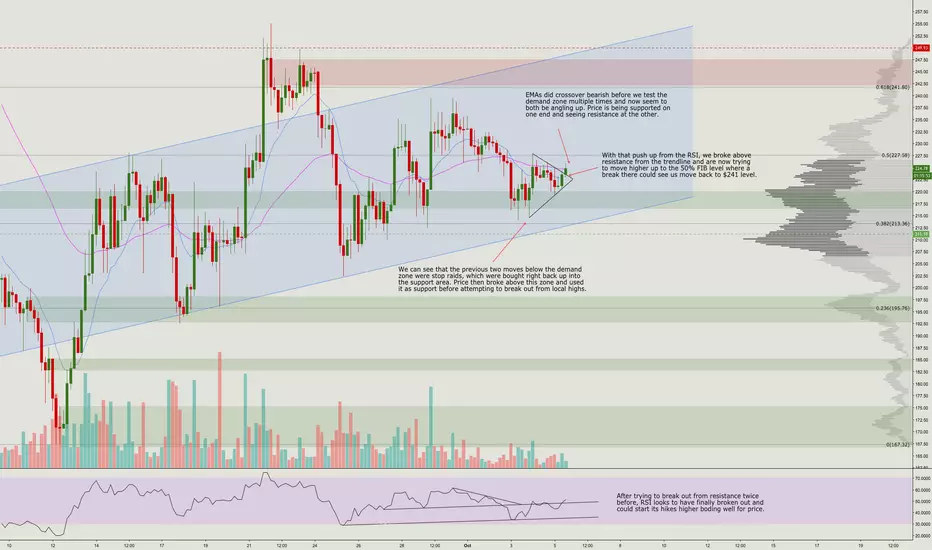
Ethereum must clear $228 in order to give another go at $240! Ethereum 1.08% continues to look very weak but a glimmer of hope was seen yesterday after price was able to break from resistance and is now trending above one of the EMAs. We must break from the $227-$228 area in order to give another attempt at the big $240 supply zone.
Check out the chart for annotation!
Thanks guys