ETH, Ethereum - 2 scenarios and 2 entry pointsETH looks more positive than others coins. Price broke the trendline and started to squeeze. If we continue to do it, it will be a great pattern for buy. Entry point only after retest a key level. Second scenario: we'll do a retest to the trendline. It happens if BTC will drop. Entry point near to the trendline.
Write in the comments all your questions and instruments analysis of which you want to see.
Friends, push the like button, write a comment, and share with your mates - that would be the best THANK YOU.
P.S. I personally will open entry if the price will show it according to my strategy.
Always make your analysis before a trade
Ethereumdollar

ETH.D To IncreaseEthereum dominance is looking to increase after hitting the bottom of the expanding wedge formation
We are looking for a right shoulder to form from this upward move, confirming the larger head and shoulders pattern within this wedge
Personally I think this will be the move to break this wedge formation, but if not the right shoulder will occur.
Included other chart patterns within this larger wedge, (falling wedge, symmetrical triangle)
I am long Ethereum

ETH tumbles to $2,000 as losses to $2,000 linger
Ethereum rejected at the 50 SMA on the four-hour chart.
Ether bulls battle to secure immediate support at $2,000, highlighted by the 100 SMA.
The least resistance path is south, but support at $2,000 may bring back market stability.
Ethereum bounced off support at $2,000 amid the weekend session declines. Bulls fought around the clock to reclaim most of the ground to $2,500, but the uptrend stalled under the 50 Simple Moving Average (SMA) on the four-hour chart. Recovery became a challenging task, allowing bears to swing into action.
Ethereum technical levels worsen
The four-hour chart suggests that the short-term technical levels have weakened in the last 24 hours. The Moving Average Convergence Divergence (MACD) indicator failed to secure the ground within the positive region. The slide into the negative territory is a massive bearish signal. The gravitational force is accentuated by the MACD line (blue) crossing under the signal line. As the signal line’s divergence widens, the bearish grip gets more vigorous.
In the meantime, Ethereum trades around $2,100 amid increasing overhead pressure due to the 100 SMA at $2,200. Losses to $2,000 beckon amid the bearish picture. The 200 SMA is in line to offer support; however, if lost, declines may extend to the next anchor zone at $1,800.
It is worth keeping in mind that if support at $2,000 holds, a rebound such as Sunday may occur. Reclaiming the ground above the 50 SMA could trigger massive buy orders as investors speculate the rise to $2,500.
Ethereum intraday levels
Spot rate: $2,095
Trend: Bearish
Volatility: High
Support: 200 SMA and $1,800
Resistance. The 100 SMA and 50 SMA on the four-hour chart

MACD fakeouts Ethereum and LINK for examples
The MACD can be seen to attempt a reversal but is overcome by bullish momentum
An observation
I am long ETH and LINK

Ethereum m00nEthereum has broken above 1.618 fib level within the circle
It also seemed to form a flag and has broken up out of that
This is the weekly chart
I expect it to outperform BTC


Ethereum Weekly: Powerful negative divergences in EthereumThe RSI has reached its historical top, since then, the negative RD is obvious. furthermore, in MACD the mentioned divergence type is about to be completed, however, it is not confirmed yet or it can form a double top. Along with the divergences, according to classic point of view, the price is going to touch two resistance levels: Top of two different channels.
Note: Be careful about volume in each top (in Daily timeframe).
Good luck

uptrend(mid)it is in the last ascending wave of the third wave (3-5)
after the end of the third wave we will see good correction Price (W4)
the ranges of target have been identified
we will see most likely a Terminal Pattern.


💡Don't miss the great buy opportunity in ETHUSD Trading suggestion:
". There is a possibility of temporary retracement to suggested support line (2000).
. if so, traders can set orders based on Price Action and expect to reach short-term targets."
Technical analysis:
. ETHUSD is in a uptrend and the continuation of uptrend is expected.
. The price is above the 21-Day WEMA which acts as a dynamic support.
. The RSI is at 53.
Take Profits:
TP1= @ 2080
TP2= @ 2145
TP3= @ 2199
TP4= @ 2270
TP5= @ 2340
SL= Break below S2
❤️ If you find this helpful and want more FREE forecasts in TradingView
. . . . . Please show your support back,
. . . . . . . . Hit the 👍 LIKE button,
. . . . . . . . . . Drop some feedback below in the comment!
❤️ Your Support is very much 🙏 appreciated!❤️
💎 Want us to help you become a better Forex trader?
Now, It's your turn!
Be sure to leave a comment let us know how you see this opportunity and forecast.
Trade well, ❤️
ForecastCity English Support Team ❤️

💡Don't miss the great buy opportunity in ETHUSD Trading suggestion:
". There is a possibility of temporary retracement to suggested support line (2000).
. if so, traders can set orders based on Price Action and expect to reach short-term targets."
Technical analysis:
. ETHUSD is in a uptrend and the continuation of uptrend is expected.
. The price is above the 21-Day WEMA which acts as a dynamic support.
. The RSI is at 51.
Take Profits:
TP1= @ 2080
TP2= @ 2145
TP3= @ 2199
TP4= @ 2270
TP5= @ 2340
SL= Break below S2
❤️ If you find this helpful and want more FREE forecasts in TradingView
. . . . . Please show your support back,
. . . . . . . . Hit the 👍 LIKE button,
. . . . . . . . . . Drop some feedback below in the comment!
❤️ Your Support is very much 🙏 appreciated!❤️
💎 Want us to help you become a better Forex trader?
Now, It's your turn!
Be sure to leave a comment let us know how you see this opportunity and forecast.
Trade well, ❤️
ForecastCity English Support Team ❤️

ETH daily very good buyEthereum channel
sitting right above the middle
I think bullish momentum will push it higher
daily chart

Ethereum Possible Profit AreasIn blue and green triangle are suggested profit areas during this bull move on the weekly
Lets stay above 2K!

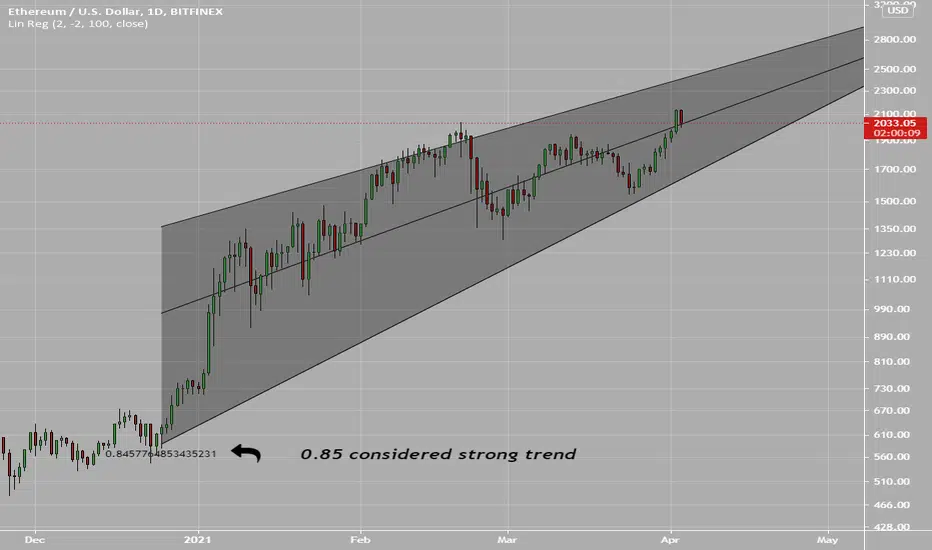
Ethereum Linear RegressionStrong uptrend
R value of 0.85
I hope the middle line holds, up continuation is favored
ETHUSDT about to re-test resistance area. Key 1,930 in play.Textbook pattern in play and price about to test resistance trend line.
Personally, the price I am watching is 1,930.


💡Don't miss the great buy opportunity in ETHUSDTrading suggestion:
". There is a possibility of temporary retracement to suggested support line (1731.90).
. if so, traders can set orders based on Price Action and expect to reach short-term targets."
Technical analysis:
. ETHUSD is in a range bound and the beginning of uptrend is expected.
. The price is above the 21-Day WEMA which acts as a dynamic support.
. The RSI is at 73.
Take Profits:
TP1= @ 1863.30
TP2= @ 1946.45
TP3= @ 2040. 40
TP4= @ 2217.00
TP5= @ 2375.50
SL= Break below S2
❤️ If you find this helpful and want more FREE forecasts in TradingView
. . . . . Please show your support back,
. . . . . . . . Hit the 👍 LIKE button,
. . . . . . . . . . Drop some feedback below in the comment!
❤️ Your Support is very much 🙏 appreciated!❤️
💎 Want us to help you become a better Forex trader?
Now, It's your turn!
Be sure to leave a comment let us know how you see this opportunity and forecast.
Trade well, ❤️
ForecastCity English Support Team ❤️

Ethereum might bounceEthereum doesn't look nice with this double top formation
However the present of the 2.618 fib circle ring may allow for a bounce to occur
ETH/BTC also looks ready to push higher after just moving below a major trendline, signaling the upward move

ETH - 2 scenariosI see two scenarios for the development of the coin:
1) If we approach the resistance line, we will break it and rise
2) If we go to the trend line, the probability of rising and falling is the same.
Write in the comments all your questions and instruments analysis of which you want to see.
Friends, push the like button, write a comment, and share with your mates - that would be the best THANK YOU.
P.S. I personally will open entry if the price will show it according to my strategy.
Always make your analysis before a trade

Ethereum where to buy Good afternoon ,
Would you like to know at what point to buy Ethereum?
I teach you easily with a graph, the only thing you have to memorize are the 4 areas drawn with Red / yellow / green and pink.
Best entry: Green Zone 1513
A good entry: Yellow Zone 1652
Risky entry: red zone 1897
Danger zone: pink zone 1294
Depending on the risk you want to take, you enter the desired level.
PS: Pink zone is dangerous if the price crossdown this level, it could go down much more.
If it's helpful, could you give me a like.
What do you think ? will it keep going up?

Ethereum Complicated Point with 2 Scenarios 02/02/2021 price is in a bearish wedge and if it breaks the top we can target 1867
we have bearish divergence with MACD which can be the sign of trend reversal or some retracement down to 784
what do you think?
Bullish or bearish?

Ethereum Market Cap IdeaIdea for ETHMCAP
I expect the bull run to continue while the channel on the RSI is intact
Sitting above (1) level on the fib retracement
This is a bullish sign
The only bearish sign is the price action above (1) which is similar to the price action when the top occurred in the previous bull run
However I think the bulls will prevail, take my bias into account though
