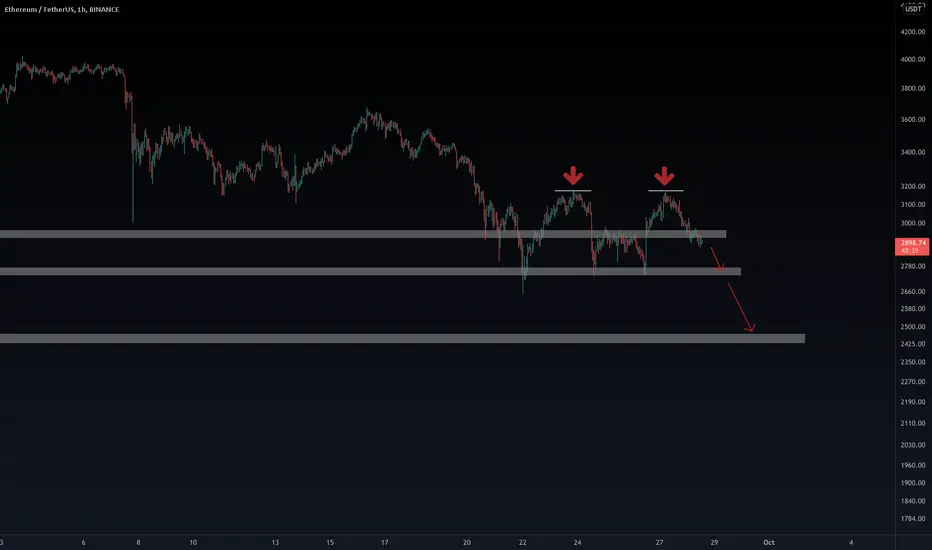
ETH Short SetupThis setup valid if only daily candle closed below 2834.08
ETH Short Setup
- Sell momentum
- Bad news tapering
Entry:
Sell market
Sell limit 2874-2927
Target:
TP1 2877.92 (If trigger sell limit)
TP2 2733.62
TP3 2500.13
Note:
Always do your research!
Ethereumshort

Ethereum Sell a break setup.Ethereum - Intraday - We look to Sell a break of 2948 (stop at 3033)
Daily signals are bearish. Bearish divergence can be seen on the daily chart (the chart makes a higher high while the oscillator makes a lower high), often a signal of exhausted bullish momentum, or at least a correction lower.
Short term MACD has turned negative.
Bias is mildly bearish today but we need to see a break of 2950 to confirm the downward pressure.
Price action has posted a bearish Engulfing Candle and is negative for short-term sentiment.
Our profit targets will be 2721 and 2641
Resistance: 3100 / 3200 / 3300
Support: 3000 / 2900 / 2800

ETHUSDT SHORTETHUSDT 4H BINANCE SHORT POSITION
my technical analysis of the continuation of the ETH trend...

ETH Sell into a rally.Ethereum - Intraday - We look to Sell at 2536 (stop at 2622)
Daily signals are bullish.
There is no indication that the selloff is coming to an end.
We look for a temporary move higher.
Preferred trade is to sell into rallies.
50 4hour EMA is at 2573.
Our profit targets will be 2302 and 2222
Resistance: 2400 / 2500 / 2600
Support: 2300 / 2160 / 2000

Ethereum to break support, 1800 here we come!Like all crypto market, Eth has reversed strongly from my pointed-out sell zone yesterday and what took 48h to gain was erased in only 8 hours, giving us a strong clue about the bearish momentum.
At this moment the cryptocurrency is trading exactly in 2400 support and a expect a clear break under soon.
Bears can target the next important support at the 1750-1800 zone and only a daily close above 2800 would negate this scenario.

Ethereum sell the trend of lower highs.Ethereum - Intraday - We look to Sell at 2519 (stop at 2588)
Daily signals are bearish.
We are trading at oversold extremes.
Prices expected to stall near trend line resistance.
The trend of lower highs is located at 2520.
Our profit targets will be 2331 and 2271
Resistance: 2500 / 2550 / 2700
Support: 2380 / 2300 / 2160

ETH Short Heads Up Disclaimer
NO FINANCIAL ADVICE – The information on this website is for educational, informative, and entertainment purposes only. No express or implied warranty of any kind, including warranties of accuracy, completeness, or fitness for a particular purpose, is given with the Information.
This article is not intended to be and does not constitute financial advice, investment advice, trading advice, or any other form of advice.
This post's information is general in nature and isn't meant for you or anybody else. You should not rely on any of the material found on this post to make a financial, investment, trading, or other decision without first doing your own due diligence and consulting with a professional broker or financial advisor.
You understand that by reading any and all information on or through this post, you are doing so at your own risk.
The trading of cryptocurrencies, Tokens and NFTs has potential rewards, and it also has potential risks involved. Trading may not be suitable for all people. Anyone wishing to invest should seek his or her own independent financial or professional advice.

ETH/USD looking bearishETH/USD: trade update
So as we can see the price did break the possible rising wedge that we had on the chart. What we also can see now is that the price did do a retest of that wedge and went down after that. It did another retest of the wedge but still was not able to break the wedge. We can now see that the price still is moving down. I think that we are going to see a drop to at least the 0.382 level of the Fibb and I am waiting for that to happen. Once it does go to that level there are 2 things that can happen.
1) The first thing is that we see a break of that level and then I will be waiting for it to drop a little lower to the zone that is marked as zone of interest. I think that if the 0.382 level is not able to hold than that zone has a higher chance of holding because we saw that it already did hold a few times in the past.
2) The other thing that can happen is that the price touches that zone and reverses to the top side. We do can see that the price did already reverse sometimes on the 0.382 level so it does seem to be forming a support at that level in the short term.
In conclusion:
So I think that we will see a bigger drop happening before we are able to go back up again. I am now waiting for it to go lower to buy more Ethereum.
If you have any questions feel free to send me a message.
If you like the idea do not forget to give it a like and feel free so share your idea on this in the comments.
Everything you see on my profile is just for educational purposes only.

ETH drops to trendline - what happens next?Ethereum has seen a sharp decline after it's 4th push into the supply zone since the 23rd.
We've now reached an establish demand zone in the high 3800s and seen a small bounce and consolidation just above this zone.
Price is also touching it's lower trendline after a brief wick below.
Downside momentum is strong and this consolidation could be sellers taking a breather before gathering strength and pushing price below both the trendline and demand zone - if this were to happen I would expect the momentum to drive price down to the lower support level around 3760.
However we do have this demand zone and trendline as support and RSI is low - below 23 at time of writing - so a bounce could be imminent, and our target would be the Point of Control indicated on the volume profile.
This is not financial advice. Allocate your capital responsibly.
Comment your ideas below. Do you think we break below this demand zone for a continuation of downside momentum? Or will we see a bounce from this key area?

ETH/USD: Bears vs Bulls, who is winning?Hello, everybody, and welcome to my TradingView’s profile, my name is Gianni and today I’m going to analyse the ETH/USD , translating the market information by using a full technical analysis on different time frames, giving you a personal opinion about the next most likely market movement and helping you to spot and manage market opportunities.
My ideas are for those who are interested in improving their financial education and for those who are looking for new trading opportunities, according with their own strategies.
Monthly timeframe:
Weekly timeframe:
Daily timeframe:
4 hours timeframe:
The market has been following a descending channel for a while, it is inside a dynamic fair value area where the sellers are still slightly more in control compared with the buyers.
Volumes increased every time the price attempted to reach the support level, that’s a sign that on the support level, buyers are ready to step into the market (a huge shadow on the first rejection and a big green candle that engulfed the previous few candles are clue of strong demand).
The price is currently retesting a daily key level with a possibility to see a new movement to the downside before consolidating and eventually start changing the trend.
When, where and why would I step into the market?
Considering that the most trading activity happened to the low value of the channel, the downtrend could be considered still healthy, until I will see the price making a higher low!
With a good rejection on the current resistance level, I would definitely speculate on this market with a short position with a RRR of 1:2 or greater.
My stop loss would be above the last higher high and my target profit on the support level, just close to the middle line of the channel.
Low volumes on the current level, small candles rejection and poor RRR would invalidate my short trade on this market.
In this scenario I will be waiting for the next market movement, considering that however, the demand could change the current trend, soon!
If you enjoy this trade idea, please support my work with a thumb up and don’t forget to follow my profile for more detailed market analyses!
Trade safe and responsibly,
Gianni
DISCLAIMER
Please note the views are not investment advice and should be used only for educational purpose

Can Eth drop to 3k?After the last drop, Ethereum rebounded and had a very short-lived rally above 4k.
However, Ethereum, like all crypto market, in fact, is very weak and the price of Ethereum fall back quickly under 4k.
This is a strong bearish sign for me and I expect a new aggressive leg down, this drop can easily extend to 3k zone.
Only if I see strong buying power and Eth above 4.2k I would rethink this scenario

Ethereum Price Prediction H1This is my view for Ethereum Price Prediction ETHEUR on H1. The price should go down, you can put a pending order on the Order block or find an entry on LTF within OB Zone. Trade Safe!

ETH/USDT Short Call ?Following Dow theory and based on Descending channel, its good time to short ETH.
Please follow and like for more ideas. THank you

Eth- I don't think 4k will holdIf you've read my analyzes, you know that I have "a problem" with an asset staying at support or resistance as an invitation to buy or sell and make money, as if it were so simple.
Is exactly Eth's case right now, with the price coming back to 4k for all of us to buy and make money, and if you remember, a week ago Btc stayed at 55k and...
I can be wrong this time, of course, but in 90% of the cases, these support/resistance fall eventually.
From a technical point of view, Ethereum is in a descending triangle pattern with this 4k base, and a daily close under could accelerate losses.
The first target for bears can be 3.5k low from the last week's sell of followed by 3k zone, strong horizontal support and the measured target for the triangle.
I will stay short as long as the price is trading under 4.3k

#ETHUSD - Ethereum heading lower at least -20%Hi All, my main 3 take-outs from this analysis are the following:
1- ETH broke a rising wedge (in red) whose target is around 2,800. Before reaching that target though the price will face a strong dynamic support given by the 200 MA as also by the 0.786 Fibo level at around 3,130
2- The price might also ideally try to break the supportive blue trendline of the bigger rising wedge and if it does, the drop might be pretty strong. I believe that the 100 MA might be broken easily..
3- Strong bearish divergence shown on the RSI vs prices. Higher highs of the price are not supported by higher highs of the RSI, which is making lower highs.
Not a financial advice, just personal opinion. Do your own due diligence and good luck!

ETHUSDTWe are watching for aggresive sell near to these prices 4400 - 4500. Markets are very close to dive and correct bigger.

Ethereum back in sells ↘️Back on our Ethereum strategy here using the EDGE trend follow script.
Entry details are shown on the chart we are in a short position.
Trade has been live since 15:00 UK time.
Working the 45M time frame here and we're only looking for TP3.
Previous trades can be found on chart one was a sell that hit TP and a buy which hit SL.
No strategy is 100% right all the time the stats for this one is 63% win rate.
As always the report box at foot of the idea shows the stats for this strategy.
In that box every trade is logged and can be viewed by clicking the tabs in the report box.
You as the viewer of this idea can also do that so go ahead and have a play.
Strategy has been covered in other ideas of late so make sure to check them out too.
------------------------------------------
I try and share as many ideas as I can as and when I have time. My trades are automated so I am not sat in front of a screen daily.
Jumping on random trade ideas 'willy-nilly' on Trading View trying to find that one trade that you can retire from is not a sustainable way to trade. You might get lucky, but it will always end one way.
------------------------------------------
Please hit the 👍 LIKE button if you like my ideas🙏
Also follow my profile, then you will receive a notification whenever I post a trading idea - so you don't miss them. 🙌
No one likes missing out, do they?
Also, see my 'related ideas' below to see more just like this.
The stats for this pair are shown below too.
Thank you.
Darren.

Ethereum- A break under 4300 zone provides bearish confirmationSince the ATH from above 4.8k ten days ago, Ethereum has started a bearish trend, with lower highs and lower lows (A correction in fact to the overall trend) and has dropped to the important 4k zone.
The reversal from this low is, in my opinion, just a correction and we can expect a new leg down.
At this moment EthUsd is trading just above important confluence support that lies around 4300-4330 zone, and a break here would bring confirmation for my bearish outlook.
I expect gains to be well capped before 4.5k and a new drop to 4k zone can follow.
I will remain bearish as long as the price is under 4.5k

ETH SHORT SCALPShort pressure confirmed on m30 and H1 although not strong enough as it's only just beginning. Let's see how this plays out.
SCALP TRADES ARE SUBJECT TO CHANGE, If there is a shift in BUY or SELL pressure we may change our bias! NOT A FINANCIAL ADVISE

ETH - Symmetrical Triangle - WEEKLYETH shows dying momentum in this almost perfect Symmetrical Triangle.
MACD is shows slowing momentum with possible trend reversal.
Also BTC shows some bearish signs too on Weekly MACD.
If we are lucky, we could see a $2200 - $2300 ETH before it head to much higher levels.

ETH Rising WedgeETH has made a rising wedge on the daily time frame with a technical target of around 2800.

WHY I'M SELLING ETHUSD?Just like BTC we witnessed a solid move to the upside this week
on ETH i believe there will be a change of trend soon.
I'll be taking this Trade, projecting a move to 3500-2900
might be a small move but i expect big profit Lol
i will sell during breakout of dynamic support level
Aoc is price $3398, which is a major support zone
let's see how it goes.

Cryptocurrencies, Bitcoin, Daily Chart, Trading Signal, BTC,ETHETH Double top and under the all important $3k mark…
Those itching to short can target $2750 and possibly $2450