Ethereum Potential Double Top, BEWARE if price break this level!Ethereum has had a nice rally since it formed a double bottom, congratulations to all my followers who took the long trade setup. It is now forming a potential double top, with the neckline at 1930. The double top will only be confirmed if price breaks below 1930, and it will be invalidated if price rallies above the second top at 2025.
Why follow?
1. Community of Technical Analysts sharing analysis and trades
2. Live tracking of whale wallet movements
3. Live update of the latest important news
4. Live syncing of popular crypto tweets
5. Ebook covering how to be profitable in the cryptocurrency market
Ethereumshort

ETHEREUM/USDT AT RESISTANCE AREA CURRENTLY ETHEREUM IS AT RESISTANCE AREA IF IT WILL BREAK HER RESISTANCE SO IT WLL GO UPWARD AND IF CANT SO DOWN.
HOPE YOU ALL ARE FINE.

Ethereum droppind to $850 in August 2022If Ethereum repeats the pattern that we saw after its peak in 2018, we might be in a bear market until August 2022, where the price might stabilize at around $850. In 2018-2019, during a period of almost 1.5 year, the price dropped by -88% until the bear market ended, which makes it not far fetched to believe that a drop by around -80% in the price can happen again. Crypto currencies are very volatile after all.
The first signal to look for is if the 50 simple moving average crosses the 200 simple moving average, in which case a bear market is confirmed. If the trend lines continue on the same trajectory that we are already seeing, and comparing to what it looked like in 2018, this might happen two months from now in August.
If the first signal occurs, the next one will be about one year later, in August 2022, when we might see the end of the bear market.
Furthermore, note that in April-May 2018, during a one month period, the price jumped from $400 to $800. Jumps like that might happen again during this fall downwards. So be cautious and avoid getting FOMO.

ETH: Shorting resistanceETHUSDT is at resistance and the chances of a breakout look slim.
Based on my analysis, that:
2K is now resistance
180 EMA is acting as resistance above 2K
We will reenter the Ichimoku cloud and move down
I have looked at ETHUSDT in higher timeframes (Daily and 4HR) it really looks bearish based on what I have seen, (Links below).
I'm opening a short at 2013 with a STOP LOSS at 2070.

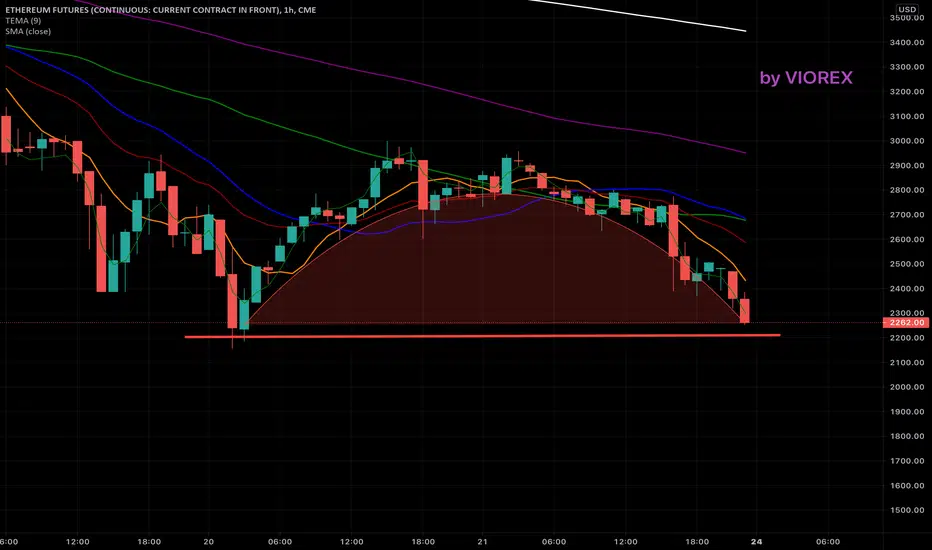
Ethereum Head and Shoulders target fall to 2000Ethereum seems to be continuing its bearish trend. We are looking at a potential short at the 200MAs, which is currently sitting at around 2240.
A new pattern is now potentially forming, the head and shoulders, with the neckline at 2125. If price breaks the neckline, the target is around 2000.
Hi guys, this is OG back with another cryptocurrency update. If you find value in my work, please do like, share, and comment. And also feel free to share your ideas and technical analysis in the comments below.
Check out my technical analysis videos for more in-depth analysis and trade setups for Bitcoin, Ethereum, and Altcoins.
Why follow?
1. Community of Technical Analysts sharing analysis and trades
2. Live tracking of whale wallet movements
3. Live update of the latest important news
4. Live syncing of popular crypto tweets
5. Ebook covering how to be profitable in the cryptocurrency market
As always, I’m not a financial advisor, all information presented is for educational purposes only and not meant as financial or investment advice, do your own research, and stay safe!

Ethereum (ETHUSDT) Potential Short Scalp Entry Soon!Hi guys, this is OG back with another Bitcoin update. If you find value in my work, please do like, share, and comment. And also feel free to share your ideas and technical analysis in the comments below.
There is a potential short trade coming up on ETHUSDT, key word is potential. We need to wait for confirmations before jumping into the trade. I'm waiting for price to test the 2470-2490 zone, get rejected on large volume and large candlestick formation, before taking a scalp short. Of course, price can break through the 200MAs and continue to go up, in which case I would pass up on the short and look for a potential long. That is how I trade, being flexible and adapting as market conditions change instead of being stuck in a certain view.
Check out my technical analysis videos for more in-depth analysis and trade setups for Bitcoin, Ethereum, and Altcoins.
Why follow?
1. Community of Technical Analysts sharing analysis and trades
2. Live tracking of whale wallet movements
3. Live update of the latest important news
4. Live syncing of popular crypto tweets
5. Ebook covering how to be profitable in the cryptocurrency market
As always, I’m not a financial advisor, all information presented is for educational purposes only and not meant as financial or investment advice, do your own research, and stay safe!

SHORTING ETH: Triangle BreakdownETHUSDT seems to have broken below the triangle against the 3K resistance.
We might drop to the lower part of the range and hit the 2.2K support or even the 2K.
I'm opening a short at 2.395 with a STOP LOSS at 2520.
Also I'm using a trailing stop based on 2 ATR from the 1HR chart ($70) that is a 3% trailing stop.

ETH: Careful with a triangle breakdown and DUMP.ETHUSDT has significantly dropped since the ATH of may the 15th.
with a 60% drop and $2650 down in only 8 days before hitting a local bottom and recovering until the current triangle was formed.
This powerful downtrend seems to be stopped right now, as we form this triangle, volume keeps steady.
This triangle may soon breakdown, I'm basing this bearish scenario on the following:
The current trend is bearish
Bearish Kumo twist has already formed ahead
The rather bearish Price action of the few last days
Based on this I believe this breakdown will be followed by a small bounce from the area of support that consists of previous resistance of 2K to 1.5K range, the 180 EMA, and the Ichimoku cloud.
If this bounce is rather weak we will probably continue the downward pull.

ETH ready for the next DUMPETHUSDT is in a clear downtrend, the hull suite indicator (Big red line) shows that this downtrend was particulary powerful with little pullback until we found ourselves in the current range.
Now ETHUSDT is forming a triangle and it looks like it could continue the downtrend, we also have a bearish kumo twist ahead.
There is a strong area of support just below this triangle, with the 180 EMA, The Ichimoku cloud and previous resistance turned support.
We should get a pretty strong bounce up, after we hit that area, if we dont and enter the cloud we could have an increased bearish sentiment and a further move down.
Be advised to keep both eyes open for:
Triangle Breakdown
Hit area of support with little bounceback
Enter Cloud and continue the downtrend.
The bullish scenario
Triangle Breakdown
Hit area of support with strong buying pressure
Start of new uptrend
We could also break the triangle upwards, but I'm being pessimistic seeing the current lack of interest in the market right now.

ETHEREUMAnother day of drops for eth. If the support marked with a red line does not last today, eth may drop to 1500. Short prediction for eth today.


ETHUSD HEAD AND SHOULDERSETHUSD is making a head and shoulders pattern in 4h time frame. To open a short position we have to wait the breakout and a possible re-test. All resistance & support points are given. This is not a financial advice.

Possible "HEAD AND SHOULDERS" pattern in Ethereum If head and shoulders pattern approved , price will break support zone (1680-1720)
In that case the target would be about 1440$

HaHa Soo Funny Short StorySO this one time I was really lazy I had up to this point only been [b ]9999.99% LONG... I couldn't help but get sucked into the vortex of trust me because "I know more than you guru baloney." Truth is that a modest holding that I had in ETH could let me even pick up a bit over 3 BTC at todays price sounds like I know what I am doing until you read that box there that's when out of laziness I went ahead and took a trade short position based on a well known guy because I was being a pleb. As face ripping as it was lol I was smart enough to see we were about to moon harder than I ever really planned. So a good fail safe allowed fore a reduction in my holdings and some huge gains most have seen this bull market.
I am still however putting life's lesson in action minus the dingus behavior of being a early pleb lol.. Why am I saying this? Because anyone can be right or wrong and it is important to learn from bone head moves we take. I am going short on ETH again even though I hade a very real close call because unlike on my last big trade I am calling it and I am killing it and eating it on my terms. (Thank you Risk Management) for the second chance now YOLO 🤑..
LIFE LESSON DON'T BE LAZY! 😴💤
[i ]"I personally feel that buyers are going to increase their exhaustion buying dumps. Also Minimum Wage Hike hasn't hit fast enough for the little guppies to nibble up all the Whale crumbs.. As things sink down toward the inevitable abyss."
"Noobs please try to understand some people have had bags bigger and longer than you."
(Placer note Emoticon Shoulder Shrug) 🤷♂️ #Fixed
What are your thoughts? Is it bad that people like to realize gains say "Cool! More Dollars now!"
-No advice to give just thoughts that I can't shake after the last 6 years in the world of "CRYPTO"
"KEEP CALM AND MANAGE THY RISK!"


ETHEUR bearish short-term scenarioHello traders,
Two triangles have been forming recently: the first one since March 8th around 1400 EUR, and the second one since March 9. The former is a symmetrical triangle, while the latter is a flat bottom triangle. As chart displays, the former is not that clear, while the flat bottomed (drawn in blue) is more evident.
In terms of pricing, considering the height of this flat-bottomed triangle, prices could potentially dip up to 1380 EUR, which coincides with the resistance configured by the inverted head & shoulders pattern, formed and fulfilled on late February. However, one should also consider 1420 EUR as a consolidated resistance in the case the pattern that goes from February 23 to March 05 is a flat top triangle.
If you find this analysis useful, please like, comment, or donate


ETH looks dumpy afThere are many new copies of ETH coming out with cheap access to the EVM, price of ETH will plummet

ETHEUR bearish symmetric triangle and flat bottom triangleBad news for those of us who were expecting an immediate rebound. A symmetric triangle (blue triangle) has forming since February 23rd, with base around 1253 EUR and top at 1423 EUR. It's final confirmation would be when rebounding at 1309 - 1314 EUR. Depending on the way you consider its height, the expected drop would be around 1145 EUR.
In addition, a flat bottom triangle that has been forming since February 24th would strengthen the idea of a bearish trend. Projecting its height, we're locating prices at the same level as the symmetric triangle.
Let us also remember that the previous minimum, located at 1115 EUR, is the result of a previously identified ascending wedge, whose height is also projected on this chart, though pushing prices down to 1105 and 1069 EUR respectively.

ETHEUR ascending wedgeAfter a discrete recovery from it's recent correction, ETHEUR formed and confirmed a rising wedge with a tip on 1328 EUR and a confirmation rebound on 1300 EUR. Depending the height of the wedge you'd consider, the drop would reach 1200 to 1140 EUR. It would be reasonable to set a stop loss on 1365 EUR if the figure is wrong!

ETHEREUM FALLING SOON hello traders ,
Welcome to my price forecast Ethereum/usd.
Ethereum is moving inside upward channel.
there are basically three types of channel directions,
one is upward slopping channel which 80 - 90 % of the time break downside
second is downward slopping channel which 80 - 90 % of the times break upside .
third one is side ways which means market unable to decide the direction and
we can trade inside channel with the help of price action.
now what is price action ?
price action is vast topic but it include candlesticks, support resistance, moving average etc
so here we see in Ethereum price is in upward channel and hopefully it will break downside .
our target is at support level for now .
and we also see bearish divergence which confirms its upcoming fall.
safe entry is after blue line break.
Thanks for watching my idea , have a green day ..

ETHEREUM Breaks Down To Test Previous Levels? $1440 Target Supp!Hi Everyone,
As many of you would be aware I'm pretty bullish on Ethereum and Bitcoin for the later half of 2021 but with the recent week of incredible gains comes the inevitable profit taking selloff. Lets take a look at this $1,440 level for instance. This level was previously triple resistance and should now act as support when intersecting with the 20 moving average on the daily.
Good Luck this week,
Tom
PS. If you are interested in finding out more about our courses check them out at www.fxevolution.com
