ETHUSD 45-Min Chart — Counter-Trend Long From Demand After Major
Chart Analysis:
Market Structure:
Ethereum broke decisively below the 2,855 resistance zone, confirming a bearish structure shift. The move down was impulsive, followed by weak consolidation — classic distribution → continuation behavior.
Support / Demand Zone:
Price is reacting around 2,485–2,520, a highlighted demand area. This zone aligns with the first strong base formed after the sell-off, making it a high-interest reaction level.
Current Price Action:
ETH is printing long lower wicks into support, suggesting seller exhaustion and early dip-buying. However, structure is still bearish until a reclaim occurs.
Entry Logic:
The marked entry near ~2,490–2,510 assumes:
Support holds
A short-term higher low forms
Momentum flips on lower timeframes
Upside Targets:
TP1: ~2,690 (range equilibrium / liquidity grab)
TP2: ~2,740 (previous consolidation + minor resistance)
Final Target: ~2,855 major resistance (breakdown origin)
Invalidation:
A clean breakdown and close below 2,480 invalidates the long bias and opens continuation toward lower liquidity.
Bias Summary:
Trade Type: Counter-trend bounce
Risk Profile: Higher risk, higher R:R
Trend Context: Bearish until 2,855 is reclaimed
Ethereumsignals

ETHEREUM Massive H&S forming before total collapse.Ethereum (ETHUSD) has been currently forming the Right Shoulder of a Head and Shoulders (H&S) pattern. A technically bearish formation, this Right Shoulder is contained below the 1D MA200 (orange trend-line), which may be the final test point before rejection and initiation of the 2nd Stage of the Bear Cycle.
In any case, a break below the Higher Lows trend-line, which is the pattern's Support, kick-starts the next selling phase regardless. H&S patterns typically target the 2.0 Fibonacci extension from the Shoulder's Low, which interestingly enough sits exactly on the 1385 Support of the April 09 2025 Low! Natural expectation as we will be getting closer to the end of the year, is $1400 at least.
---
** Please LIKE 👍, FOLLOW ✅, SHARE 🙌 and COMMENT ✍ if you enjoy this idea! Also share your ideas and charts in the comments section below! This is best way to keep it relevant, support us, keep the content here free and allow the idea to reach as many people as possible. **
---
💸💸💸💸💸💸
👇 👇 👇 👇 👇 👇

ETHEREUM Will it make this strong bullish break-out?Ethereum (ETHUSD) is testing yet again its Lower Highs trend-line, which is the Resistance that started on the October 07 2025 All Time High (ATH). This has failed to break two times already, causing strong rejections but this time we may finally see it breaking.
The reason, apart from the bullish RSI on Higher Lows, is that today's 1D candle is so far finding support on the 1D MA50 for the first time since the downtrend started and if it closes above it, it will be a first.
The result can be a Channel Up, which technically is a Bear Flag inside the new Bear Cycle, whose potential symmetrical +31.47% Bullish Leg can target the 1D MA200 (orange trend-line) at 3600.
Why is the 1D MA200 so important? Because it's been the technical Target of every first Dead-cat-bounce during ETH's previous Bear Cycles.
---
** Please LIKE 👍, FOLLOW ✅, SHARE 🙌 and COMMENT ✍ if you enjoy this idea! Also share your ideas and charts in the comments section below! This is best way to keep it relevant, support us, keep the content here free and allow the idea to reach as many people as possible. **
---
💸💸💸💸💸💸
👇 👇 👇 👇 👇 👇

ETHEREUM HIGH PROBABILITY LONG SETUP SOON!!!🚨 ETHER HIGH PROBABILITY BUY SETUP 🚨
* Here We Can See Clearly The Next Potential Moves For ETHUSD Coming Hours/Days.
* Keep Your Eyes Close On Your Trading Positions.
* Happy PIP Hunting Traders.
FXKILLA.

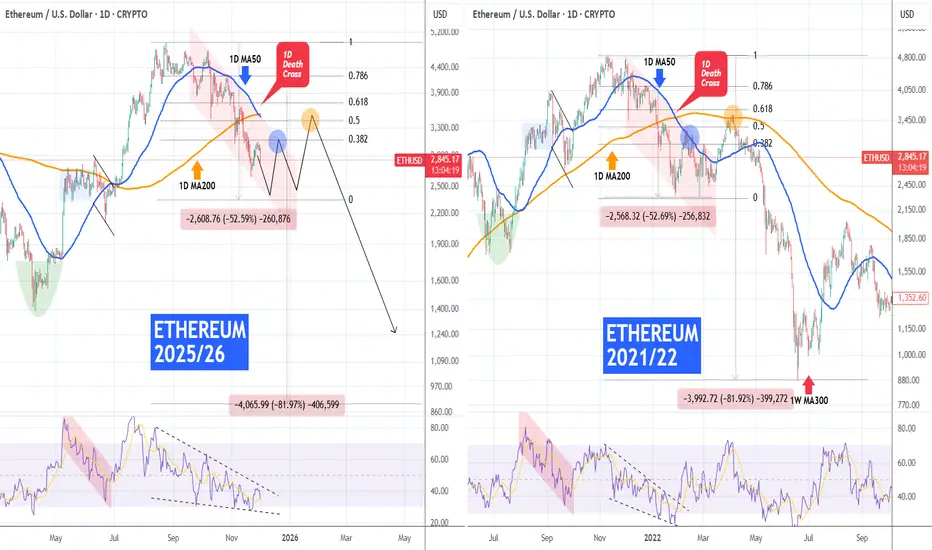
ETHEREUM made 1D Death Cross. Will it follow the 2022 BearCycle?Ethereum (ETHUSD) completed on Saturday its first 1D Death Cross in 9 months (since February 28 2025) and today the market is (so far) reacting violently to it with a strong sell-off.
The market didn't even manage to re-test its 1D MA50 (blue trend-line) on last week's rebound and if it follows the 2022 Bear Cycle, it may look for a bottom after completing a -52.50% decline from its Cycle Top. Technically, even the build up to the Cycle Top resembles the 2021/22 fractal and as you can see the similarities are even evident on their 1D RSI sequences.
As a result, if this 1st Bear Cycle wave for ETH bottoms around $2400, we could be expecting a first rebound to test the 1D MA50 (within the 0.382 - 0.5 Fibonacci range, i.e. around $3100) and get rejected, followed by one last to test the 1D MA200 (orange trend-line), within the 0.5 - 0.618 Fibonacci levels (i.e. above $3350) and get rejected to start the 2nd wave of the Bear Cycle.
Would you 'trust' this Bear Cycle build up?
---
** Please LIKE 👍, FOLLOW ✅, SHARE 🙌 and COMMENT ✍ if you enjoy this idea! Also share your ideas and charts in the comments section below! This is best way to keep it relevant, support us, keep the content here free and allow the idea to reach as many people as possible. **
---
💸💸💸💸💸💸
👇 👇 👇 👇 👇 👇
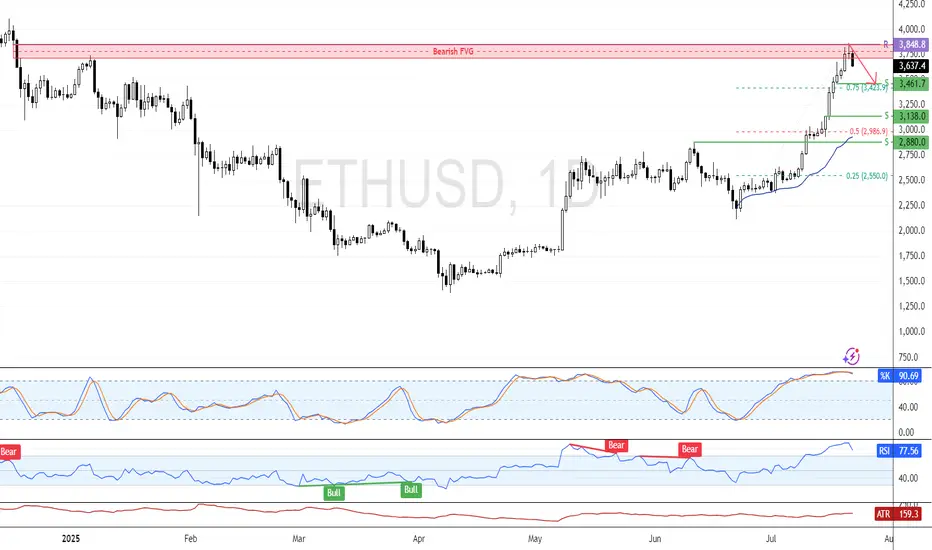
Ethereum Accumulates Below Key ResistanceFenzoFx—Ethereum remains bearish, trading near $3,078.00. Price is below $3,170.00, with a bearish fair value gap overhead and resistance at $3,371.00. Technical indicators show an oversold market with bullish divergence, and candlestick patterns suggest accumulation around this zone.
Despite the bearish setup, a short-term rise may occur to grab liquidity before the downtrend resumes. In this case, Ethereum could target the bearish gap and resistance at $3,371.00.

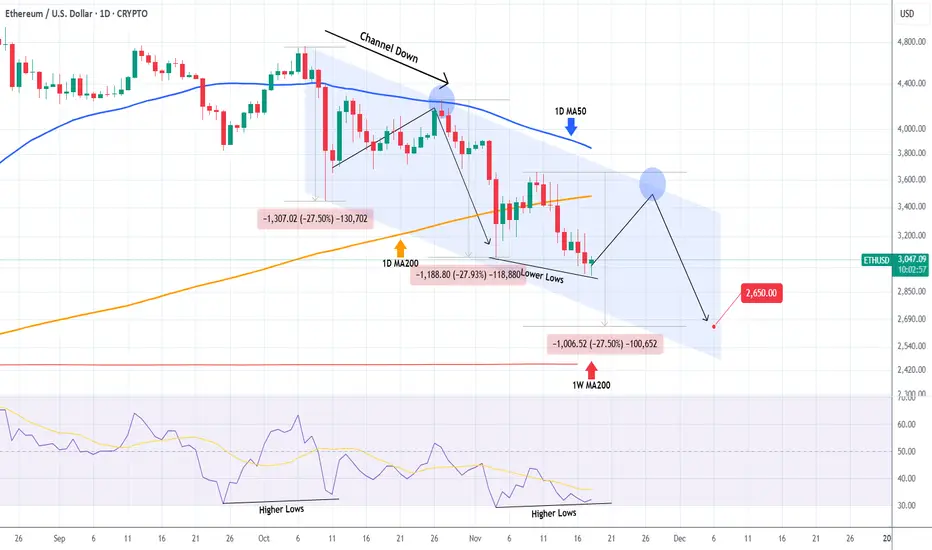
ETHEREUM Dead cat bounce incoming?Ethereum (ETHUSD) has been trading within a Channel Down since the October 07 High with both its Bearish Leg so far declining by -27.50% each.
As the 1D RSI is forming Higher Lows against the price's Lower Lows, i.e. a Bullish Divergence similar to October 11, it is possible to see a short-term bounce to test the 1D MA50 (blue trend-line) again (where the price got rejected on October 27), before it completes the -27.50% Bearish Leg projection.
The medium-term Target remains 2650.
---
** Please LIKE 👍, FOLLOW ✅, SHARE 🙌 and COMMENT ✍ if you enjoy this idea! Also share your ideas and charts in the comments section below! This is best way to keep it relevant, support us, keep the content here free and allow the idea to reach as many people as possible. **
---
💸💸💸💸💸💸
👇 👇 👇 👇 👇 👇
Ethereum Bear Flag Below $3,510FenzoFx—Ethereum remains below the $3,510.00 resistance and descending trendline, consolidating near $3,237.00 in a bear flag. The November 4 drop created a liquidity void with resistance at $3,673.00.
As long as ETH trades below this level, the bearish outlook holds. A breakdown could retest support at $3,040.00, and if selling pressure continues, the decline may extend toward the next liquidity void at $2,771.00.

ETHEREUM hit its 1W MA50. Can this save the Bull market?Ethereum (ETHUSD) just hit its 1W MA50 (blue trend-line) for the first time in 4 months since it broke above it on the week of July 07 2025. This pattern looks very similar to the 1W tests after the March 11 2025 and November 08 2021 Highs (latter as also a Cycle Top).
In both cases the 1W MA50 failed to hold as a Support (did also the same on the Jan 13 2025 test) and the price declined further completing -48% and -52% total drops respectively.
As a result, there are high probabilities currently for ETH to extend its decline by at least -48%, in which case it may reach $2600.
Based on the 1W RSI, the most probably level for a bounce is the 38.50 (RSI) level, which is the Symmetrical Support that initiated the rebounds of September 02 2024 and January 24 2022. The September 18 2023 and November 07 2022 Lows also came very close to it and rebounded.
-------------------------------------------------------------------------------
** Please LIKE 👍, FOLLOW ✅, SHARE 🙌 and COMMENT ✍ if you enjoy this idea! Also share your ideas and charts in the comments section below! This is best way to keep it relevant, support us, keep the content here free and allow the idea to reach as many people as possible. **
-------------------------------------------------------------------------------
💸💸💸💸💸💸
👇 👇 👇 👇 👇 👇

ETHEREUM Only the 1D MA50 can save the day.Ethereum (ETHUSD) marginally broke its 1W MA20 (red trend-line) on last Friday's flash crash and rebounded. The bullish continuation wasn't enough however to break above its 1D MA50 (blue trend-line) and so far it's been rejected.
This is the exact same reaction it had the last time it hit its 1W MA20 (June 22), technically the previous Higher Low of the Fibonacci Channel Up. Both crashes have been around -27%. It took the market some days of consolidation below the 1D MA50 but when it finally broke it, the new Bullish Leg was confirmed.
With a 1D RSI Bullish Divergence already under ETH's belt (Higher Lows against the price's Lower Lows), the market looks like it has bottomed but this can only be validated by a 1D MA50 break-out. The next Bullish Leg can lead ETH to a least $7150 (+108.31% rise similar to the first Bullish Leg).
A break and candle closing below the 1W MA20 however, opens the way to further decline towards the 1W MA100 (green trend-line, the natural long-term Support of the Bull Cycle) around $3050.
-------------------------------------------------------------------------------
** Please LIKE 👍, FOLLOW ✅, SHARE 🙌 and COMMENT ✍ if you enjoy this idea! Also share your ideas and charts in the comments section below! This is best way to keep it relevant, support us, keep the content here free and allow the idea to reach as many people as possible. **
-------------------------------------------------------------------------------
💸💸💸💸💸💸
👇 👇 👇 👇 👇 👇

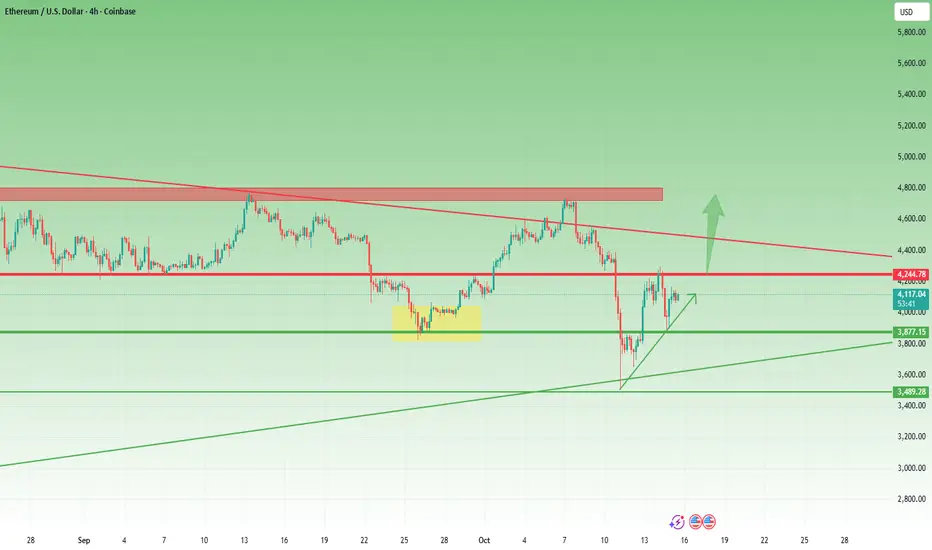
ETH: Technical Precision Amid the CrashIn spite of the crypto market crash, Ethereum actually moved very technically.
The break below the $4,300 support led to a drop toward the important $3,500 zone.
Although the price also broke below $3,850, a quick reversal followed — the rebound brought the price back above the $3,850 support and up to the $4,300 resistance.
A new wave of selling came next, but this time, the price stopped around the $3,850 support zone, confirming it as an important level.
A quick rebound followed, and now ETH is back above $4,000, trading around $4,100.
Also very important — the price of ETH is forming an ascending triangle, with resistance at $4,300.
A break above $4,300 will most likely accelerate gains toward the $4,900–$5,000 area, which is both a technical resistance and the target of the triangle.
I’m looking to buy on dips, preferably below $4,000, and considering the mentioned target, such a setup offers around a 1:3 or even 1:4 risk-reward ratio.
Volatility Rises as ETH Tests SupportFenzoFx—Ethereum rejected resistance at $4,233.00, aligned with the bearish fair value gap. Friday’s selloff widened the trading range, increasing risk for ETH traders.
The trend remains bearish while price stays below $4,233.0. Critical support lies at $3,825.0. If ETH closes below this level again, the downtrend may escalate toward $3,368.0. Traders should approach cautiously, as the market is in an uncertain phase with potential for volatile price swings.

Ethereum Pulls Back After Liquidity TapFenzoFx—Ethereum tapped liquidity above the equal highs at $4,233.00 and now trades around $4,190.0, down 0.60% today. Despite the move, the volume profile didn’t form a new high, signaling bearish bias.
Immediate support lies at $4,130.0. A close below this level may trigger further downside toward $4,034.0. If selling pressure continues, ETH could decline to the recent lows at $3,825.0. The bearish outlook remains valid below $4,250.0, which must be breached and held to invalidate it.

Ethereum Tests Key Support at $4,535FenzoFx—Ethereum’s downtrend eased after hitting the bullish breaker at $4,425.00. It currently trades near $4,540.00, down 1.00% today. Immediate support lies at $4,535.00. A close below this level could extend the decline toward the equal lows at $4,425.00 and possibly $4,240.00.
The bearish outlook remains unless Ethereum exceeds $4,700.00 and closes above the bearish fair value gap.

ETHEREUM Is it realistic to expect last Cycle's rally?Ethereum (ETHUSD) has been practically consolidating since the mid-August High, following an impressive rally on the April 07 Low. Technically it is coming off a 1W MA50/100 Bullish Cross.
It is the exact same pattern that confirmed ETH's massive parabolic rise (green Channel Up) during the previous Cycle in August 17 2020. The 1W RSI fractals between the two sequences are similar.
However, time-wise we are not in the same stage as last Cycle, in fact we are much closer to the end of the 4-year Cycle model. If there is still some time to repeat such a parabolic run, the price is 'limited' by the 1.618 Fibonacci extension at $13500, which again will be a wonderful and increasingly optimistic target for this Cycle Top.
Do you think it is realistic to expect such repeat at this stage?
-------------------------------------------------------------------------------
** Please LIKE 👍, FOLLOW ✅, SHARE 🙌 and COMMENT ✍ if you enjoy this idea! Also share your ideas and charts in the comments section below! This is best way to keep it relevant, support us, keep the content here free and allow the idea to reach as many people as possible. **
-------------------------------------------------------------------------------
💸💸💸💸💸💸
👇 👇 👇 👇 👇 👇

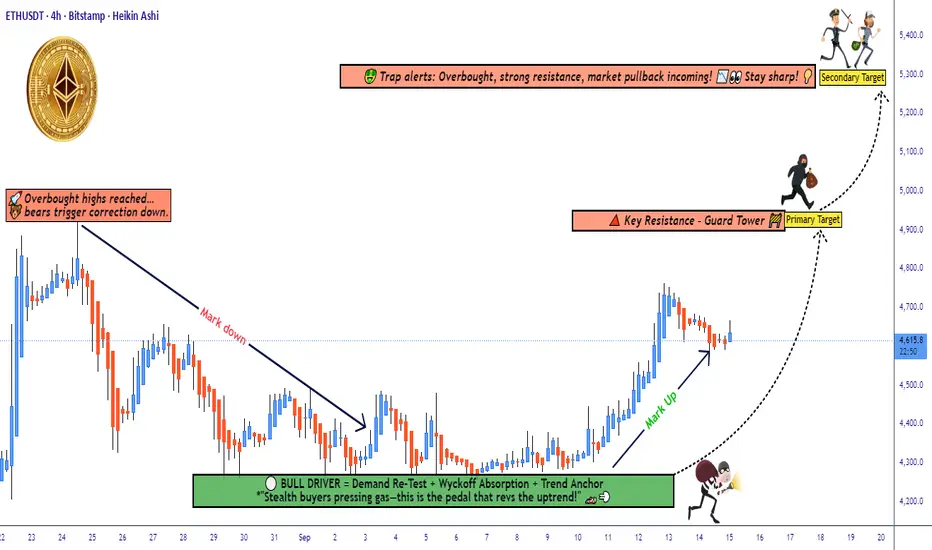
ETH/USDT Technical Outlook: Demand Layer Entries vs Trap Risk🚀 ETH/USDT | Ethereum vs Tether 💎
Crypto Market Money Looting Plan (Swing/Day Trade)
📌 Trade Plan (Bullish Outlook)
Setup: Demand Re-Test ✅ + Wyckoff Absorption 🔑 + Trend Anchor ⚓ (buyers confirmed presence)
Entry Style (Thief Layers 🪙): Using layered limit entries — examples: 4500, 4550, 4600, 4650 (you can add more layers as per your own method).
Stop-Loss (Protect the Vault 🔒): Example zone near 4400 after breakout. Adjust SL to fit your own risk appetite & personal strategy.
Target 🎯:
🎯 Primary: 4900 (local resistance)
🎯 Secondary: 5300 (major resistance / overbought zone)
🧾 Notes for Thief OG’s
This plan is not financial advice, only an idea. Always manage your own entries, SL, and TP.
Think of it as a vault strategy: take money, then protect money.
🔗 Related Pairs to Watch
BINANCE:BTCUSDT → ETH often follows BTC’s momentum. A BTC breakout/false move can affect ETH.
BINANCE:ETHBTC → Good pair to confirm ETH’s relative strength vs BTC.
BINANCE:SOLUSDT & BINANCE:BNBUSDT → Correlated majors; watch for rotation of capital in altcoins.
✨ “If you find value in my analysis, a 👍 and 🚀 boost is much appreciated — it helps me share more setups with the community!”
#ETH #Ethereum #Crypto #USDT #Altcoins #SwingTrade #DayTrading #LayerStrategy #Wyckoff #ThiefPlan #TradingView #CryptoTrading
Ethereum Accumulation and Bullish SetupEthereum is currently trading sideways, indicating an accumulation phase. On Monday, price swept equal lows and formed a long-wick bullish candlestick. The 4-hour chart shows two engulfing candles that cleared liquidity on both sides.
Technically, the market remains bullish and is consolidating. If momentum continues, ETH/USD may target the equal highs near $4,500. A confirmed close above the immediate support at $4,384 would validate this bullish outlook.

Ethereum Eyes Resistance Amid Bearish OutlookFenzoFx—Ethereum is consolidating after forming a triple bottom at equal lows of $4,207.0. It recently tapped the mean threshold of the inverted fair value gap near $4,400.0. Momentum picked up after ETH swept liquidity below $4,257.0, suggesting a potential move toward equal highs at $4,516.0.
However, this uptick doesn’t signal a market structure shift. The broader outlook remains bearish until Ethereum revisits the equal lows at $4,207.0, where significant stop orders have accumulated, especially since Monday.

Ethereum inches toward $5K as Standard Chartered sees $7,500Ethereum inches toward $5K as Standard Chartered sees $7,500 in 2025
Apparently Standard Chartered has sharply raised its year-end 2025 price forecast for Ethereum to $7,500, according to reports from crypto news outlets including CryptoRank and BlockNews.
ETH recently broke above $4,000 and is now just 5% away from the $5,000 mark, which would set a new all-time high.
On the 30-minute chart, price is holding in a tight range near recent highs, showing that buyers are potentially still in control but lacking immediate momentum. Short-term support might sits around $4,650, with stronger support near $4,580.
Looking beyond 2025, Standard Chartered reportedly expects Ethereum to continue climbing, projecting $12,000 in 2026, $18,000 in 2027, and $25,000 by 2028.

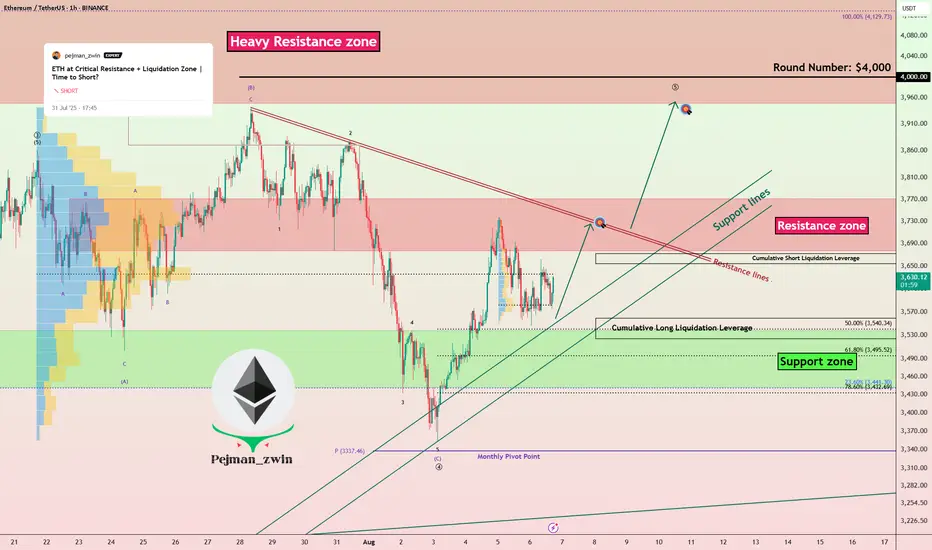
Ethereum Ready to Attack Resistances — Time to Long ETH?Ethereum ( BINANCE:ETHUSDT ) fell to the Support zone($3,538-$3,442) and Support lines as I expected in the previous idea .
Ethereum is currently trading near the Support zone($3,538-$3,442) , Support lines , and Cumulative Long Liquidation Leverage($3,559-$3,524) .
In terms of Elliott Wave theory , it seems that Ethereum has completed the main wave 4 . The main wave 4 has an Expanding Flat structure(ABC/3-3-5) . To confirm the main wave 4, we must wait for the Resistance zone($3,771-$3,677) and Resistance lines to be broken.
I expect Ethereum to trend higher in the coming hours and attack the Resistance lines and Resistance zone($3,771-$3,677) .
Cumulative Short Liquidation Leverage: $3,672-$3,645
Note: Stop Loss: $3,450 =Worst
Please respect each other's ideas and express them politely if you agree or disagree.
Ethereum Analyze (ETHUSDT), 1-hour time frame.
Be sure to follow the updated ideas.
Do not forget to put a Stop loss for your positions (For every position you want to open).
Please follow your strategy and updates; this is just my Idea, and I will gladly see your ideas in this post.
Please do not forget the ✅' like '✅ button 🙏😊 & Share it with your friends; thanks, and Trade safe.
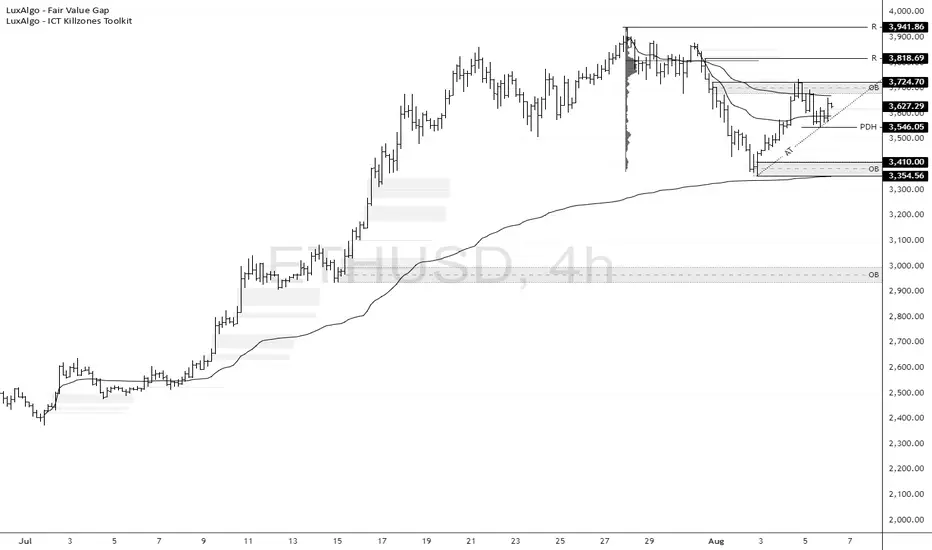
ETH/USD Rebounds, Faces Key ResistanceFenzoFx—Ethereum rebounded from the previous day's low, now trading near $3,639.0. This level contains an order block that triggered bearish reactions earlier this week.
The trend remains bullish as price holds above the VWAP from July 1st. A close above $3,724.0 is needed to confirm continuation.
If bullish momentum holds, ETH may target $3,818.0 and $3,941.0. However, a drop below $3,546.0 would invalidate the bullish outlook. In that case, ETH/USD could revisit $3,410.0 and $3,354.0.
ETHEREUM Massive Triangle break-out ahead??Ethereum (ETHUSD) has been trading within a 4-year Triangle for the entirety of this Cycle. The recent post April rally has been the most aggressive since the parabolic rally that led to the Top of the previous Cycle.
The price is now almost on the top (Lower Highs trend-line) of the Triangle. A break above it, can initiate an aggressive Bullish Leg towards the 1.618 Fibonacci extension ($8000), which was the level that was marginally exceeded during ETH's first rally of this Cycle.
-------------------------------------------------------------------------------
** Please LIKE 👍, FOLLOW ✅, SHARE 🙌 and COMMENT ✍ if you enjoy this idea! Also share your ideas and charts in the comments section below! This is best way to keep it relevant, support us, keep the content here free and allow the idea to reach as many people as possible. **
-------------------------------------------------------------------------------
💸💸💸💸💸💸
👇 👇 👇 👇 👇 👇

ETH Eyes Consolidation from Overbought ZoneFenzoFx—Ethereum pulled back from the daily bearish FVG. The recent candle closed with a long wick and flat body, reflecting market uncertainty. Momentum indicators remain in overbought territory, signaling a possible consolidation phase.
If resistance at $3,848.0 holds, the price may decline toward support at $3,461. However, the bullish outlook stays valid as long as ETH/USD holds above $3,848.0.