ETHUSD formed bullish Butterfly | A good long opportunityPriceline of Ethereum / US Dollar cryptocurrency has formed a bullish Butterfly pattern and entered in potential reversal zone.
This PRZ area should be used as stop loss in case of complete candle stick closes below this zone.
I have used Fibonacci sequence to set the targets:
Buy between: 177.33 to 173.24
Sell between: 180.50 to 188.12
Regards,
Atif Akbar (moon333)
Ethereumusdt

ETHEREUM - TODAY - MARKET UPDATE - 11/15/2019ETH slipped beneath 180.71, dismissing the wave (Y) triangle, and the decline is likely to continue toward the highlighted target area.
Potential downside targets lie at 173.46, 170.76 and 163.67.
That area includes where wave will retrace 61.8% of the wave advance.
A zigzag unfolding for wave (Y) is expected to at least test the 173.86 lowm to complete wave ** **
A breach of 189.31 will give us reason to consider alternate wave scenarios and the possibility that wave
Keep you updated as this price evolves.
We go together
Together we are stronger
Share and like
I am not Bearish long term. I am a Bull of Bulls.
Thanks
God bless you!
===============================================================================
**BlackMEX PRO Traders - PREMIUM**
We are a BITMEX specialized channel.
Our philosophy focuses on capital preservation and good risk/return operations.
We'll share our analysis, calls, and share studies that can help you be a better trader.
Enjoy! ** 2 weeks free sign up
Telegram > t.me
===============================================================================
Twitter > twitter.com
===============================================================================

ETHUSD formed bullish Cypher | A good long opportunityPriceline of Ethereum / US Dollar cryptocurrency is has formed a bullish Cypher pattern and entered in potential reversal zone.
This PRZ area should be used as stop loss point in case of complete candle stick closes below this area.
I have used Fibonacci sequence to set the targets:
Buy between: 185.13 to 182.57
Sell between: 187.15 to 191.95
Regards,
Atif Akbar (moon333)

ETHUSD formed bullish Butterfly | A long opportunityPriceline of Ethereum / US Dollar cryptocurrency has formed a bullish Butterfly pattern and entered in potential reversal zone.
This PRZ area should be used as stop loss in case of complete candle stick closes below this zone.
I have used Fibonacci sequence to set the targets:
Buy between: 181.73 to 180.32
Sell between: 182.82 to 185.47
Regards,
Atif Akbar (moon333)

ETHUSD formed bullish Shark | Upto 25% potential movePriceline of Ethereum / US Dollar cryptocurrency is has formed a bullish Shark pattern and entered in potential reversal zone.
This PRZ area should be used as stop loss point in case of complete candle stick closes below this area.
I have used Fibonacci sequence to set the targets:
Buy between: 156.93 to 148.77
Sell between: 167.54 to 187.39
Regards,
Atif Akbar (moon333)

ETHUSD formed bullish BAT | A buying opportunityPriceline of Ethereum / US Dollar cryptocurrency is forming a bullish BAT pattern and entered in potential reversal zone.
This PRZ area should be used as stop loss point in case of complete candle stick closes below this area.
I have used Fibonacci sequence to set the targets:
Buy between: 172.84 to 166.91
Sell between: 174.42 to 182.35
Regards,
Atif Akbar (moon333)

ETHUSD formed bullish Crab | Upto 15% expectedThe priceline of Ethereum / US Dollar has formed a bullish Crab pattern and entered in potential reversal zone.
This PRZ area should be used as stop loss point in case of complete candle stick closes below this zone.
I have used Fibonacci sequence to set the targets:
Buy between: 196.10 to 188.24
Sell between: 202.20 to 216.97
Regards,
Atif Akbar (moon333)

ETHUSD forming a bullish shark | 12% potential short term tradeBy the grace of Allah the most high like always my previous chart of short term trade is also executed successfully:
Now on day chart after formation of successful bullish butterfly pattern the price action has started the formation of bullish Shark pattern, sofar all fibonacci sequence is going good as required for shark now the formation of last leg is in process and I am expecting that it will be also formed accordingly and soon the priceline will be entered in potential reversal zone.
The PRZ area should be used a stop loss zone if a complete candle stick will be closed below this area.
Volume profile of complete pattern is showing less interest of traders at this area.
But Stochastic is bearish and giving bear cross and MACD is turned weak bullish from strong bullish, so here I would suggest to wait for MACD to turn back strong bullish or if the MACD will be turned strong bearish then wait for to turn it back to weak bearish or wait for bull cross from stochastic then take the long position.
I have used Fibonacci sequence to set the targets:
Buy between: 166.30 to 161.63
Sell between: 171.16 to 181.23
Enjoy your profits and Regards,
Atif Akbar (moon333)

ETHUSD forming a bullish gartley | A good long opportunityPriceline of Ethereum / US Dollar is forming a bullish gartley and soon it will be entered in potential reversal zone insha Allah.
We have a golden cross formation expected below the PRZ are between 100 simple moving average and 200SMA.
I have used Fibonacci sequence to set the targets:
Buy between: 180.27 to 178.55
Sell between: 181.61 to 184.85
Regards,
Atif Akbar (moon333)

ETHUSD formed bullish BAT | A good long opportunityPriceline of Ethereum / US Dollar cryptocurrency has formed a bullish BAT pattern and entered in potential reversal zone.
I have defined the targets using Fibonacci sequence:
Buy between: 175.64 to 174.67
Sell between: 177.96 to 181.45
Regards,
Atif Akbar (moon333)

ETHUSD formed bullish butterfly | Upto 24% possiblePriceline of Ethereum / US Dollar cryptocurrency has formed a bullish butterfly and entering in potential reversal zone.
I have defined targets using Fibonacci as below:
Buy between: 166.18 to 155.82
Sell between: 174.15 to 193.91
Regards,
Atif Akbar (moon333)

ETHUSD has formed bullish gartley | A good long opportunityPriceline of Ethereum / US Dollar has formed a bullish gartley and entered in potential reversal zone.
I have defined targets using Fibonacci sequence:
Buy between: 185.56 to 180.57
Sell between: 189.50 to 199.09
Regards,
Atif Akbar (moon333)

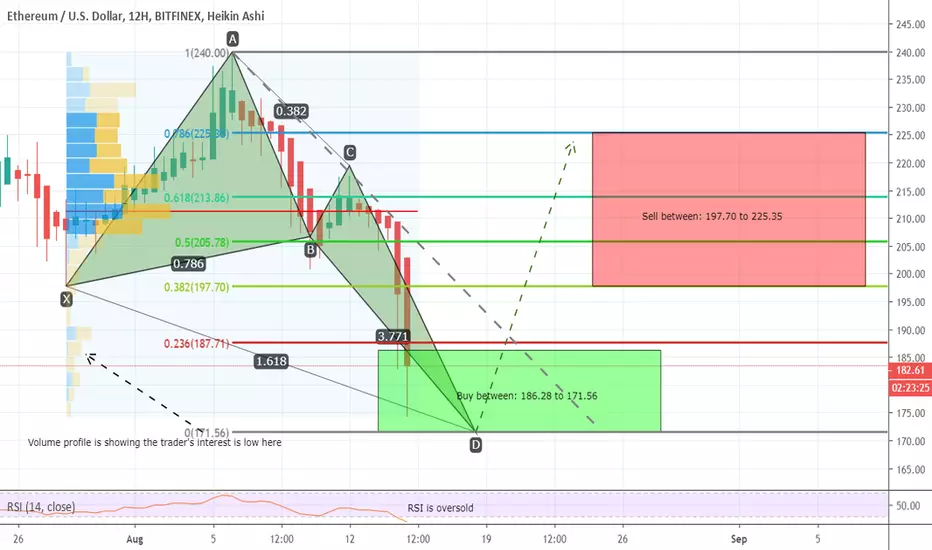
ETHUSD has formed bullish butterfly | Upto 31% profit potentialPriceline of Ethereum / US Dollar has formed a bullish butterfly and entered in potential reversal zone.
RSI is oversold.
Volume profile of complete pattern is showing less interest of traders at PRZ area.
I have usded Fibonacci sequence to set the targets and those targets are as below:
Buy between: 186.28 to 171.56
Sell between: 197.70 to 225.35
The MACD is strong bearish therefore I would suggest to take long position after when atleast 6hr MACD's histogram gives weak bearish signals.
Regards,
Atif Akbar (moon333)
ETHUSD hits the wedge support a good long opportunityThe priceline of Ethereum / US DOLLAR hits the support of wedge after 28 July 19.
MACD is turning bullish.
RSI is oversold and turning bullish.
Stochastic has given bull cross.
I have defined sell targets using Fibonacci sequence as below:
Sell between: 218.76 to 230.89
Regards,
Atif Akbar (moon333)


Ethereum/Tether (July 24) #ETH $ETH #USDT $USDTETH is moving in a falling wedge but I don't think it will pump hard. It will come to 225$ but I think you should sell here to protect your money and profit.
I need to wait for breakout from 235$ for further targets


Ethereum/Tether (14 May) #ETH $ETH #USDT $USDTWe have succeeded with the last ETH signal. However, the market is becoming more active and making ETH grow beyond my expectation
Currently ETH has broken the Rising Wedge formation but it needs to get over 200$ zone otherwise the Wolfe wave will kill us
If ETH falls to 190$, it will continue to fall back to 170$
If ETH can sustain over 200$, target must be 240$


ETHUSD - 1D Chart AnalysisBased on the market capitalization which has started to recover from the ground which was lost, the Ethereum also followed the rest of the coins and it's price has increased with 64.21% since the 14th of December (from 82.99$ to 136.28$).
The bullish trend has "officially" started on the 18th of December, as soon as the price has crossed the 20 days Moving Average at the value of 109.49$ and in the meantime the price has also reached the upper standard deviation of the Bollinger Bands, meaning that the price got close to the "overbought" area.
Looking to the other technical indicators we can see that the RSI is only 61, the Stochastics are above the level of 80 but there is no crossover yet and also the MACD is still above the Signal, meaning that there is still more room for the price to increase.
In these circumstances, as long as the trading volumes will remain the same, the next level which can be considered a cautious target price for the following 1-2 days is the Resistance Level 2 at 146.19$.


ETHUSD - 1D Chart AnalysisFollowing the aggressive movements when the whole market has dropped, the price of Ethereum has started it's sideways movements since the 23rd of November.
The Pivot Level (or the average price) for this interval is 116.88 and at this stage the coin is traded nearly below it.
Considering the RSI's level of 29 (oversold), the Stockastic's crossover below the level of 20 and the MACD which has just crossed the Signal, it is possible to see the price having a slight increase at least above the Pivot with a possible target price of 13.73$ in extension.
But the expectations shouldn't be that high as long as the trading volumes are quite low and a 19$ movement of the price was not registered since the 25th of November.

ETH/USD, downtrend under 100 $Hi guys !
Today i shared an analysis on ETHUSD.
Ethereum looks not good and not ready to go up !
Currently, the last hope is the yellow uptrend from may 2017, now ETH looks use it to bounce and resist to lower prices, but i think it'll not enough.
For me, a big downtrend is formatting since the highest prices (more than 1000$, yes i know it was the good time) and can push Ethereum's price to 100 $ or less !
That's only my point of view, but for me it's really not the good time to buy more ETH.
Furthermore, RSI signal is on downtrend mode too and isn't a good thing.
The next weeks will be very interesting and important for everyone !
Thanks for your time.
