#ETH/USDT — Descending Wedge & High R/R Zone#ETH
The price is moving within a descending channel on the hourly timeframe. It has reached the lower boundary and is heading towards a breakout, with a retest of the upper boundary expected.
The Relative Strength Index (RSI) is showing a downward trend, approaching the lower boundary, and an upward bounce is anticipated.
There is a key support zone in green at 2912, and the price has bounced from this level several times. Another bounce is expected.
The indicator is showing a trend towards consolidation above the 100-period moving average, which we are approaching, supporting the upward move.
Entry Price: 2956
First Target: 3021
Second Target: 3092
Third Target: 3160
Stop Loss: Below the green support zone.
Remember this simple thing: Money management.
For any questions, please leave a comment.
Thank you.
Ethidea

#ETH/USD Buy Trade Setup.Here’s an up-to-date ETH/USD Buy trade outlook (technical + fundamental) to help you assess whether positioning for a Upside makes sense right now.
Thank You......

Ethereum $ETH weekly demand level at $2,879 is holdingEthereum CRYPTOCAP:ETH weekly demand level at $2,879 is holding as expected for now. There are signs of new bullish impulses in the smaller timeframes. Let's see if ETH cryptocurrency wants to rally higher from this demand level.

ETH | TRADE ANALYSIS📌 Trade Setup:
* Entry Level: 3,071
* Stop Loss: 3,026
* Target: 3,155
ETH is holding above an important intraday support zone, showing signs of renewed buyer interest. Momentum is gradually shifting upward, and if price sustains above the entry zone, a push toward the target area becomes likely. This setup focuses on short-term strength, with clear levels for controlled risk.
Disclaimer: This is not financial advice; it reflects only my personal market analysis. Please do your own research before trading.

ETH Trade Plan (December 12, 2025)ETH Trade Plan (December 12, 2025)
(D1 / H4 / H1 / M15)
⬛️ 1. Higher Timeframe Context (D1 and H4)
• D1 bias: bullish
• D1 range (approx): $3,000 – $3,500
• Key D1 zones:
• Supply: $3,450–$3,500
• Demand: $3,000–$3,192
• H4 bias: buy dips
• H4 zones of interest:
• H4 Sell Zone 1: – previous highs
• H4 Buy Zone 1: – support cluster
Active setups trend-aligned.
⬛️ 2. Preferred Setups by Horizon
🔳 2.1 Swing Setup (D1/H4)
• Idea: Buy dips to $3,192 (trend-aligned).
• Time horizon: multi-day.
• Context: On-chain + macro.
🔲 2.2 Intraday Setup (H1 focus)
• Idea: Long above $3,250.
• Time horizon: intraday.
• Context: Impulse regime.
▫️ 2.3 Scalp Setup (M15 focus)
• Idea: Buy pullbacks with absorption.
• Time horizon: minutes–hours.
▪️ 2.4 Arbitrage/Pairs Concept
• None.
⬛️ 3. Entry Zones and Triggers
🟩 3.1 Long Setup (Trend-Aligned)
• Execution timeframe: H1
• Trigger timeframe: M15
• Entry zone:
• Context: H4 demand.
• Pattern tags:
Trigger conditions:
• Hold support + positive delta.
• ML-Predictive (15m): upside ≥ downside.
• Risk not extreme.
🔴 4. Stops (Invalidation Levels)
Long setups:
• Stop: $3,100.
• Logic: Demand break.
🟢 5. Targets
Long:
• TP1: $3,300 – H1 level.
• TP2: $3,450 – H4 supply.
• TP3 (optional): $3,500 – D1 objective.
⬛️ 6. Position Sizing
• Baseline risk:
• Trend-aligned: 1.0.
• Adjust: medium uncertainty (Fed).
Final: 0.7 for long.
⬛️ 7. Risk Flags
• Fed event.
• Put skew.
• Mixed flows.
⬛️ 8. Flip Conditions
• Long to bear: Below $3,192 + sell delta.
⬛️ 9. Alternative Scenario
Rejection at $3,450: short zone $3,400–$3,450, stop $3,500, targets $3,300/$3,192. Failed break vs continuation.
⬛️ 10. Model Self-Critique
• Assumptions: Rally on macro, no surprise.
• Vulnerabilities: Risk-off.
• Do not overleverage pre-event.
⬛️ 11. Uncertainty and Constraints
• Uncertainty.level: medium.
• Avoid leverage, require confirmation.

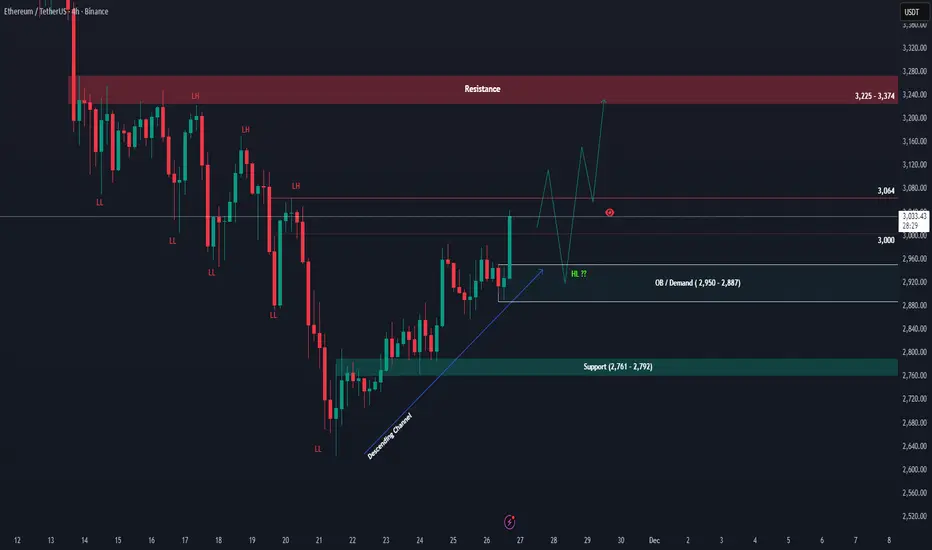
ETH Is Quietly Setting Up a Massive Reversal — Don’t Miss This!ETH 4H & Daily Outlook Update
ETH continues to follow the broader plan we've been watching over the last few days. After tapping the monthly demand zone, price reacted strongly and rebounded from the daily order block, confirming that the higher-timeframe accumulation area is still holding well. This zone remains the key foundation for ETH’s medium-term structure.
On the 4H timeframe, the trend is still technically bearish, with a series of lower highs visible. Price is now testing the supply zone and sitting right around the previous lower low at 3,064. If ETH can break and hold above this level, it would be the first meaningful sign of a trend shift, opening the door for a move toward the major resistance band at 3,225 – 3,374.
If buyers can push higher, a pullback into support or even a revisit of the 2,950 – 2,887 order block is still likely, forming a higher low before continuation. As long as this OB area remains intact, ETH maintains a strong chance to extend upward and retest the resistance zone. But if this OB breaks, the structure weakens and price could slide back toward the deeper support at 2,761 – 2,792.
Overall, ETH returning to the monthly OB was a healthy reset. As long as this region is protected, the higher-timeframe accumulation narrative remains valid.
ETH idea 12.11.2025On this market, I see the potential of the two closest scenarios, on the one hand, a short at the level of 3900-4000, where I would like to see the sfp above the previous high, and then a long one, which I would like when it falls below the wall at the price of 3180


Continuation of the previous idea based on the Harmonious EnergyThe consolidation phase is coming to an end. The market structure is gradually moving into the next stage of the energy cycle, where a new flow direction is forming.
At the moment, I am observing a continuation of the energy movement with a noticeable manifestation of buyer strength. The key focus is on price behaviour near the resistance level — this is where it will become clear whether buyers will be able to maintain control and continue the upward momentum, or whether the market will enter a redistribution phase.
According to the GPE concept, this moment reflects the transition from balance to energy release — when the accumulated potential turns into real movement.
📌 Observation: price reaction to resistance and confirmation of the flow's strength.
💬 If you have any questions or would like to discuss the idea in more detail, I am always open to dialogue.

Trading idea based on the Harmonious Energy Flow (HEF) conceptAt the current stage, there is a clear manifestation of buyers’ strength, even though the market environment is changing rapidly without any significant price movement. This forms a state of consolidation, where energy is being accumulated for the next impulse.
According to the HEF concept, consolidation represents a transitional phase — the market is searching for balance before initiating a new wave of directional movement. My current expectation is focused on the moment of breakout from consolidation, when the market will reveal the true side of strength.
📌 Main focus: observing how buyers maintain their advantage within this narrow structure and waiting for a signal confirming the exit from balance.
If you find my charting approach interesting, you are welcome to connect and discuss further. I’m open to communication and collaboration.
Would you like me to refine this version for maximum stylistic alignment with TradingView’s publication tone (slightly shorter, more analytical, and visually structured)?
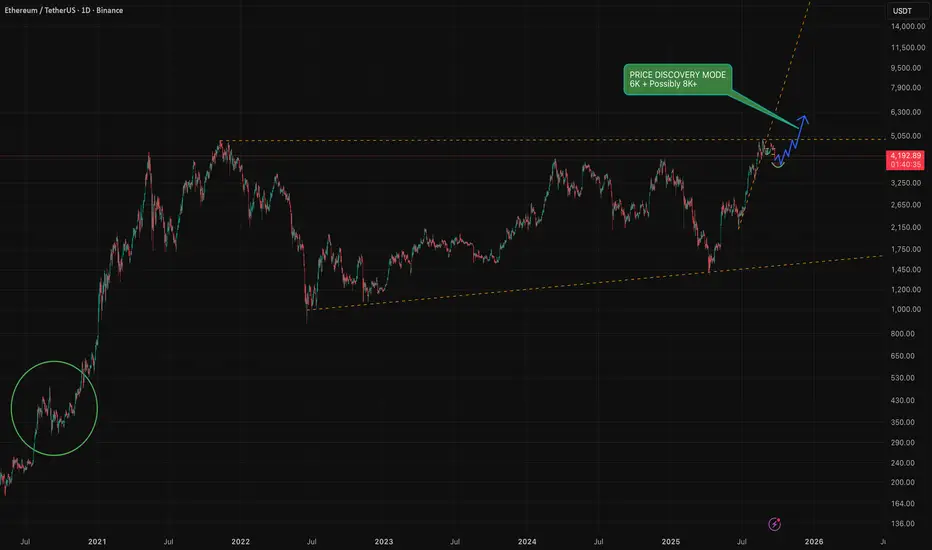
ETH Top / all time high In my earlier analysis I predicted the 2020 September happening again and it is happening as you are reading this.
From the chart and my analysis I can see ETH topping out around 6.8K this run !
I know, we are all hoping for 12K this BullRun and more but personally I am taking out profits around 6K slowly until the top hits and see a clear reversal.

History doesn't repeat but RHYMES ! I highly recommend everyone to have look at September 2020
I personally think that this will be the same scenario where we will have some fake-outs to drive the retails out / liquidate then the price will carry on upwards and go into price discovery mode where we are more likely to see 6K and hopefully more, if the volume and kicks in the ETF's and more retail pump we can see somewhere between 8K to 12K ( Optimistically )
I personally will be taking profits along the way tho and not going to wait for the top as we all know no one can predict the top nor the bottom !
Thank you all for reading my idea and feel free to share yours here in the comments.
To get access to my indicators please join the FREE tg channel, link in my BIO !
$BMNR - Cup & Handle Formation $215 Price TargetA major cup and handle pattern is forming. Watch for breakout level around the 64-ish level. Once breakout occur, use the Fib extension overlay for price objective that can range from $81 to $215. This is a very bullish setup happening.

ETHUSDT ETHEthereum has shown bullish strength in recent weeks and has formed several positive patterns. I believe it will target the $8,500 level after breaking the top at $4,900.

Ethereum Ready to Moon?––Bullish Trade Plan to $5K+
# 🚀 ETHEREUM BULLISH TRADE SETUP 🚀
💎 ETH Long Targeting \$5,090–\$5,800 | Risk-Defined Play 🎯
📊 **TRADE DETAILS**
🎯 Instrument: **ETH**
📈 Direction: **LONG**
💰 Entry Price: **\$4,773.95**
🛑 Stop Loss: **\$4,640.00**
🎯 Take Profit: **\$5,090 → \$5,300 → \$5,800**
📊 Size: **1% Risk**
💪 Confidence: **65%**
⏰ Entry Timing: **Market Open**
⚡ **Rationale:**
✅ Price > Key MAs (20/50/200) → Multi-timeframe bullish structure
✅ RSI/MACD show momentum with room to run
✅ Reward/Risk \~ 2.5:1 toward \$5,090+
⚠️ Risk: Low volume rally + BTC correlation
📌 **Plan:** Scale in near 4,760–4,800 → Target breakout toward \$5,000+
---
\#Ethereum #ETH #Crypto #Altcoins #ETHUSD #CryptoTrading #ETHAnalysis #CryptoSignals #TradingSetup #Breakout

ETH on track for new All-Time Highcurrently, Ethereum is moving within a channel on the daily timeframe and the midline of the channel has temporarily limited further price growth. this price correction could present an entry opportunity for those who missed the 2000$, or a chance for re-accumulation. however the overall trend remains bullish. the support lines are clearly marked on the chart and it is expected that ETH will reach a new all-time high in the future, with the potential to grow up to $8000
ichimoku analysis was also used, but it has been removed for chart clarity.

ETH Don’t Miss Out!!!
**🚀 ETH WEEKLY TRADE IDEA — \$4K BREAKOUT WATCH**
📈 **Market Bias:** Bullish (Long-term uptrend intact, ETH above key MAs)
⚠ **Short-Term Risk:** MACD bearish crossover + RSI overbought → possible pullback before breakout
📊 **Key Level:** Testing **\$4,000** psychological resistance
**🛠 Setup:**
* **Direction:** LONG
* **Entry:** \$3,966.12
* **Stop Loss:** \$3,900 (below key support)
* **Take Profit:** \$4,050 (first target)
* **Size:** 0.5 (volatility-adjusted)
* **Confidence:** 75%
* **Entry Timing:** Market open
📌 **Why Long?**
* Strong uptrend + above key moving averages
* Positive funding rates and recent momentum support bullish case
* Risk-reward favorable for a potential \$4K+ breakout
💡 *Watch for volume confirmation — failure to break \$4K with strong buy-side pressure could trigger a pullback to \$3,900.*
---
**#ETH #Ethereum #Crypto #Cryptocurrency #CryptoTrading #ETHUSD #Altcoins #Bitcoin #BTC #CryptoSignals #CryptoSetup #TechnicalAnalysis #SwingTrade #DayTrade #PriceAction #BreakoutTrading #CryptoMarket #CryptoInvesting #MACD #RSI #TradingStrategy #BullishSetup #SupportAndResistance #VolumeAnalysis**

ETH/USD – Critical Reversal Zone?
### 🚀 ETH/USD – Critical Reversal Zone?
**🔍 ETH Futures Multi-Model Signal | Consensus: LONG | Confidence: 77%**
---
**🧠 Key Highlights (DS + OA Model Consensus):**
* **Price:** \$3,375 → Trading *below* EMA9/SMA20 = short-term bearish, but hitting strong **support zone**
* **Support:** \$3,248 (Bollinger Lower) & \$2,987 (SMA50)
* **Resistance:** \$3,487 (EMA21), \$3,620 (SMA20)
* **Volume:** -10.3% (5D) → Selling **weakening**
* **RSI:** 49.5 → Neutral but oversold on short-term
* **MACD:** Bearish crossover, but showing **divergence**
* **Volatility:** Bollinger width 9.18% = **Breakout Setup**
---
### 📈 Trade Setup – Conditional LONG
| Entry | Stop Loss | Target | R/R | Confidence |
| ------- | --------- | ------- | ------ | ---------- |
| \$3,375 | \$3,229 | \$3,690 | 1:3.24 | 77% ✅ |
🪙 **Trade Type:** Scale-in (50% @ \$3,375, 50% @ \$3,275)
📊 **Take Profits:**
* TP1: \$3,485 (EMA21)
* TP2: \$3,590 (SMA20)
* TP3: \$3,690 (Weekly VWAP Anchor)
---
### ⚠️ Risk Dashboard
* 🚨 BTC < \$58K → Setup invalid
* 📉 No Open Interest Data – monitor liquidation triggers
* 🧠 Max Position Risk: **1.25%** | Use hard stop-loss
* ⏰ Entry Timing: **London Open (8:00 GMT)**
---
### 💬 TL;DR
ETH is sitting in a **high-confluence reversal zone**. Weak sell volume, macro bullish trend, and volatility contraction signal a potential bounce. 📊 **Risk-defined long** setup favored by both models.
🧠 “Smart money doesn’t chase — it positions early.”
---
📌 **#ETH #CryptoTrading #ETHUSDT #Futures #BreakoutSetup #BollingerBands #MACD #RSI #DeFi #Ethereum #CryptoSignals #TradingView**

ETH (5 year of accumulation!)ETH / USDT
📌 Background: i shared an analysis about ETH/BTC chart and i predicted the ultimate bottom, from which ETH/BTC pumped 52% and ETH/USDT pumped 97% in few days !
you can check previous analysis: click here
📌 Today we have different chart against stable coin … Ethereum is being accumulated since 5 years in mega accumulation range with 2 major stop-loss hunt (long and short)
📌 What IF ?
What if ETH made a breakout throughout this accumulation ? i think we can see scenario like that in the green candles in my chart
DO YOU AGREE ?

Ethereum's Road to $7500 – Strategic Entries & Profit Optimizati🔵 Entry Zone: My first position is placed at $2225.5, aligning with a strong support level, while a secondary entry at $1857.5 serves as an additional safeguard against unexpected market swings—lowering my average purchase price and protecting capital.
💰 Profit-Taking Strategy: For low-risk traders, securing a 40% profit from the first entry is a prudent move to lock in gains early. However, my long-term target remains ambitious.
🚀 Main Target: Based on valuation models and fundamental news, Ethereum’s upside potential points toward $7500. However, I personally plan to secure 90% of my holdings at $6000, ensuring strong profit realization while leaving room for further upside.
This setup balances risk management, smart positioning, and strategic profit optimization. Let’s see how ETH’s trajectory unfolds!
Entry1: 2225.5
Entry 2: 1857.5
If your second entry is successful, you are required to withdraw 50 to 70 percent of your capital to maintain your capital. I will definitely update this setup.

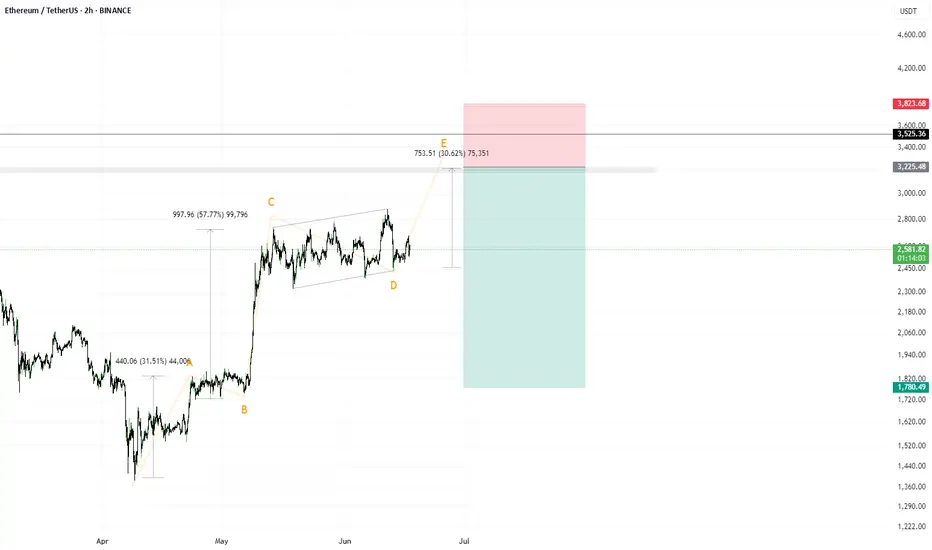
Short idea on $ETHJudging by the structure, if the vector is correctly identified, then on the ETH instrument, a rise to 3400–3600 remains relevant until the first serious correction (this idea would be invalidated in that case).
As for the potential trade — a breakout of the local highs amid global chaos and during the formation of wave 4 of a 5-wave structure. Typically, during the formation of wave 4, there is more media involvement, more noise, and panic.
I’m observing and planning to enter this trade.
Do not follow my vision blindly, as it could be detrimental to you.
ETH Price Action Explained – What the Charts Are Really Saying?🔍 Taking a look at Ethereum ETH right now across multiple timeframes…
On the lower timeframes ⏱️, we’re seeing a bullish break 💥 that might spark some enthusiasm 🚀, but when you zoom out and get that macro perspective 🌐, my outlook shifts from to one of caution ⚠️.
📊 ETH is currently trading into a key resistance level 🧱, and if we step back and view the bigger picture, we can clearly see that it’s been range-bound 🔁 for quite some time.
On the lower timeframes, there might be an opportunity to squeeze a bit out of the range 🎯 by trading between the highs and lows—but keep in mind, this approach is not for the feint hearted ⚡.
📹 This video is purely analysis 🧠, not a trade idea. I’m sharing my thoughts and market view 📈, and I hope you find it helpful and insightful 💡.
🚫 Not financial advice.

Ethereum is Bearish: Watch this Resistance LevelFenzoFx—Ethereum is trading sideways, stabilizing above the 50-period SMA but has yet to form higher-highs. While the price remains above $1,755, the primary trend is considered bearish. A drop below this resistance could push the price toward $1,370 support.
On the other hand, if bulls manage to close above $1,755, a bullish wave could emerge, setting $1,950 as the next target.
>>> No Deposit Bonus
>>> %100 Deposit Bonus
>>> Forex Analysis Contest
All at F enzo F x Decentralized Forex Broker
