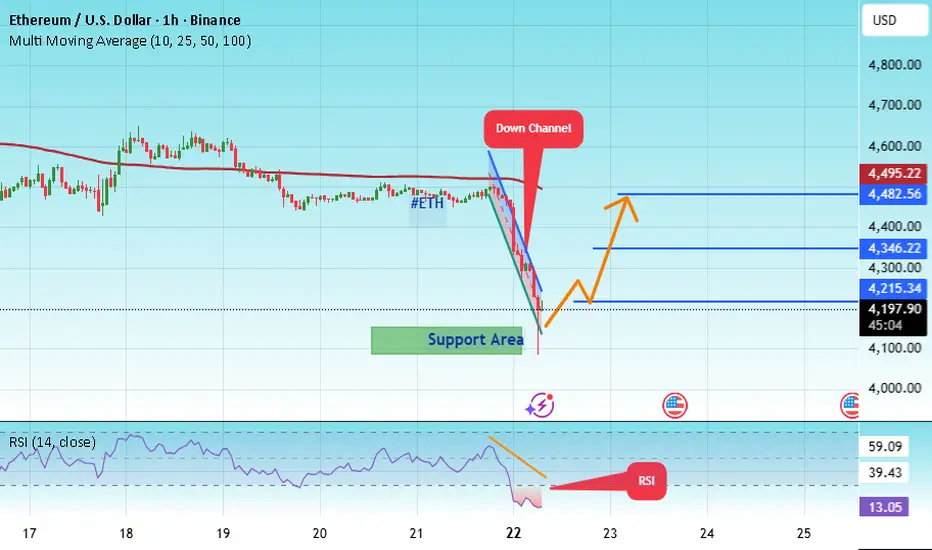
#ETH/USD - Roll back - Its coming baack to 4500#ETH
The price is moving within a descending channel on the 1-hour frame, adhering well to it, and is heading for a strong breakout and retest.
We have a bearish trend on the RSI indicator that is about to be broken and retested, which supports the upward move.
There is a major support area in green at 4111, which represents a strong support point.
We are heading for consolidation above the 100 moving average.
Entry price: 4136.
First target: 4215.
Second target: 4346.
Third target: 4482.
Don't forget a simple matter: capital management.
When you reach the first target, save some money and then change your stop-loss order to an entry order.
For inquiries, please leave a comment.
Thank you.
Ethlong
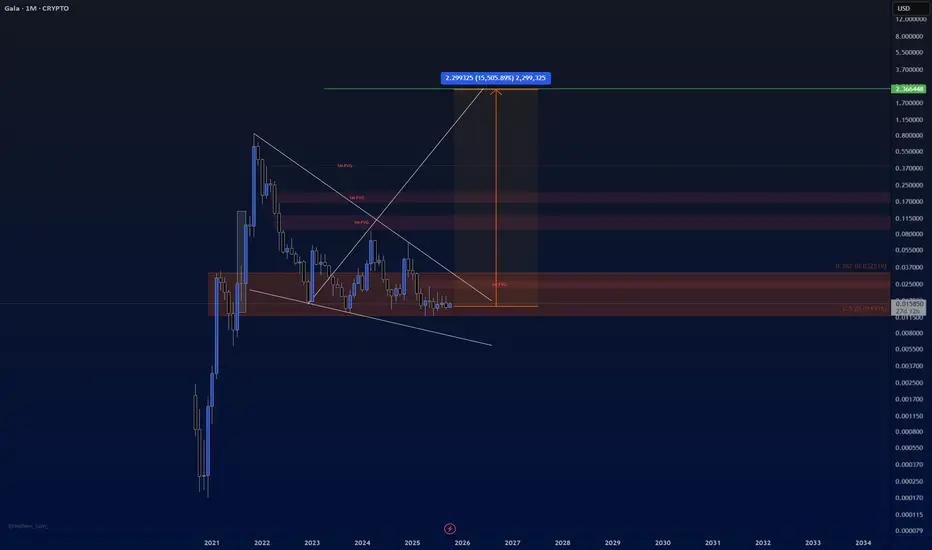
Gala To $2Gala the great crypto looks to be at great levels to purchase a huge load. We are aiming to break ATH and target $2 in 2026.
$TRUTHUSDT has confirmed the falling wedge breakout with an 18% KUCOIN:TRUTHUSDT has confirmed the falling wedge breakout with an 18% pump, moving from 0.0147 to 0.0173+. As long as price holds above 0.0147 support, momentum stays bullish with the next upside targets at 0.0185 and 0.020. Losing 0.0147 would weaken this breakout move.

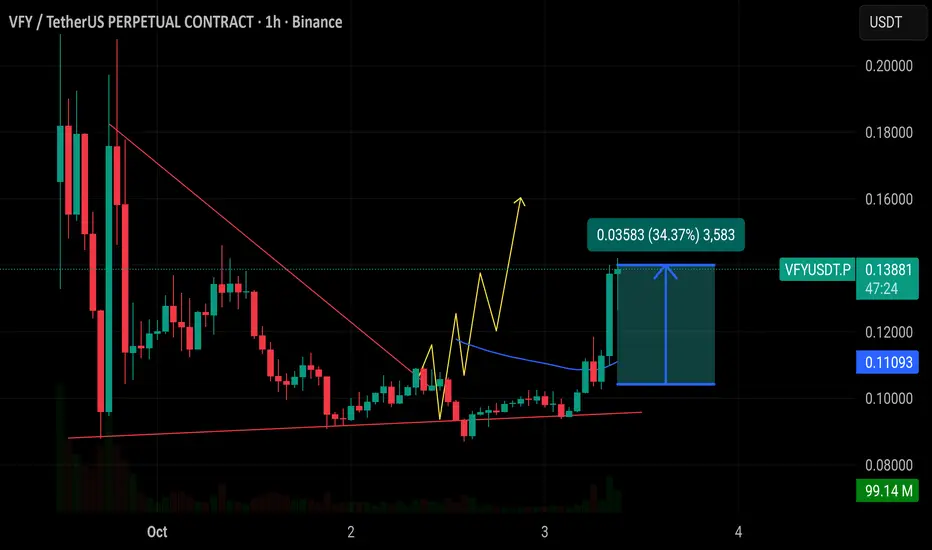
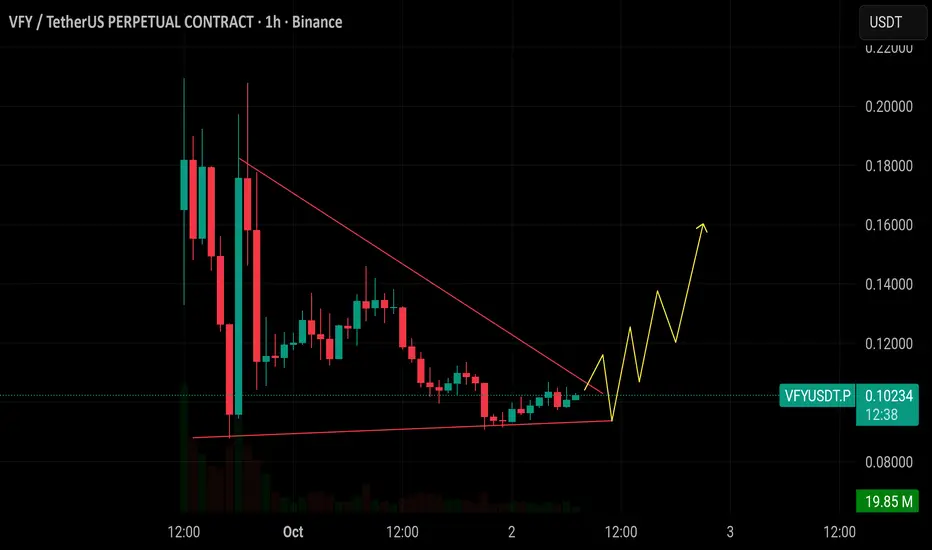
$VFY just pumped 34% after breaking out of the wedge pattern.ASX:VFY just pumped 34% after breaking out of the wedge pattern. Strong move above resistance confirms the breakout. Price is now holding above 0.13, with support around 0.11. If momentum continues, next target zone is 0.16–0.18. Volume also rising chart remains bullish ✅
ETH 03.10#ETH
Ether reacted in no-man's lands. Apart from the ndPOC at 4536, I had no zones there, and there are also no specific signs of weakness to reverse from the current ones. There's nothing to short from yet; I'll wait for the 4700 zone, and I'll only go long from the nearest S-zones if I have confirmation.
Support zones:
4391-4403
4272-4300
4196-4230
Resistance zones:
4660-4724
4768-4780

BTC, ETH, SOL Support, Resistance, and Discovery Zones From HereHere's the 'heat map' for Bitcoin, ETH and Solana's prices from here.
Despite the big liquidation target zone and buy limit order concentration in the $106k zone in Green...
Price pushed higher the last few days as 'Uptober' took hold and the US Government shut down, effectively silencing any negative economic news releases.
Plus we can see that 2 more rate cuts are virtually guaranteed in October and December.
So, very likely that Bitcoin rallies to new ATH later in October into November.
However, I'm seeing sell block pressure just above on Bitcoin in the $121k - $124k range, and also on the TOTAL market cap.
What's interesting is that I'm not seeing any sell block pressure on TOTAL2 or TOTAL3, indicating that Alts are more likely to push higher from here, as BTC retraces.
What do you think?

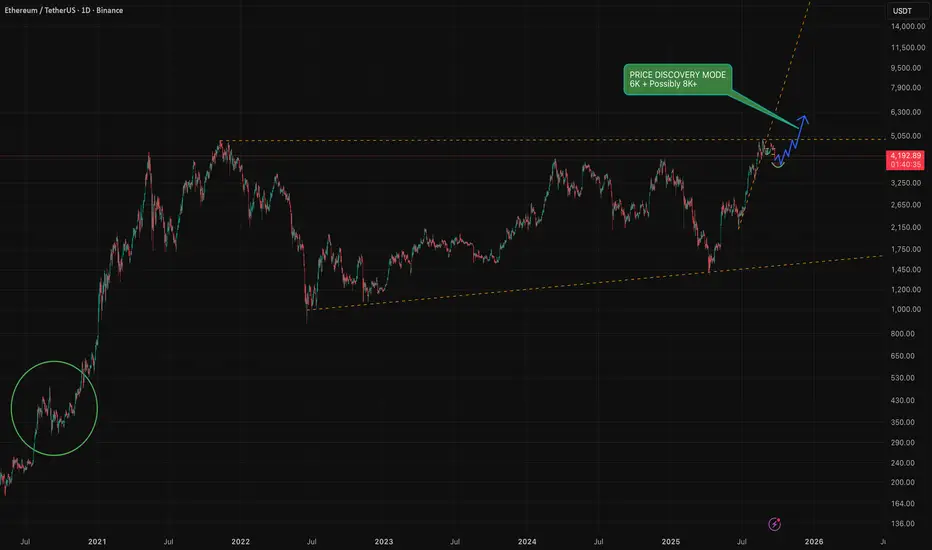
History doesn't repeat but RHYMES ! I highly recommend everyone to have look at September 2020
I personally think that this will be the same scenario where we will have some fake-outs to drive the retails out / liquidate then the price will carry on upwards and go into price discovery mode where we are more likely to see 6K and hopefully more, if the volume and kicks in the ETF's and more retail pump we can see somewhere between 8K to 12K ( Optimistically )
I personally will be taking profits along the way tho and not going to wait for the top as we all know no one can predict the top nor the bottom !
Thank you all for reading my idea and feel free to share yours here in the comments.
To get access to my indicators please join the FREE tg channel, link in my BIO !
Ethereum Price Approaches $4,500 Despite Crucial Holders’ ExitEthereum is trading at $4,383, just below the $4,500 resistance level. The altcoin king has attempted several times to secure $4,500 as a support floor but has not yet succeeded. This remains the most critical barrier in determining ETH’s near-term direction.
If inflows continue strengthening, ETH could break past $4,500 and secure it as support. Such a move would pave the way for a rise toward $4,775 and potentially retest the all-time high of $4,956. The continuation of this momentum would reinforce a strongly bullish outlook.
However, failure to breach resistance could change sentiment. Ethereum risks slipping back to $4,222 support, with the possibility of falling to $4,074. Such a decline would invalidate the bullish thesis and signal renewed weakness in the altcoin king’s price action.

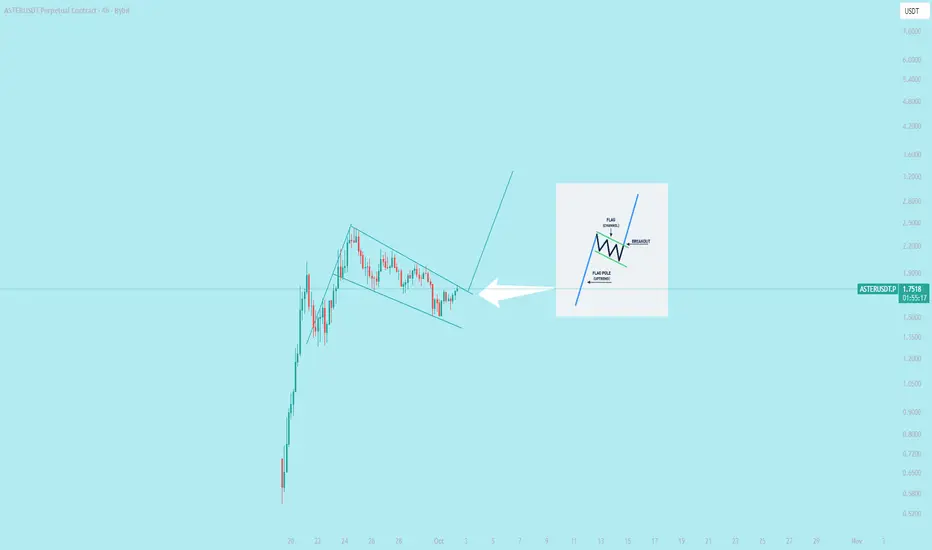
$ASTER Perform of a bullish flag in 4hr
A bullish flag is a chart pattern used in technical analysis that signals a continuation of an uptrend. It is named for its resemblance to a flag on a pole. The pattern consists of two parts: the "flagpole" and the "flag".
**How to trade a bullish flag**
Traders can use the bullish flag pattern to identify potential entry, exit, and stop-loss points.
**Entry**: Enter a long (buy) position after the price breaks above the upper trendline of the flag, indicating the continuation of the uptrend. More conservative traders may wait for the breakout candle to close for confirmation.
**Stop-loss:** Place a stop-loss order just below the lower trendline of the flag. This helps protect against a false breakout or a market reversal.
**Profit target:** A common method for setting a profit target is to measure the height of the flagpole and then project that distance upward from the point of the breakout.
@everyone
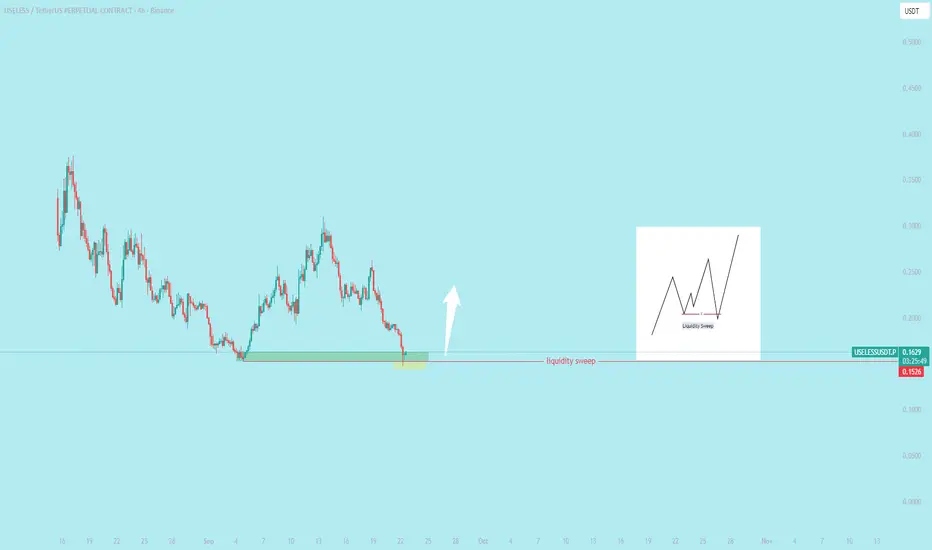
$USELESS liquidity sweep **liquidity sweep** in trading happens when the price of a coin or asset quickly moves to a level where many stop-loss orders or pending orders (buy/sell) are placed, triggering them. These orders are often clustered at key support or resistance levels, like round numbers or recent highs/lows. Large players (like whales or institutions) may intentionally push the price to these levels to "sweep" or clear out this liquidity (execute these orders), allowing them to buy low or sell high before the price reverses.
**In simple words**: It’s when the market price suddenly moves to hit a bunch of stop-losses or pending orders, clearing them out, often before a big price move in the opposite direction. For example, if many traders set stop-losses just below a support level, a liquidity sweep might push the price down to trigger those stops, then bounce back up.
**How to use this in trading**:
- Watch key levels (support/resistance) on charts where stop-losses might cluster.
- Avoid placing stop-losses at obvious levels (e.g., exact round numbers like $0.10).
- For coins like #WLFI or #USELESS, check order books or volume spikes to spot potential sweeps.
- Manage risk by using smaller position sizes and setting stops away from crowded levels.
Always confirm price action and trends before acting, especially with volatile new coins.
ETH 02.10#ETH
Ether doesn't care about any resistance right now, and there's nothing holding it back until it reaches the liquidity zone and the upper limit of the range around 4700. The HTF can't afford to lose 4200. There's plenty of local liquidity at 4280, and 4300 is the fair value (POC) zone in the range since August. We might struggle here for a while if they don't allow a direct expansion to 4700 without any pauses.
Support zones:
4268-4280
4200-4230
Resistance zones:
4456-4480
4660-4724
4768-4780

$VFY is forming a bullish wedge. Support is around 0.092. #btcASX:VFY is forming a bullish wedge. Support is around 0.092. A breakout above 0.11 could trigger a sharp move. Watch for rising volume spike may come soon. If confirmed, targets are 0.14 to 0.16. Chart looks ready for upside. ✅
Market idea based on the Harmonious Energy Flow (HEF) conceptAt the current stage, we can observe a clear manifestation of buyers’ strength, even though the market conditions are shifting rapidly without any significant price expansion. This creates a state of consolidation, where energy is being accumulated for the next move.
According to the HEF concept, consolidation represents a transitional phase — the market is searching for balance before moving into a new wave of directional flow. My current expectation is the transition towards the breakout moment, when price finally exits this consolidation zone and reveals the true side of strength.
📌 Key focus: monitoring how buyers sustain their advantage within this tight structure, and waiting for the signal of release from balance.
If you find my charting approach interesting, you are very welcome to connect for further discussion. I am open to dialogue and exchange of views.

$BMNR - Cup & Handle Formation $215 Price TargetA major cup and handle pattern is forming. Watch for breakout level around the 64-ish level. Once breakout occur, use the Fib extension overlay for price objective that can range from $81 to $215. This is a very bullish setup happening.

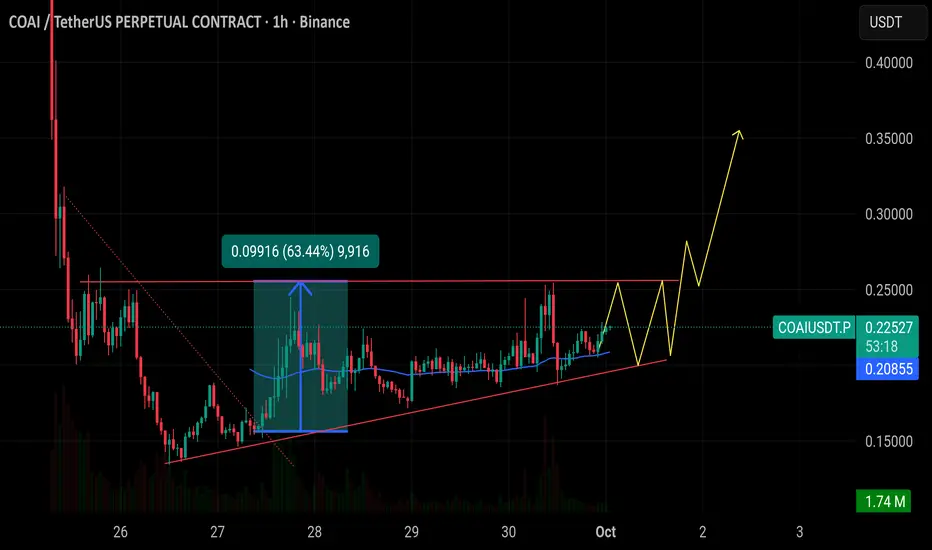
$COAI after a 63% pump is now trading in an Ascending Triangle $COAI after a 63% pump is now trading in an Ascending Triangle with resistance around 0.25 and rising support near 0.20. A breakout above 0.25 could push the price toward 0.35–0.40, while losing the rising support would risk a sharp drop back under 0.19.
Ethereum Price Bounces Off 7-Week Low—Future Still Promising?Ethereum trades at $4,187, just under the $4,222 resistance level after rebounding from a $3,872 low. This recovery highlights buyer interest at support levels. However, the broader market remains cautious, waiting to see whether Ethereum can sustain momentum and reclaim critical price barriers.
If Ethereum breaches $4,222, it could flip this level into support, potentially extending gains. Still, breaking above $4,500 will be difficult without fresh inflows. Limited liquidity and investor hesitation could keep Ethereum rangebound, consolidating until stronger catalysts emerge in the market.
On the downside, failure to maintain support could reignite bearish sentiment. If selling intensifies, Ethereum might slip through $4,074 and retest $3,872. Such a decline would invalidate the bullish outlook.

ETH : Accumulation Before Next Big Rally??Ethereum continues to show strength on the weekly timeframe.
Weekly structure remains firmly bullish, IMO. Pullbacks are natural, but the weekly structure favors continuation.
Weekly closing about 4.2-4.3K could trigger massive rally on weekly TF.
Chart is self explanatory. This is purely my interpretation of the chart and it could go wrong.
Note: This post reflects my personal views for educational purposes. It is not financial advice. Always DYOR before making any and every decision.

ETHUSD ANALYLTICAL IDEA, FOR 30 SEP, 2025.After the quick fall below $4000, in value, the second in command on the coin market sharply went back to its original position and currently trades around $4100, but the overall direction is bullish as considered the altcoin season. But the question is, will it hold? Or continue pushing above or below well, for now, we can only sit tight on our hands, as my Bias remains bearish for the short term, and I look forward to taking sell trade positions as the price continues to push further in that direction.
As usual, my calls or analysis are based on what we see, the current Bias, and from a probability standpoint, meaning that this projection may be or may not be validated, so tread carefully, and as usual, this is not financial advice, trade responsibly.

We're setting up for the greatest Q4 for Ethereum $ETH so farMy CRYPTOCAP:ETH thesis is slowly playing out
Waiting for one more confirmation (reclaiming 4250 resistance), and we're setting up for the greatest Q4 so far for Ethereum
I'll be buying the dips with SL below the current HTF deviation low at ~3830
A bit more patience here, let it play out, don't rush it

#ETH/USDT : Bounce From Support, Eyes on $ 4128#ETH
The price is moving within a descending channel on the 1-hour frame, adhering well to it, and is heading for a strong breakout and retest.
We have a bearish trend on the RSI indicator that is about to be broken and retested, which supports the upward breakout.
There is a major support area in green at 3950, which represents a strong support point.
We are heading for consolidation above the 100 moving average.
Entry price: 4012.
First target: 4050.
Second target: 4084.
Third target: 4128.
Don't forget a simple matter: capital management.
When you reach the first target, save some money and then change your stop-loss order to an entry order.
For inquiries, please leave a comment.
Thank you.

ETH 4H trade Idea Here is an idea to trade Ethereum on 4 hour TF. Entry and Exit points are given. NFA DYOR

ETH TA 29.09On Thursday, we bounced well from the important zone with HTF divers and are already back above 4k. Now Ether desperately needs to break through the R1 zone of 4215-4250, and then there won't be any important resistances until 4600+. Currently, locally, we're trading sideways at 3980-4200+. Losing the lower boundary of the sideways range is undesirable and very dangerous for further growth, plus there's a good low there, albeit a Voskresensk one. And the nearest decent support is at 3500.

ETHUSD Weekly Scenarios BullsWeekly Scenarios
Bulls
If ETH holds support at $4,200 and manages to rebound above the $4,500-4,600 resistance, we can expect a rally to $5,000 and beyond.
Sideways/Consolidation
The price may remain stuck in the $4,200-4,600 range until the market finds enough signal or volume to break out.
Bears
A breakout below $4,200 with volume confirmation will lead to a decline to $3,800 and below.
