$BARD Performing Bullish Ascending TriangleA bullish ascending triangle is a continuation chart pattern in technical analysis that signals a likely breakout to the upside. The pattern forms when an asset's price consolidates between a flat upper resistance line and an upward-sloping lower trendline, indicating that buyers are steadily gaining strength.
How to trade the pattern
Spot the pattern:
Look for an existing uptrend, followed by a period of consolidation that forms a horizontal resistance and rising support line. The pattern is more reliable on longer timeframes, such as daily or weekly charts.
Wait for the breakout:
Enter a long position only after the price closes decisively above the horizontal resistance line. An entry is strongest when confirmed by a spike in trading volume.
Set a stop-loss:
To manage risk, place a stop-loss order just below the breakout level or the most recent higher low within the triangle.
Determine a profit target:
A common strategy is to measure the height of the triangle at its widest point (the beginning of the pattern) and add that distance to the breakout price. This provides a target for the potential upward move.
Ethlong

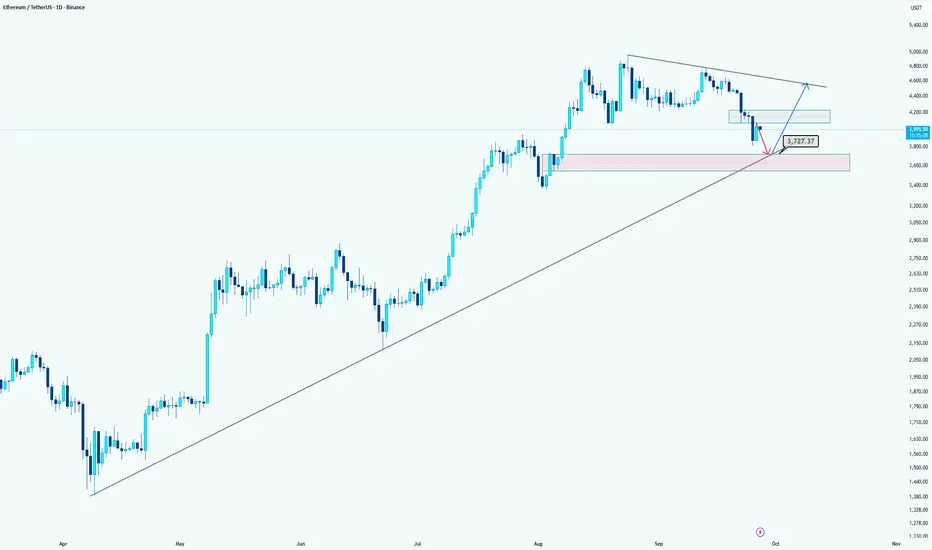
Ethereum: Levels to WatchHi guys!
Ethereum is currently showing weakness after failing to break higher. The price is likely to retest the MPL zone around $3727, which also aligns with the long-term ascending trendline, making it a strong confluence support.
The pink area highlights a potential demand zone where buyers may step in. If the market confirms bullish signals in this area, a long position toward the descending trendline resistance could be considered. However, extra confirmations are recommended before entering long.
Summary:
Short-term target for shorts: $3727 (MPL plus trendline support).
Watch the pink zone for potential long entries, but wait for confirmation.
Let's see what will happen!
Ethereum $ETH crypto trade idea using the weekly demand levelThere is an Ethereum CRYPTOCAP:ETH crypto trade idea using the weekly demand at $3,872. This is a very similar crypto swing trade idea I recently shared with BitCoin. Let's see if it wants to rally for a couple of weeks. You can use the smaller timeframes to trade crypto intraday strategies or scalping strategies.

#ETH is on a mission New ATH#ETH is on a mission to reach its new all-time high (ATH).
First, it may liquidate some long traders, then fill the order blocks of smart buyers before creating a new ATH.
~Namaste~
$ Jai Shree Ram $

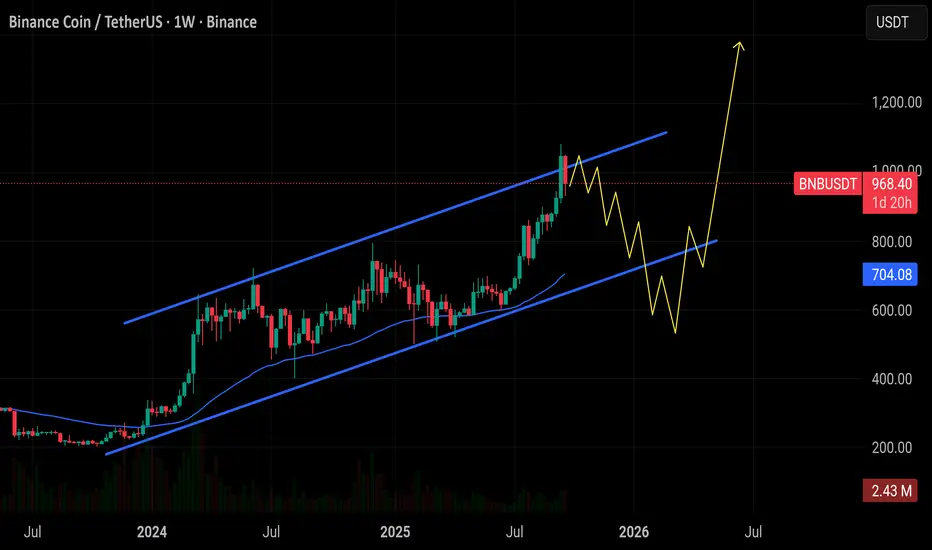
$BNB is holding near $968 with solid momentum, but ? CRYPTOCAP:BNB is holding near $968 with solid momentum, but I expect a healthy dip toward the $710–550 support zone before the next big move. That’s the area I’ll be looking to load, with eyes on a breakout toward $1,200+.
$ETH is trading around $4,000 after hitting the $4,800–5,000 $ CRYPTOCAP:ETH is trading around $4,000 after hitting the $4,800–5,000 resistance zone I mentioned in my last update. As expected, a short-term correction is playing out toward $3,500–$3,200, with possible extension to $3,100, where I’ll be looking to buy again. My bullish targets remain around $5,000 and $6,000, and I’ll share timely updates as the setup develops.

BMNR HIGH PROBABILITY SETUP SOON!!!🚨 BMNR HIGH PROBABILITY BUY SETUP 🚨
* Here We Can See Clearly The Next Potential Move For BMNR Coming Hours/Days.
* Keep Your Eyes Close On Your Trading Positions.
* Happy PIP Hunting Traders.
FXKILLA.

Ethereum Price Hits 6-Week Low, But Here Lies An OpportunityAt press time, Ethereum is trading at $3,938, attempting to establish $3,910 as a support floor. This decline marks a crucial break below the $4,000 level, highlighting short-term weakness.
Given current signals, ETH may remain rangebound under $4,074 resistance until stronger bullish cues emerge. Market sentiment suggests consolidation rather than sharp recovery, keeping investors cautious.
However, if Ethereum flips $4,074 into support, a push toward $4,222 could follow. This move would require investor participation and sustained inflows to counter bearish momentum, ultimately invalidating the short-term negative outlook.

ETH – Eyeing $3.3k Sweep Before Loading LongETH has broken down from its recent range, showing lower highs and consistent selling pressure. I’m watching for one more leg lower into the $3,300 area.
Why $3,300?
A clean sweep here would trap shorts and flush out late longs, setting the stage for a strong bounce.
Setup Plan:
Short-term bias: Bearish, expecting continuation lower into ~$3,300
Will not long until we get a reaction at that level
Long trigger: Strong bounce/reversal signals at $3,300 zone
Targets on the bounce: $3,500 → $3,650 → $3,800
Stop loss: Below $3,250
ETH likely has one more dip before setting up for a cleaner move higher. Patience pays here.
$ETH shows bullish hidden RSI divergence.A **bullish hidden RSI divergence** is a trading signal that suggests a continuation of an upward trend, often indicating that the price will keep rising. It occurs when the price action and the Relative Strength Index (RSI) show a specific pattern. Here's a simple explanation of how to identify and trade it:
### Step 1: Understand the Pattern
- **Price Action**: The price makes **higher lows** (each low point is higher than the previous one), indicating an uptrend.
- **RSI**: The RSI makes **lower lows** (the RSI is declining while the price is not), showing a divergence from the price trend.
- This mismatch suggests that the uptrend is still strong, and the dip in RSI is just a temporary slowdown in momentum, not a reversal.
### Step 2: Identify the Divergence
1. **Chart Setup**: Use a price chart (e.g., candlestick chart) with the RSI indicator (typically set to 14 periods) on a platform like TradingView .
2. **Spot Higher Lows in Price**: Look for a price chart where the recent low is higher than the previous low (e.g., $100 to $105).
3. **Check RSI for Lower Lows**: At the same time, check if the RSI is making a lower low (e.g., RSI drops from 50 to 45 while price makes a higher low).
4. **Confirm the Uptrend**: Ensure the overall trend is bullish (price is generally moving up with higher highs and higher lows).
### Step 3: Trading the Bullish Hidden RSI Divergence
1. **Entry Point**:
- Enter a **buy** trade when you confirm the divergence and see the price starting to rise again after the higher low.
- Look for additional confirmation, like a bullish candlestick pattern (e.g., a hammer or engulfing candle) or a break above a resistance level.
2. **Stop Loss**:
- Place a stop loss below the most recent higher low to protect against a potential trend reversal.
- For example, if the higher low is at $105, set the stop loss slightly below, like $103.
3. **Take Profit**:
- Target a take-profit level based on previous highs, support/resistance levels, or a risk-reward ratio (e.g., 1:2, meaning you aim for twice the profit compared to your risk).
- For instance, if your stop loss is $2 below entry, aim for a $4 profit target.
### Step 4: Manage the Trade
- **Monitor RSI**: Ensure RSI doesn’t drop into oversold territory (below 30) or show signs of a bearish reversal.
- **Adjust Stop Loss**: As the price moves up, consider trailing your stop loss to lock in profits.
- **Exit Strategy**: Exit the trade if the price hits your target, or if you see signs of a trend reversal (e.g., a bearish divergence or break of key support).
### Example
- **Price**: Stock XYZ makes a low at $100, then a higher low at $105.
- **RSI**: RSI drops from 50 to 45 during the same period.
- **Action**: You enter a buy trade at $106 after a bullish candle. Set a stop loss at $103 and aim for a take-profit at $110 (1:2 risk-reward).
- **Outcome**: If the price continues its uptrend to $110, you take profit. If it drops below $103, you exit with a small loss.
### Tips
- **Timeframes**: Use higher timeframes (e.g., 1-hour, 4-hour, or daily) for more reliable signals.
- **Confirmation Tools**: Combine with other indicators like moving averages or trendlines for stronger signals.
- **Practice**: Test this strategy on a demo account before using real money to understand how it works in different market conditions.
- **Risk Management**: Never risk more than 1-2% of your trading account on a single trade.
This strategy works best in trending markets, so always confirm the broader trend before trading.

Ethereum (ETH/USDT) Weekly Chart UpdateEthereum (ETH/USDT) Weekly Chart Update
ETH is currently trading around $4026, down approximately 9.5% this week.
A long-term triangle breakout has occurred, and the price is now retesting this breakout zone.
Support levels: $3800 and $3500 (with the moving average).
Resistance levels: $ 4,500–$ 4,800 (short-term); if the momentum continues, the next major target would be $ 5,500–$ 6,000.
The overall trend remains bullish as long as ETH stays above $3500–$3600.
⚡ Summary:
ETH is currently experiencing a mid-term correction, but the long-term outlook remains bullish. Staying above support could pave the way for a move towards $5000+ in the coming months.
#crypto #ETH #BTC

ETH Oversold Again – Is a Bounce Coming?Ethereum (ETHUSDT) on the 4H chart is showing signs of oversold conditions as the RSI once again dips below the 30 level. This setup has historically aligned with local bottoms, where ETH tends to bounce back shortly after reaching such extreme levels of selling pressure. The current price action around $4,170 highlights a critical zone to monitor for potential reversal.
If ETH can hold this level and buying momentum steps in, a relief rally could follow in the short term. However, if weakness persists, further downside retests cannot be ruled out. Traders should closely watch RSI recovery and volume confirmation for signals of a stronger rebound.

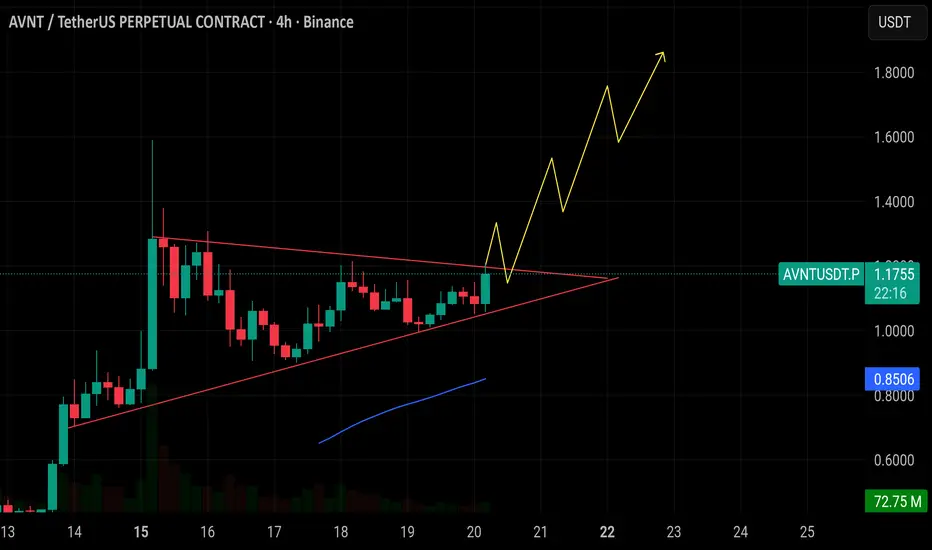
$AVNT Perform of a bullish pennantWhat the pattern indicates
A bullish pennant is a continuation pattern, meaning that it signals the market is likely to continue its current trend after a brief pause. It suggests that the buying pressure that caused the initial rally is gathering strength for another push upward.
How to trade the pattern
Traders can use this pattern to plan entry and exit points:
Entry: A common strategy is to enter a long position (buy) when the price breaks above the pennant's resistance trendline.
Profit target: The typical price target for the trade is determined by measuring the height of the initial flagpole and projecting that distance from the breakout point.
Stop-loss: To manage risk, a stop-loss order can be placed just below the pennant's lower trendline.

$ETH trading near $4,180, sitting close to the $4,000 support CRYPTOCAP:ETH trading near $4,180, sitting close to the $4,000 support zone. A short-term bounce from here is possible, with pullback targets toward $4,500. However, I’m still holding my short position, watching for a clean break below $4,000 that could open the way toward $3,500 and lower levels.

ETHUSD bull pennantA bull pennant on the 2h chart for ETH USD. I'm not sure how this will play out. The price has held very good so far. Today's sunday candle will be very indicative. If this goes up from here shorts will be cancelled and it will fly. If not then the future holds something different.

Ichimoku buy signal on ETH/USD DailySo there's an ichimoku buy signal on the ethereum daily chart. When the faster span crosses over the slower one, (doesn't let me use japanese words) and the current candles are over the cloud, this indicates a buy signal. The lagging span should ideally be above the corresponding price action. In this case it almost is.
Other than the indicators, we have a bull pennant looking shape. as well as a cup and handle looking pattern. The trade is to buy here targeting new all time highs for ethereum. This also depends on bitcoin. If bitcoin goes up, I am very certain this will happen.
Not telling you a stop loss or anything.
Not financial advice

ETHUSDTHello Traders! 👋
What are your thoughts on Ethereum?
Ethereum has recently broken above the key resistance area near 4100, printing a new high slightly above the previous peak. After this breakout, price action has entered a corrective phase, suggesting a healthy pullback.
This correction is currently forming a bullish flag pattern, which may act as a continuation setup.
As long as ETH remains above the highlighted support zone, the bullish scenario remains valid. A confirmed breakout from the flag formation could trigger the next impulsive wave, potentially leading to fresh all-time highs.
Keep a close eye on the flag breakout and watch for bullish momentum to resume once the consolidation completes.
Don’t forget to like and share your thoughts in the comments! ❤️

$BTC short trade hit target !we go down more?Tp hit for BTC short i will close 70% of trade here ... if we loss this level we might see more downside ! what you think for new week ? we go down side more for crypto market?

Ethereum Price Steady at $4,500—Here’s What’s Ahead For ETHEthereum’s price is currently trading at $4,468, just shy of the $4,500 resistance. The altcoin has been consolidating near this level, showing resilience even as broader market trends remain mixed.
Given the supportive market sentiment and accumulation trend, Ethereum is poised to reclaim $4,500 as a support floor. Successfully flipping this level could pave the way for ETH to challenge the $4,775 resistance in the coming days.
However, downside risks remain if bearish pressure builds. In such a scenario, Ethereum could lose footing and slip to the $4,307 support level. A drop to this zone would invalidate the bullish thesis temporarily and deepen potential investor losses

#AVNT breakout on fire! Price blasted more than 50% #AVNT breakout on fire! Price blasted more than 50% in less than 24h. Unstoppable momentum is driving the rally. Buyers are flooding in with strong demand. Resistance levels are getting tested fast.
Bulls fully in control.

$AVNT is breaking out of a tightening wedge. If momentum holds NYSE:AVNT is breaking out of a tightening wedge. If momentum holds above 1.17, the next leg higher could target 1.40–1.80.
Support remains strong at 0.85, making this a key level to watch.
Bullish continuation in play. 🚀
ETHUSDT 4h
CRYPTOCAP:ETH might be ready to pop!
Entry: $4,869
Target: $6,136
Consolidation looks like a spring ready to launch 🚀
Keep eyes on the breakout!
DYOR & NFA
#ETH #Crypto

ETH UPDATEHello friends
Well, you can see that due to the bearish market cycle, the downward steps have gradually become smaller and we have hit a higher ceiling at the specified support, which is a sign of a weak trend or price flooring. If this specified price floor is maintained, the price can move to the specified targets.
*Trade safely with us*
