Ethereum’s Epic Climb: $10,000+ by Year-End 2025!New data and discoveries have come in, so my prediction for ETH has changed.
Back in March 2025, I saw this ETH pattern forming:
So far, everything is playing out as expected, but I believe the timeline has shifted to sometime at the end of December 2025.
We have one major liquidation event to play out before this happens in September, and I would not be surprised if we get a pullback to $3,500 before liftoff.
Bitcoin will most likely go down to $92,000 to close the CME gap:
You can check that out above, and when that happens, ETH should bottom out somewhere around $3,500.
The next major time Fibonacci will be on October 10th, 2025; this is most likely when we get the breakout. Until then, a massive trap is forming.
Ascending triangles are the name of the game in a bull market, especially with ETH:
As long as we keep putting in lower highs into ascending triangles, we are good to go higher; anything else is noise.
Invalidation for this thesis is simple: we close a weekly candle under the orange support, and chances are very high that we are done.
All I think is happening here is preparation for a massive bear trap, flushing out all the late leverage, as they always do. This is just a rite of passage before a major rally ensues.
Ethlong

Eth - Support and resistance & take profit targetsSupport and resistance & take profit targets.
May the trends be with you.


Ethereum – Bullish Reversal from Demand Zone Towards ATHEthereum has successfully respected the ascending trendline and reacted strongly from the blue demand zone & FVG. Current structure suggests a potential bullish reversal targeting liquidity above 4,680 and eventually the All-Time High (4,887).
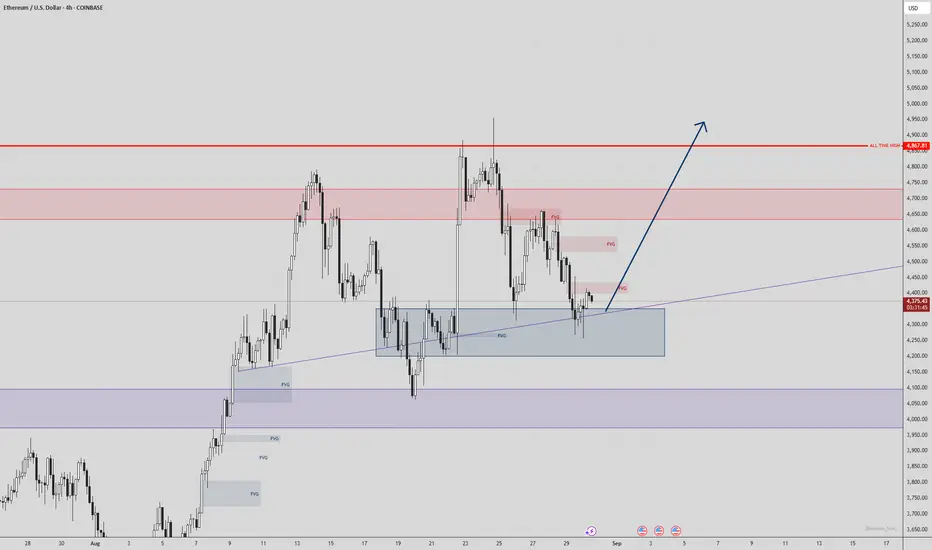
ETH/USDTI think the box and area I drew below is a good buy zone for Ethereum and we could see an upward move from it.


Ethereum ETH Analysis: 1D Bullish Trend with Order Block Support🔎 I’m currently looking at Ethereum (ETH), which is showing a strong bullish trend on the daily timeframe 📈. Price has pulled back significantly into a daily bullish order block 🟢 — a previous accumulation range that I expect to act as a key support level.
On the 30-minute timeframe ⏱, I’m watching closely for a bullish break of structure 🔑 as confirmation for a potential long entry 🎯.
⚠️ Not financial advice.

Don’t Buy Ethereum Until You Watch This!In this episode, I take a skeptical look at Ethereum’s latest price action. We’ll break down the recent pullback, identify clear triggers for long setups, and discuss what happens if key levels fail. Plus, a quick educational tip on how ETH.D and BTC.D can signal the start of altseason.
⚠️ This content is for educational purposes only and not financial advice.


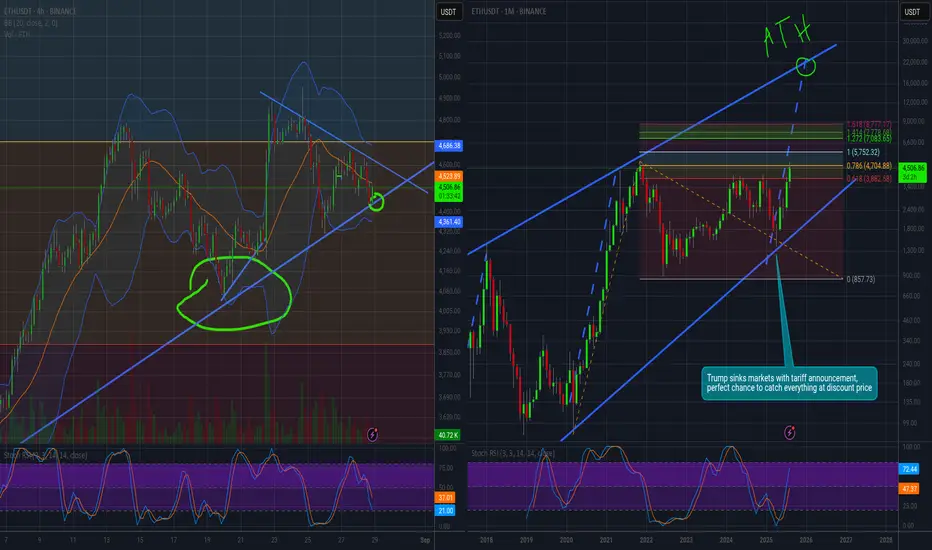
Bull Pennant Almost OverHere's hoping the trend line holds.
If the trend continues we could hit a new price target of 5752 according to trend-based fibonacci extension with 2020's covid impulse dip as the starting point.
Ethereum Exit Queue Hits $5B: Wall Street’s Big Bet?
Ethereum Exit Queue Hits $5B: Sell Pressure or Wall Street’s Big Bet?
Ethereum continues to dominate crypto headlines in 2025. The network’s staking system has reached an unprecedented milestone with nearly $5 billion worth of ETH awaiting withdrawal—a development that has sparked both optimism and concern. While some fear that this backlog could translate into significant sell pressure, others see it as part of a broader realignment toward institutional adoption.
At the same time, Ethereum’s spot ETFs are outperforming Bitcoin ETFs by a wide margin, drawing in nearly $1.83 billion in just five days—ten times the inflows of Bitcoin funds. This surge highlights a growing narrative: Wall Street is tilting its focus toward Ethereum, not only as a cryptocurrency but as a foundational layer of modern finance.
This article examines the implications of the record exit queue, the rise of Ethereum ETFs, and whether ETH is poised to outperform BTC as the crypto market’s dominant asset.
Ethereum’s Record Exit Queue: A $5B Test for the Market
Ethereum’s exit queue refers to the backlog of stakers who have requested to withdraw their ETH from the staking contract. Following Ethereum’s transition to proof-of-stake in 2022 and the Shanghai/Capella upgrade in 2023, staked ETH has become liquid, enabling participants to lock and unlock their holdings as they choose.
Today, that queue has swelled to nearly 5 million ETH—worth around $5 billion. This is the largest exit queue in Ethereum’s history, and it raises critical questions:
1. Will this ETH be sold on the open market?
After a 72% rally in the past three months, many stakers may be tempted to take profits, especially those who locked in ETH at lower prices during the bear market. A mass sell-off could put downward pressure on prices.
2. Or is this a rotation of capital?
Not all withdrawals translate into selling. Many institutional investors may be withdrawing ETH to redeploy it into spot ETFs, where liquidity, custodial security, and regulatory approval are more attractive. Others may seek higher yields in decentralized finance (DeFi) protocols, liquid staking derivatives, or alternative strategies.
3. What about long-term holders?
A sizable portion of Ethereum’s stakers are long-term believers in the protocol. For them, withdrawing doesn’t necessarily mean exiting—rather, it may signal repositioning into newer financial products that better fit their strategies.
Ultimately, the exit queue is both a sign of Ethereum’s growing liquidity and a potential near-term overhang on price.
The 72% Rally: Profit-Taking or Momentum?
Ethereum’s price surge—up 72% in just three months—gives context to the withdrawal queue. After a prolonged bear market, ETH holders have seen one of the strongest rallies in years. For many, the exit queue represents an opportunity to lock in profits at multi-month highs.
However, the rally is not just speculative. Several fundamental drivers are fueling Ethereum’s rise:
• ETF approvals and inflows are bringing unprecedented institutional demand.
• Layer 2 scaling solutions such as Arbitrum, Optimism, and Base are driving transaction volumes while reducing costs.
• Tokenization pilots by major banks and asset managers are increasingly choosing Ethereum as a settlement layer.
This means the rally is underpinned by both sentiment and structural adoption, making it harder to dismiss as a short-lived pump.
Ethereum ETFs: Outshining Bitcoin
One of the most striking developments is the flow of capital into Ethereum ETFs. In just five days, spot Ether ETFs have attracted $1.83 billion in inflows, compared to only around $180 million into Bitcoin ETFs. This 10-to-1 ratio in favor of Ethereum is rare, as Bitcoin has traditionally dominated institutional flows.
Why are ETFs favoring Ethereum?
1. Utility Beyond Store of Value
Bitcoin is often called “digital gold,” but Ethereum is more than a speculative hedge. It underpins decentralized finance, NFTs, tokenization, and smart contracts—areas with real-world utility that institutions can leverage.
2. Yield Through Staking
Unlike Bitcoin, Ethereum offers staking rewards. Even though ETF structures may not directly pass staking yields to investors, the narrative of a yield-bearing crypto asset appeals to long-term capital allocators.
3. Alignment with Wall Street’s Future
Ethereum’s programmability makes it easier for Wall Street to imagine building products and services on top of it. From tokenized bonds to on-chain settlement systems, Ethereum’s relevance extends beyond speculation.
As a result, institutional flows are tilting toward ETH, reinforcing its narrative as the infrastructure layer of finance.
Will Ethereum Outperform Bitcoin?
The question on every investor’s mind: can Ethereum outperform Bitcoin in this cycle?
Ethereum’s Tailwinds:
• ETF Momentum: With stronger inflows, ETFs could become a steady channel for demand.
• Broader Use Cases: Ethereum is not just money—it’s programmable finance.
• Institutional Adoption: Banks and asset managers are experimenting with Ethereum for tokenization and settlement.
Ethereum’s Risks:
• Sell Pressure: The $5B exit queue could weigh heavily on prices if too much ETH hits the market.
• Competition: Alternative blockchains like Solana and Avalanche are vying for institutional attention with faster throughput.
• Regulation: Ethereum’s staking system could attract more scrutiny than Bitcoin, which is generally classified as a commodity.
Bitcoin’s Defenses:
Bitcoin still has the advantage of being the original, most secure, and most decentralized crypto asset. Its supply cap of 21 million gives it unmatched scarcity. But in terms of growth opportunities and utility, Ethereum may have the edge.
Wall Street’s Tilt Toward Ethereum
Ethereum’s ETF inflows and VanEck CEO Jan van Eck’s recent remarks calling ETH “the Wall Street token” suggest a broader narrative shift. Wall Street is beginning to view Ethereum not just as another cryptocurrency, but as the financial operating system of the future.
• Banks are exploring blockchain-based stablecoin transfers.
• Asset managers are launching tokenization pilots on Ethereum.
• Investors are reallocating from Bitcoin to Ethereum ETFs.
This alignment means Ethereum is no longer just a crypto-native story. It is becoming central to how global finance evolves.
Looking Ahead: Short-Term Pressure, Long-Term Promise
The $5 billion exit queue is a short-term concern. If even a fraction of that ETH is sold, prices could face volatility. But in the bigger picture, withdrawals represent liquidity and flexibility—a sign of a maturing ecosystem.
At the same time, Ethereum’s ETF success and its growing reputation as Wall Street’s blockchain suggest that institutional adoption is only beginning. If these inflows persist, Ethereum could not only outperform Bitcoin but also cement its role as the primary financial infrastructure of the digital age.
Conclusion
Ethereum is at a crossroads. On one hand, the record $5 billion exit queue raises fears of sell pressure and short-term volatility. On the other, Ethereum’s ETF dominance, institutional adoption, and 72% rally signal powerful momentum.
The battle between profit-taking and institutional accumulation will define Ethereum’s near-term price action. But the broader trend is clear: Ethereum is no longer just competing with Bitcoin—it is carving out its identity as the backbone of decentralized and traditional finance alike.
As Wall Street piles into ETH and banks experiment with on-chain settlement, Ethereum’s claim to be the future of finance grows stronger. Whether it outperforms Bitcoin in this cycle remains to be seen, but one thing is certain: Ethereum has secured its place at the center of the crypto narrative.

Strong Support at $4448The blue is the demand zone and the red is the supply zone. So as you can tell demand’s beginning at $4448.

ETHUSD marks the universal Strong Buy signalMarket Picture — Technical Overview
Investing.com notes a universal Strong Buy signal on all key timeframes (1 day, 1 week, 1 month). MA indicators: Buy 12 / Sell 0; indicators: Buy 9 / Sell 0.
RSI ≈ 55.6 (Buy)
STOCH ≈ 71 (Buy)
MACD ≈ 11.7 (Buy)
ADX ≈ 31 (Buy)
TipRanks also gives an overall Buy rating, with an overweight MA (8 Buy, 4 Bearish) and indicators (3 Buy, 1 Bearish).
Binance points out that the price is trading above all key EMAs — EMA7 ($4,542) acts as support, EMA25 ($4,309) confirms the medium-term trend.
Short-Term Forecast
According to LiteFinance (Elliott analytics), the final wave of the impulse is forming on the H4 chart, with a forecasted end around $5,523.99. Strategy: entry around $4,581, with a target above $5,500.
Current market dynamics and forecasts
The market is testing the key support of $4,600 amid institutional accumulation and an inflow into ETF products. If it consolidates above, a subsequent impulse to $5,000 is possible.
There are optimistic forecasts:
Tom Lee (Fundstrat) expects ETH to grow to $5,500 in the near future and to $12,000 by the end of the year.
Market valuations point to a new ATH of around $5,000, with Myriad forecasts showing up to 80% probability.
ETH recently hit a new all-time high of $4,945, with a market cap of nearly $600 billion.
Despite recent consolidation, analysts remain optimistic and see potential for $7,000 by year-end amid favorable macro and regulatory conditions.

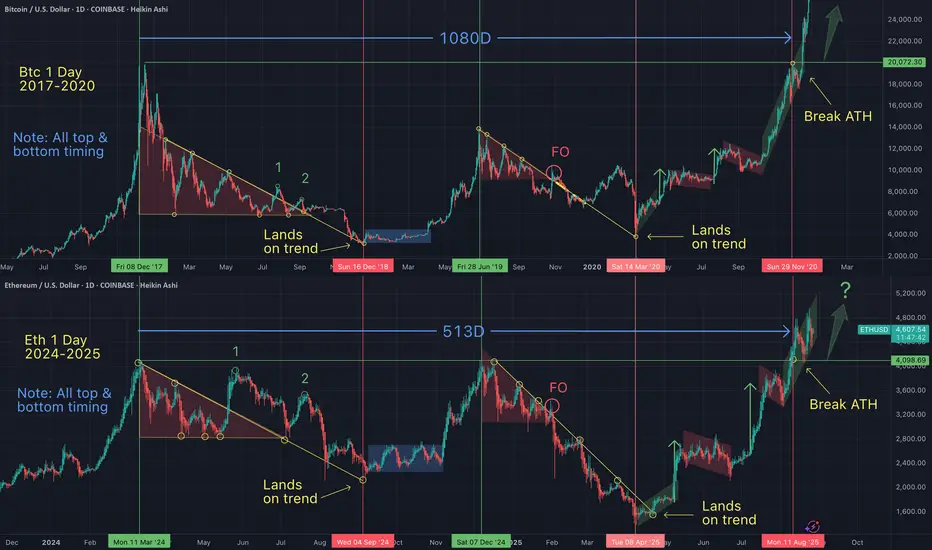
ETH to $7.5k by Jan 2026 – Cycle Repeat Incoming?Ethereum has survived another brutal bear and is now showing signs of repeating its classic cycle structure. Previous runs saw 6,000%+ rallies followed by 80–90% corrections, and the current setup looks eerily similar.
If history rhymes, ETH could push toward $7,500 by January 2026 as the next expansion phase plays out. My invalidation level is a sustained break under $3k, but as long as price holds, I’m staying bullish on ETH.
Cycle math + Fib extensions + market psychology = roadmap to 7.5k.
Definitely not written by chatgpt.

Eth on high time frame
"For Ethereum holders, focusing on the high time frame, my opinion suggests that if the price can successfully close above $4000 on the monthly chart, the next target on my roadmap is $8000. This analysis reflects my personal view and may be subject to updates."
If you have further details to share or require additional assistance, feel free to let me know!

CRV : Will suffering be broken?Hello friends
Well, after reaching a resistance and hitting a higher ceiling, the price has fallen in the two movement logs that we have specified for you.
Now the price has been compressed in a support area and we have to wait for it to move to the specified targets if this range is broken.
*Trade safely with us*

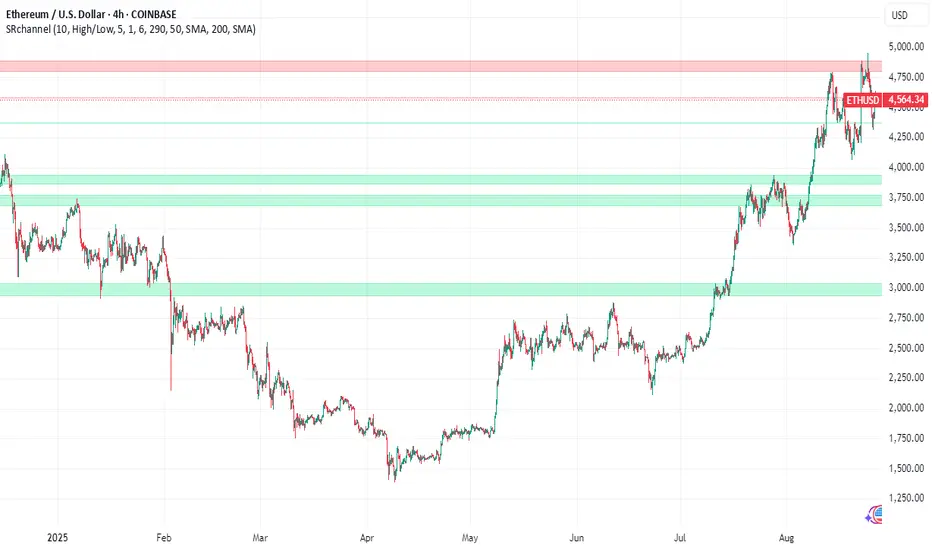
Ethereum: when levels guide the tradeEvery trader knows: entering the market is one thing, but understanding where to take profit is another. Without a system, the chart turns into chaotic candles, and decisions are driven by emotions.
A recent move on Ethereum’s 4-hour timeframe clearly showed the value of structured visualization. The entry was around $4274, with price developing up to $4650, where many participants could have locked in profit before the trend shifted.
This isn’t randomness. It’s the power of levels that outline the market’s roadmap in advance: where strength is concentrated, where reversals may happen, and where profit-taking makes sense.
For beginners, such levels serve as a navigator: they reveal patterns that would otherwise take years to master.
For intermediate traders, it’s an accelerator: a tool that eliminates chaos, enforces discipline, and reduces mistakes caused by emotions.
For advanced traders, it’s about saving time and keeping strategy under control without redrawing charts manually.
For investors, it provides a visual layer of clarity: entry and exit points become easier to track, and long-term strategies gain transparency.
The market will always move on its own terms. But traders have a choice — react to chaos or build structure. Visualization of levels provides the system: it shows the market map and helps maintain discipline regardless of volatility.
Eth - These chart patterns are repeating over & over If we learn to identify common patterns we will note that they are occuring over and over...on every asset (that has a chart)...on every timeframe. When in doubt, zoom out.
I can help you see the matrix.
Bullish Ethereum will happen; New top happens upon 4900$After a clear pullback to 4399$ Ethereum is heading toward its ATH in order to break it. Candle shape near the bullish trendline and on the support level illustrates a bullish move to 4900$. A break at 4900$ means a new ATH at 5k and higher.

Ethereum at Risk? Leverage Hits Record High as AI Finance BoomEthereum (ETH), the second-largest cryptocurrency by market capitalization, is navigating a complex and dynamic environment. On one hand, Ethereum continues to emerge as the backbone of AI-powered finance, solidifying its role as the infrastructure layer for the next wave of intelligent decentralized applications. On the other hand, market participants are growing wary, as the Binance leverage ratio for ETH has surged to historic highs, a signal often correlated with heightened volatility and potential downside risk.
Adding to the intrigue, Ether recently broke out against Bitcoin, rallying by nearly 5% on Monday. While this has brought short-term optimism into the market, analysts caution that a true trend reversal will only be confirmed if ETH can flip the critical $4,700 level into long-term support.
This article explores these pivotal developments, the risks and opportunities they present, and why Ethereum remains at the center of both financial innovation and speculative fervor.
________________________________________
1. Binance Leverage Ratio Soars to Record Levels: What It Means for Ethereum
Understanding the Binance Leverage Ratio
The Binance Estimated Leverage Ratio (ELR) is a key metric that tracks the amount of open interest in derivatives relative to the reserves of the underlying asset—in this case, ETH—on the Binance exchange. A rising ELR indicates that traders are increasingly using borrowed funds (leverage) to speculate on price movements.
As of late August 2025, the ELR for Ethereum has skyrocketed to its highest level ever recorded, surpassing previous peaks from 2021 and 2022. This means that a higher percentage of Ethereum trading on Binance is being conducted with leverage, raising the stakes for both bulls and bears.
Risks of Elevated Leverage
High leverage can act as a double-edged sword:
• Volatility Amplification: Leveraged positions can exaggerate price swings. A modest move in ETH price can trigger liquidations, leading to cascading effects.
• Greater Liquidation Risk: With more traders overexposed, sudden price drops can result in mass liquidations, accelerating downward momentum.
• Market Fragility: The market becomes more vulnerable to external shocks—regulatory changes, macroeconomic data, or unexpected news events can have outsized impacts.
Historical Precedents
When the ELR reached similarly elevated levels in May 2021 and November 2022, Ethereum experienced sharp corrections shortly thereafter. These historical patterns suggest that the current surge in leverage could be a warning sign for a potential pullback—especially if ETH fails to hold critical technical levels in the coming days.
________________________________________
2. Ether Breaks Out Against Bitcoin: A Key Technical Signal
While leverage-related risk looms large, Ethereum has shown notable strength against Bitcoin in recent trading sessions. On Monday, Ether rallied nearly 5%, breaking out of a multi-month consolidation pattern against BTC. This has sparked renewed interest in whether ETH is poised to outperform Bitcoin in the near term.
ETH/BTC Breakout: A Bullish Reversal?
The ETH/BTC ratio is often used by traders to assess relative strength. A breakout in this pair suggests that Ethereum is gaining ground in terms of market dominance and investor interest.
Technical analysts point out that the ETH/BTC pair recently broke above a descending trendline that had been in place since early 2024. This move is being interpreted by many as a bullish reversal — a signal that Ethereum might be ready to lead the next leg of the crypto bull market.
The $4,700 Level: A Make-or-Break Resistance
Despite the excitement, the rally’s sustainability hinges on one key resistance level: $4,700. Ethereum previously tested this level in early 2024 but failed to break through decisively. Flipping this level into support is crucial for validating the current uptrend.
• Short-Term Bull Case: If ETH consolidates above $4,700, it could open the door to a retest of the all-time high around $4,870 and potentially push toward the psychologically significant $5,000 mark.
• Bearish Scenario: If ETH fails to hold $4,700 and falls back below, it could trigger another round of liquidations, especially given the high leverage environment.
•
With the Ethereum market teetering on a technical knife-edge, all eyes are now on price action around this critical level.
________________________________________
3. Despite Volatility, Ethereum Is Cementing Its Role as the Backbone of AI-Powered Finance
While short-term risks dominate headlines, Ethereum is quietly laying the foundation for the next generation of decentralized, AI-powered financial systems. The convergence of blockchain and artificial intelligence (AI) is rapidly evolving, and Ethereum is emerging as the preferred platform for this fusion.
Why Ethereum?
Ethereum’s core strengths make it uniquely suited to become the infrastructure layer for AI-integrated finance:
• Smart Contract Flexibility: Ethereum’s programmable contracts allow developers to build complex autonomous systems that interact with external data.
• Network Effects: With the largest developer community in Web3, Ethereum benefits from continual innovation and support.
• Layer-2 Scaling: Rollups and other Layer-2 solutions (e.g., Arbitrum, Optimism) enable Ethereum to handle greater transaction throughput, crucial for AI applications that require real-time data processing.
•
Key Use Cases for AI on Ethereum
1. Autonomous Financial Agents
Smart contracts can be paired with AI agents to create self-governing financial bots that execute trades, manage portfolios, or optimize yield strategies in DeFi protocols. These agents can adapt to market conditions faster than human traders, offering a competitive edge.
2. Decentralized AI Marketplaces
Ethereum-based platforms like Ocean Protocol and SingularityNET allow users to buy, sell, or license AI models and data sets. These marketplaces are democratizing access to AI, enabling developers and researchers to monetize their work without intermediaries.
3. On-Chain AI Inference
Projects are now exploring how to run AI inference—the process of making predictions from trained models—directly on-chain or via decentralized compute networks. This allows for truly censorship-resistant and transparent AI decision-making in areas like lending risk assessment and insurance underwriting.
4. AI-Powered Oracles
Oracles such as Chainlink are integrating AI to enhance the reliability and relevance of off-chain data delivered to smart contracts. This enables more accurate, real-time inputs into DeFi protocols, insurance contracts, and prediction markets.
________________________________________
4. Institutional Interest & Regulatory Clarity Fuel Ethereum’s Growth
Beyond technological innovation, Ethereum is also benefiting from increased institutional interest and a clearer regulatory environment in key markets.
Spot ETH ETFs Drive Demand
The approval of spot Ethereum ETFs in several jurisdictions — including the U.S., Europe, and Asia — has contributed to a surge in institutional demand. These financial products allow traditional investors to gain exposure to ETH without dealing with wallets or private keys.
In the months following ETF approvals, Ethereum saw:
• A sharp increase in institutional inflows.
• Greater liquidity and reduced volatility.
• Renewed bullish sentiment among long-term holders.
Regulatory Clarity Emerges
Regulatory bodies have begun to differentiate Ethereum from other crypto assets, often classifying it as a commodity rather than a security. This distinction has major implications for how ETH is treated under financial regulations, and further cements its status as a legitimate and investable asset.
________________________________________
5. What Comes Next: Scenarios to Watch
Bullish Scenario
If Ethereum can maintain momentum and flip $4,700 into support in the coming days, the path to new all-time highs becomes much clearer.
• Key Price Levels: After $4,700, the next resistance is at the 2021 all-time high of $4,870. Beyond that, price discovery could push ETH toward $5,200–$5,500.
• Narrative Boost: A growing narrative around AI + DeFi convergence could bring a fresh wave of speculative interest and developer activity to the Ethereum ecosystem.
Bearish Scenario
However, if ETH fails to hold $4,700 and the high leverage ratio on Binance triggers a liquidation cascade, a retracement to $4,300 or even $4,000 is possible in the short term.
• Market Sentiment: Leverage unwinding could lead to panic selling, particularly among retail traders.
• Macro Risk: Any unfavorable macro developments (e.g., interest rate hikes, geopolitical tensions) could exacerbate the downtrend.
________________________________________
Conclusion: Ethereum at a Crossroads
Ethereum stands at a crossroads — balancing short-term price volatility against immense long-term potential. The record-high leverage ratio on Binance is a flashing warning sign for traders, suggesting the possibility of a pullback in the face of overheated speculative behavior.
Yet beneath the surface, Ethereum is evolving into the foundational layer of AI-powered, decentralized finance. As smart contracts become smarter and more autonomous, Ethereum’s role as the infrastructure for intelligent financial systems is becoming increasingly clear.
The recent 5% rally and breakout against Bitcoin signal optimism, but all eyes are now on $4,700. If this critical level becomes support, Ethereum could be poised for a breakout that finally fulfills its promise — not just as a digital asset, but as the backbone of an entirely new financial era.
ETH Long Setup 4000$ was a resistance and its now support so he come 1 time back we hit ATH and now we come back for the final Move much conflunce Trendline FiB engulf lets go

#ETH/USDT#ETH
The price is moving within a descending channel on the 1-hour frame and is expected to break and continue upward.
We have a trend to stabilize above the 100 moving average once again.
We have a downtrend on the RSI indicator that supports the upward move with a breakout.
We have a support area at the lower boundary of the channel at 4300, acting as strong support from which the price can rebound.
We have a major support area in green that pushed the price upward at 4330.
Entry price: 4544.
First target: 4646.
Second target: 4830.
Third target: 4995.
To manage risk, don't forget stop loss and capital management.
When you reach the first target, save some profits and then change your stop order to an entry order.
For inquiries, please comment.
Thank you.

ETHUSDT ETHEthereum has shown bullish strength in recent weeks and has formed several positive patterns. I believe it will target the $8,500 level after breaking the top at $4,900.
