ETH-Daily : Bears in Control - Bulls Waiting for Right momentConsidering the liquidity that price may still sweep, Ethereum’s daily structure remains bearish for now, with a possible drop toward 3000 and a potential rebound from the 2700–2900 area.
Ethreum

ETH-----Sell around 3930, target 3850 areaOctober 30th Ethereum (ETH) Contract Technical Analysis:
On the daily chart, yesterday's close was a small bearish candle, indicating a continuous decline. The price is below the moving average, and the accompanying indicators show a golden cross with decreasing volume. While the overall trend is clearly downward, attention should be paid to the possibility of a breakout and continuation of the downward movement. In the short term, focus on range-bound trading, with resistance around the 3950 area. The hourly chart shows a generally downward trend with some volatility. Although the decline hasn't been particularly strong, experience suggests a high probability of a sharp drop, so this opportunity should be seized.
Today's ETH Short-Term Contract Trading Strategy:
Sell at the 3930 area, stop loss at the 3960 area, target 3850 area;

Wyckoff Distribution - Cycle Top Is In?This idea is sharing the potential for the top being in for ETH and lower timeframe starting the final phase of Wyckoff Distribution.
🔍 Pattern Identification
Phase A–E of a Wyckoff distribution.
Buying Climax (BC) → Automatic Reaction (AR) → Upthrust (UT/UTAD) → Sign of Weakness (SOW).
The “5a / 5b” double top corresponds to the Upthrust After Distribution (UTAD).
The price currently sits near the midpoint of the channel, testing resistance around the 50-day SMA (yellow) and prior support-turned-resistance zones.
📉 Statistical Likelihood of Breakdown
Historically, when this distribution schematic appears in crypto or equities, it resolves to the downside roughly 65–75% of the time — provided:
Volume confirms weakness (volume declining on rallies and expanding on downswings).
Lower highs and lower lows continue forming after the UTAD.
Momentum (RSI) fails to confirm new highs (bearish divergence).
RSI is below 50 and rolling over → neutral-to-bearish momentum.
The price rejected near the 50-day SMA and upper channel resistance.
Structure shows multiple failed breakout attempts above $4,200–$4,400, aligning with a classic distribution top.
📊 Based on backtests of Wyckoff distribution-type structures (in both traditional and crypto markets):
Downside resolution probability: 70% ±10%.
Neutral consolidation (sideways): 20%.
Bullish continuation / spring scenario: 10%.
🧠 Validity of the Pattern on the Weekly
✅ Higher timeframe = stronger implication.
On the weekly chart:
The structure has clear symmetry to Wyckoff’s Distribution Schematic.
There is a confirmed lower high (5b) near prior ATH.
Volume contraction aligns with a mature distribution.
RSI failing to reclaim 70 and diverging from price adds to bearish confluence.
In Wyckoff methodology, patterns across multiple timeframes that confirm each other (daily + weekly) dramatically increase probability of follow-through.
🧩 Multi-Timeframe Synthesis
Daily: short-term distribution (local microstructure)
Weekly: intermediate distribution (macro confirmation)
Monthly: major cycle-top distribution (potential cycle exhaustion)
These three are nested fractals — the monthly chart is the “parent” structure of the same Wyckoff behavior visible on lower frames.
That multi-timeframe confluence adds tremendous weight:
In Wyckoff terms, a valid distribution on monthly + weekly + daily timeframes is statistically one of the highest-probability setups for a major markdown (≈ 80–85% historical probability once confirmed).
🧩 Fractal Nature of Wyckoff Structures
Markets are fractal: smaller patterns nest inside larger ones.
The daily distribution identified is the micro-mechanics — the short-term redistribution of supply near resistance.
The weekly structure is the intermediate framework confirming that supply dominance isn’t just a blip but a developing trend.
The monthly is the macro cycle top — the large-scale distribution that governs the whole market phase (multi-year).
📉 Typical Retrace Targets in Multi-Timeframe Distributions
When a smaller-scale breakdown completes the macro distribution:
Retrace depth: often 50–65 % of the total distribution height.
For ETH, measured from the $4,800 top to the $1,400 macro base → retracement targets of $2,500–$3,000 are classic.
In extreme cases (full Phase E markdown), price can revisit or slightly undercut the long-term demand line (~$1,800–$2,000) before new accumulation begins.
#ETH/USDT Buy Opportunity#ETH
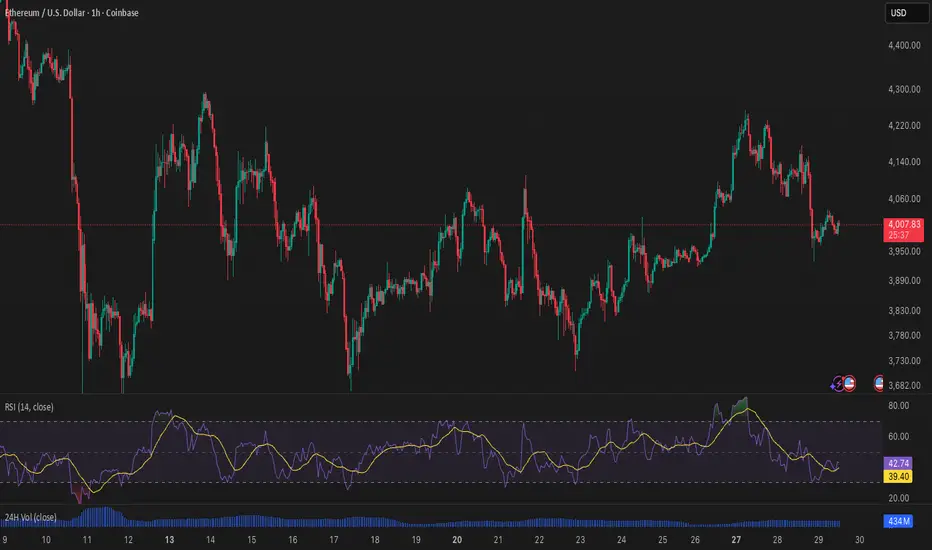
The price is moving within an ascending channel on the 1-hour timeframe and is adhering to it well. It is poised to break out strongly and retest the channel.
We have a downtrend line on the RSI indicator that is about to break and retest, which supports the upward move.
There is a key support zone in green at the 3900 price level, representing a strong support point.
We have a trend to stabilize above the 100-period moving average.
Entry price: 4020
First target: 4050
Second target: 4100
Third target: 4179
Don't forget a simple point: capital management.
Upon reaching the first target, save some money and then change your stop-loss order to an entry order.
For any questions, please leave a comment.
Thank you.

ETH-----Sell around 4035, target 3960 areaETH Contract Technical Analysis (October 29th):
On the daily chart, yesterday's close was a small bearish candle, indicating a consecutive decline. The price is still within a range, and the accompanying indicators show a golden cross with decreasing volume. The overall trend remains bullish, but the price is currently in a range-bound movement. However, attention should be paid to data releases and news-driven stimuli. On the hourly chart, the price faced downward pressure during the US session, but rebounded from early support this morning. The current candlestick pattern shows a consecutive bullish reversal, while the accompanying indicators show a bearish cross with decreasing volume. However, the four-hour chart shows significant price suppression, with resistance around the 4035 area.
Today's ETH Short-Term Contract Trading Strategy:
Sell at the 4035 area, stop loss at the 4070 area, target 3960 area;

Ethereum (ETH/USDT): Possible Short OpportunityHi guys!
ETH is currently testing the ascending trendline support after forming a potential lower high near the $4,165 zone. The structure shows early signs of weakness as buyers failed to maintain momentum above the last swing top.
A clean break below the trendline could confirm a short-term bearish shift, targeting the $4,030–$4,000 support zone, which aligns with the previous breakout level. The invalidation of this setup would occur if the price breaks and holds above $4,165, signaling renewed bullish momentum.
important levels:
Resistance: $4,165
Support: $4,030 – $4,000
Bias: Bearish below $4,165

Ethereum Buying opportunity Previous week Ethereum closed above weekly resistance level $4093. Currently trading within a top range. ETH has decisively broken above the prior week's High, signalling continued bullish momentum. The probability of ETH retesting its previous all-time high of $4,951 in the near future is very high.

#ETH/USDT : Another Attempt To Resume Upward Movement
#ETH
The price is moving within a descending channel on the 1-hour frame, adhering well to it, and is heading for a strong breakout and retest.
We have a bearish trend on the RSI indicator that is about to be broken and retested, which supports the upward breakout.
There is a major support area in green at 3826, which represents a strong support point.
We are heading for consolidation above the 100 moving average.
Entry price: 3831.
First target: 3920.
Second target: 3969.
Third target: 4200.
Don't forget a simple matter: capital management.
When you reach the first target, save some money and then change your stop-loss order to an entry order.
For inquiries, please leave a comment.
Thank you.

ETHUSDTBINANCE:ETHUSDT have a amazing trend because this is second the best crypto an head of all project so is in watchlist of best traders.
Support for buy: 3750$
Resistance for targets: 4045 - 4200 - 4435 - 4755
Please your risk management.

GOLD will rise.XAUUSD has been moving sideways this week and good probabilité it will rise today or next week when markets will reopen. Also some news coming so we will see it's reaction from the fundamentals.


#ETH/USDT : Another Attempt To Resume Upward Movement#ETH
The price is moving within a descending channel on the 1-hour frame, adhering well to it, and is heading for a strong breakout and retest.
We have a bearish trend on the RSI indicator that is about to be broken and retested, which supports the upward breakout.
There is a major support area in green at 3826, which represents a strong support point.
We are heading for consolidation above the 100 moving average.
Entry price: 3874.
First target: 3920.
Second target: 3969.
Third target: 4200.
Don't forget a simple matter: capital management.
When you reach the first target, save some money and then change your stop-loss order to an entry order.
For inquiries, please leave a comment.
Thank you.

ETH(20251022) market analysis and operationTechnical Analysis of the ETH Contract on October 22nd:
Today, the large-scale daily chart closed with a small negative candlestick pattern. The K-line pattern continued to decline, and the price remained at a low level. The accompanying indicator formed a downward death cross, and the overall downward trend is still very clear. Although the overall momentum is not strong at present and remains within the range, such a trend is easily affected by news or data, and a significant downward breakout is likely. Therefore, the short-term trading strategy of the high point remains unchanged. The short-term hourly chart showed downward pressure on the price in the early morning. The current K-line pattern continued during the Asian morning. The accompanying indicator formed a downward death cross and broke through the previous day's low. Therefore, today is a simple matter. Focus on the day and wait for a pullback correction in the European session before entering the market and selling directly. The strategy and timing are relatively clear, so please strictly follow it.

Ethereum ETH Final Upside LegCRYPTO:ETHUSD found buyers at the equal legs support zone of $3629–$3363, triggering a bullish reaction from that area. As long as October low holds, then Price action now favors a move higher toward the next target to the upside at $5300 - $5880

ETHUSD Is showing a great buy opportunity - low risk high rewardETHER - ETH/USD experienced a big drop to the downside like most other cryptocurrencies... but it nows has very clear signs of a major bullish movement ahead. There is currently a head and shoulders pattern forming which has given us high confidence that it will head to the upside. BUY NOW!

ETH - NEUTRAL, but bearish bias#ETHERUM - price update:
👉Monthly = bullish, if bulls stay above 3185$ |
Double top resistance Monthly around 4800$ (no breakout).
👉Weekly = Neutral area: 4200 | 3185$
👉Possible bearish retest daily completed under 4080$ ✅📉
My bias:
Consolidation phase (monthly).
Neutral area, lower support haven"t been tested yet. 📉
I expect to slee a slow correction toward 3200 - 3100$ to grab liquidities, before to see another potential leg up!
Under 4100$, bear may be in control.
A daily candle close above 4800$ is required to confirm bull breakout HTF.
Possible setup & important levels in my charts.

ETH busy with Right shoulder makingEthereum (ETH) is currently showing signs of completing a classic inverse head and shoulders pattern, which is a bullish technical indicator suggesting a potential trend reversal.
🧠 Pattern Breakdown
- Left Shoulder: Formed late 2024.
- Head: The lowest point, marked during the crash at April 2025.
- Right Shoulder: Recently completed, with ETH testing the neckline resistance around $4800.
📈 Implications
- If ETH breaks and holds above the neckline, it could signal a strong uptrend.
- Analysts like Tony Severino predict a potential rally toward $10,000–$12,000, based on the measured move from the head to the neckline.
- Whale accumulation is also rising, adding fuel to the bullish sentiment.

ETH: Head and Shoulders Pattern Targets $3,800Hi Teams!
Ethereum has recently completed a head and shoulders formation. The neckline around $3,920 was broken decisively, confirming the pattern and triggering further downside momentum.
After the breakdown, the price slipped toward the lower boundary of the descending channel, finding temporary support near $3,860. A short-term corrective move is now unfolding, with ETH likely to retest the neckline zone and the upper boundary of the channel before facing renewed selling pressure.
As long as Ethereum trades below $3,920–$3,940, the bearish structure remains valid. A rejection from this area could accelerate the decline toward the target of the head and shoulders pattern, which aligns with the $3,800–$3,820 support zone.
However, a clear breakout above the descending trendline would invalidate this bearish outlook and could open the way for a recovery toward the $4,000–$4,050 resistance area.
Levels to Watch:
Resistance: $3,920 – $3,940 / $4,000 – $4,050
Support: $3,860 / $3,800 – $3,820
Bearish Target: Around $3,800 zone
Outlook: Bearish while below $3,920.

ETH 6K to 8K !? My analysis atm for ETH
Possible to bounce right back to ATH and price discovery mode to 6K hopefully 8K+
What ya all think, drop it bellow ?

Ethereum’s Hidden Fractal Points to $33K by November 2026Most of the space seems to think that the bull market is officially over, that the four-year cycle has come to a close. For most of the cycle, I have thought that way too. 1,064 days is up, and that’s the longest a Bitcoin cycle has ever gone for. So, the idea that the same thing will play out again is very valid, and it’s entirely possible that it is indeed the end. However, my stance is very different — I still think we have one year left in the tank, and I will present a lot of evidence to support why I believe this and why I’m sticking to it.
If you’ve been following me for a while, you know that we’ve found some very interesting bar patterns in history that keep on repeating, and this will be the primary source of evidence used in my thesis.
Bar Pattern Fractals
I have tested hundreds of indicators over the last six years and bought thousands of dollars’ worth of indicators, and in the end, the highest success rate has come from simply following bar pattern fractals. They repeat over and over. They are hard to find, but once you do, you can ride them for months.
ETH 2017 Fractal
What you see above is a fractal I have been following for months now. It has been mirroring the 2017 cycle, with some parts nearly identical in movement and timing, with only a few small deviations here and there. The macro pattern continues to play out like clockwork.
Take a look at this TA from March 2025. We caught near the bottom, called for max pain, and discussed this fractal that could be playing out. The ETH call was under 2000 back then.
I also published TAs on Chainlink and its repeating bar patterns. It was straightforward for catching big macro moves for LINK.
As you can see, these are just two examples of many fractals I’m following. The main one is ETH because it’s been a 1:1 mirror for the most part. The last spike down was a deviation for sure — well, at first I thought it was on the Bitstamp chart because it has the most historical data for ETH, but when I switched to the Binance chart, I found something very interesting.
A view of the bar pattern fractal is telling us where we are.
When switching to the Binance chart, we see a very interesting wick of 26% that nuked the market during that time — very similar to what Binance has done this time around. You cannot make this stuff up. So at first, I thought it was a small deviation, but in fact, after looking at this chart, it’s still a mirror, even including that huge scam wick of 27%. Amazing.
So as you can see, in terms of the bar pattern fractal, I simply cannot ignore the fact that this keeps mirroring, and if it continues, it’s possible that we have one more year left in this bull market, and that this four-year cycle thesis is, in fact, a massive bear trap.
If we take a look at the monthly candle that shook a lot of players out last cycle before the run-up, we can see that we printed a candle with wicks on both ends — very similar to what we are forming right now.
If we zoom into that moment on a smaller timeframe, you can now see the moves are similar — a big drop into a double bottom followed by a slow grind up. This is how ETH normally puts in bottoms.
Looking at ETH’s RSI levels on the monthly chart — during the first cycle, when it broke the all-time high, RSI was extremely overbought at 87. On the last cycle, it was 82. This cycle, ETH is at an all-time high and the RSI is only 59. We’re not even in the overbought range yet — there’s so much room for ETH to expand, it’s crazy.
Since its inception, ETH has always pulled off the same move: one very aggressive wave with an aggressive pullback, followed by one smaller wave that creates a higher high to finish off the cycle. It’s done this every time.
Which means that if the bar pattern fractal continues to mirror, then wave 1 tops in the first week of January 2026, followed by a massive correction that will again fool everyone into thinking the four-year cycle is 100% over. But what if ETH puts in a bottom in February 2026 and rallies back up to all-time highs? Nobody would believe it — the disbelief would be strong because everyone would have sold the top in Q4 2025 due to the four-year cycle theory.
The second major piece of evidence I’m leaning on is the Russell 2000. Since its inception, the Russell 2000 has done the exact same thing before expansion comes:
Double top
Second drop bear trap
V-shaped recovery back to all-time high
Expansion breakout
Same thing every time. Look at the chart and tell me we’re not going into expansion — there’s a very high chance. The last two times, we got that massive monthly candle breakout in November.
Which brings me to the main point — every time the Russell goes into expansion, Bitcoin has started its most aggressive run. The last three times, Bitcoin went on to break its all-time high and put in a cycle top within an average of 355 days.
Gold, shown above, is so close to the 4.236 extension right now that it would be crazy to buy here. There’s a high chance of a major top coming in, and we’re about to see a major rotation back into Bitcoin with those gains.
Just take a look at the Power of Law model for Bitcoin — the bull market hasn’t even started yet.
It’s crazy that people are calling the cycle top with the Mayer Multiple sitting at 1.19.
Conclusion
My view is that there is one more year left in this uptrend in crypto. Bitcoin has turned into a different beast. It has completely detached itself from the rest of crypto for the most part, but the first expansion is coming in 2026. If the bar pattern does not deviate, then greatness lies ahead.

$ETH UPDATE: #Ethereum’s weekly candle is about to close below CRYPTOCAP:ETH UPDATE:
#Ethereum’s weekly candle is about to close below the $4,000 support, confirming the bearish outlook. As mentioned before, my stance remains bearish and you can see the same sentiment in my recent Bitcoin analysis as well.
The key support zone for ETH now sits between $3,500 and $3,300, around the 1W 50 EMA. If price fails to hold this area, the next downside targets will be $3,000 and $2,800. I’ll also be updating the Bitcoin weekly chart later today (Sunday) to track how both charts align in this bearish setup.

ETH Long into Q4📈 Ethereum / USD (1W) – Macro Outlook
Ethereum is consolidating after a strong rally, currently finding support near the 0.382–0.618 Fibonacci retracement zone — a historically key area for continuation setups.
If this structure holds, ETH could be gearing up for its next macro leg, with potential upside targets aligning around:
⚪ Very Likely: ~$6,400
🔵 Likely: ~$7,800
Key Support Levels to watch:
$3,850 → short-term support
$3,220 → major retracement support
As long as ETH maintains higher lows above the 0.618 region, the macro bullish structure remains intact — indicating that Ethereum may just be cooling off before its next impulse.
🚀 Macro trend still favors continuation, but short-term volatility remains high.
#Ethereum #ETH #Crypto #TechnicalAnalysis #ETHUSD #Altcoins #CryptoTrading

ETHBTC Rally into Q4📊 Ethereum vs Bitcoin (ETH/BTC) – Weekly Chart Update
ETH/BTC has officially broken out of its long-term downtrend (yellow trendline) that’s been in play since 2022. After the breakout, price is now retesting the previous resistance area — a classic move before potential continuation.
🔹 Key Levels to Watch:
Resistance Zone: 0.059–0.063 BTC (Fibonacci 1.272–1.414 extension zone, highlighted in yellow)
Major Target: 0.067 BTC (Fib 1.618)
Support: 0.033–0.035 BTC
Long-term support: 0.024 BTC
A successful hold above the breakout zone could confirm a trend reversal in favor of Ethereum dominance. A rejection, however, might lead to another leg down before accumulation.
🚀 Will ETH finally regain strength vs BTC, or is this just a relief rally?
#ETHBTC #Ethereum #Bitcoin #CryptoTrading #TechnicalAnalysis #AltcoinSeason #CryptoChart
