Winter is coming part 2This is a follow up idea to my last post just to make things more interesting.
Ethreum

Sharing of recent ETH trading ideasETH rebounded to 4290 this morning before encountering resistance and falling back. Support lies between 3700 and 3800. If it holds, there's a good chance of another rebound. If not, it may continue to test the 3300-3500 range.
Trading wise, you can go long around 3700-3800 to catch a rebound. If it falls below 3650, set a stop-loss and wait for the next support level.
Upward resistance lies between 4250 and 4400. If it rebounds here and then shows signs of weakness, you can go short, as the current daily trend is already bearish.
Trading involves risk. The above views do not constitute financial advice and are for educational purposes only.

$ETH will be $6,000 by ChristmasEveryone on CT has had enough, they’re calling for a bear market, that’s exactly when things erupt. There’s euphoria with gold right now, that’s exactly will probably end bad for those who buy the top, the rotation will be into ETH pushing it to ath and then alts erupt. Believe in something

BMNR - Buckle up for a rocket launchBMNR - our Tommy boy's MSTR of ETH looking incredibly bullish here.
Multiple reasons to be bullish here -
- All anchored VWAPs converging here
- Above 50MA
- Nice volume build up
- Above the volume shelf
- ETH heading to new highs
- Tommy boy bought more n more ETH coins
Long anywhere here if your are not already
Conservative targets -
Target 1 - 68
Target 2 - 98
Target 3 - 112
Stop loss below 40

ETH - MONTHLY DOJI - UPDATE:#ETH - price analysis: Tricky times Ahdea? 📊
Global Structure (Long-Term View):
🔸The chart remains bullish above the $ 3,180 level (monthly view). 📈
🔸That said, prices are stuck under a potential double-top ATH resistance at 4,800– 4,950. ⚠️
🔸Monthly High: $ 4,755
🔸Monthly Low: $ 3,435
🔸Current price is showing a Doji candle on both monthly and weekly charts, sitting exactly in the middle range from low to high. Neutral vibes for now! 🤔
Daily View:
Price is holding above the previous key resistance zone of 3,700 - 3,750.
Upper Key Resistances to Watch:
$ 4,300 - $ 4,540 - $ 4,75 - $ 4,950
What to Expect (Medium-Term Outlook):
We're in a sideways phase within the yellow zone: 4,250– 3,700, until a real breakout happens.
If bulls keep consolidating above $ 3,180, an upward move seems likely.
Tricky moment-there's literally no clear long-term or medium-term direction right now.
I've highlighted key levels and possible setups in my charts below. #DYOR
In case of a bad market event and bearish breakout, 2,850 and 2,500 could act as key bottoms.
My Take: This feels like a consolidation trap, bulls or bears, who's winning?
Share your thoughts below!
Bullish rebound or more downside? 👇
Key levels, yellow zone, and Doji highlights in my charts.

#ETH/USDT the Final Push Before the Parabolic Run!#ETH
The price is moving within a descending channel on the 1-hour frame, adhering well to it, and is heading for a strong breakout and retest.
We have a bearish trend on the RSI indicator that is about to be broken and retested, which supports the upward move.
There is a major support area in green at 3900, which represents a strong support point.
We are heading for consolidation above the 100 moving average.
Entry price: 4156
First target: 4274
Second target: 4405
Third target: 4583
Don't forget a simple matter: capital management.
When you reach the first target, save some money and then change your stop-loss order to an entry order.
For inquiries, please leave a comment.
Thank you.

ETH/USD Bearish Retracement from Daily FVG Zonea bearish retracement setup on Ethereum (ETH/USDT) in the daily timeframe. After a strong bearish impulse, the price entered a highlighted Daily Fair Value Gap (FVG) zone — a potential area of supply where sellers may regain control. The projection indicates a likely short-term pullback into the FVG before continuing downward toward Target 1 (≈ $3,601) and Target 2 (≈ $3,399).

ETH – Key Scenarios #ETH – Key Scenarios
Current price: $3,913
Ethereum remains inside a corrective structure following rejection near $4,250–$4,300.
The chart outlines three potential paths — continuation, consolidation, or deeper correction.
Technical Context
• ETH lost momentum after failing to break above the prior swing high near $4,300.
• Price action remains guided by a descending channel, while short-term volatility spikes around macro events.
• The mid-term structure depends on whether ETH can break above this channel or remain trapped within it.
1️⃣ Bullish Continuation (White / Cyan Path)
• Structure: Impulse wave 1–2–3–4–5 forming a new major wave (3).
• Confirmation: breakout above $4,200–$4,300, supported by high volume.
• Targets:
– Wave 3 ≈ $4,700–$4,900
– Extended 5th ≈ $5,200+
• Invalidation: daily close below $3,700.
• Probability: Moderate–High, if risk appetite returns and BTC leads the rally.
2️⃣ Extended ABC Correction (Orange Path)
• Structure: A–B–C correction unfolding toward lower Fibonacci retracements.
• Key levels:
– Wave A ≈ $3,600
– Wave B bounce ≈ $3,900–$4,000
– Wave C ≈ $2,800–$2,600
• Narrative: macro tightening or BTC rejection near resistance.
• Probability: Moderate, especially if liquidity contracts or sentiment weakens.
3️⃣ Channel Consolidation / Range Scenario (Gray Path)
• Structure: price remains within the descending channel, oscillating between support and resistance.
• Range:
– Upper boundary ≈ $4,200–$4,300
– Lower boundary ≈ $3,400–$3,600
• Character: prolonged sideways correction forming a triangle or complex W-X-Y pattern.
• Implications: market indecision, volatility compression before the next macro move.
• Probability: High (short-term) — typical after sharp drops and in anticipation of new catalysts.
🧭 Summary
• ETH is currently consolidating inside a descending channel, forming a decision point for Q4.
• Three paths remain open:
- Breakout and impulsive continuation above $4,300.
- Range-bound sideways phase within the channel.
- Full ABC correction toward $2.8K–$2.6K.
Trend bias: Neutral-bullish while above $3,700, turning bearish on a confirmed channel breakdown.

ETH : BUY OR SELL ?Hello friends
Given the good decline we had, there was a good opportunity to buy at good prices with capital and risk management and in steps and move towards the specified goals.
*Trade safely with us*

#BTC and #ETH: key levels to watch in coming weeksBTC
The recovery pattern from the September lows still looks more like a medium-term correction rather than the completion of the broader bullish cycle.
As long as the price holds above the macro support zone at 108–102K and does not close below the 50-week moving average for more than two consecutive weeks, I consider the macro uptrend intact and expect the correction to conclude in Q4.
However, while Bitcoin remains below 118K, another wave of selling toward the 108K area in the coming weeks cannot be ruled out before a potential new leg higher.
Chart (taken on Oct 12):
Short-term resistance zone: 115.5–118K
Macro support zone: 108–102K
⸻
ETH
The price has moved deeper into the macro support area highlighted in earlier reviews and reached key weekly moving averages (20SMA and 21EMA), which have historically provided support to every major growth cycle.
On the daily timeframe, as long as the price remains above 3290, the main scenario remains bullish — with potential for new highs in Q4.
Ideally, I would like to see ETH hold the 3840–3700 zone during the current recovery attempt and form a constructive consolidation above the 21/50-day moving averages.
If assets maintain their macro support zones, I expect Ethereum could once again outperform Bitcoin in the next phase of the uptrend.
Chart:
Short-term resistance zone: 4180–4360 / 4550
Local support zone: 3960–3700
⸻
In light of the historic liquidation event we witnessed last week, I’d like to share a quote from one of the veteran traders and original Market Wizards — Peter Brandt:
"Greetings crypto traders whose Friday was not a cheerful day. I need to tell you that there will be better tomorrows. While the tunnel may seen dark, there can be bright days in front of you depending upon how you respond to your present circumstances.
...
Wealth - real wealth that is secure and lasting - does not come from "bet the farm" speculative bets. Real wealth comes from accepting investing as a marathon, not a sprint.
Real wealth comes from controlling risk, not from taking huge gambles. Real wealth comes in the accumulation in small pieces, gained, then protected.
I love that the younger generation to which you belong has taken an interest in speculative markets such as crypto and futures. Welcome.
This is the arena I have operated in now in the 6th different decade starting in the 1970s.
I wiped out several accounts in the early days. These are not fond memories. But I kept at it. For me I learned how to control my risk. What does that mean exactly?
Well, for me it means to limit my risk on any given bet to no more than 1% of my total pot. I know that sounds too tame to be meaningful, but if you do not want to go through what you experienced this past week, then perhaps it should be meaningful.
It also means that I do not bet any more than 3% of my entire trading capital on the composite of highly correlated bets.
I have noticed that some in the crypto space wear as a badge of honor that they can sit through 80% drawdowns. Well, that is NOT a badge of honor. It is a crown of shame. Anyone who thinks lightly of 80% drawdowns will end up rekt at the end of the game. If you doubt me, then stay on your present course and find out.
...
So, I encourage you. Take this past week as a serious lesson of investing and of life. Take ownership of your mistakes. Don't blame this past week on some "whale" or manipulator. Own it. And move forward having learned some valuable lesson "
⸻
Thank you for your attention!
In times of heightened volatility, please remember - protecting your emotional capital is just as important as protecting your financial one. Stay disciplined, patient, and kind to yourself through market turbulence - it’s part of every trader’s journey toward mastery.
Let’s leave the past behind, take the lessons it offered, and focus on the next trade with a clear vision and renewed confidence.
Wishing everyone a strong and productive start to the new week!

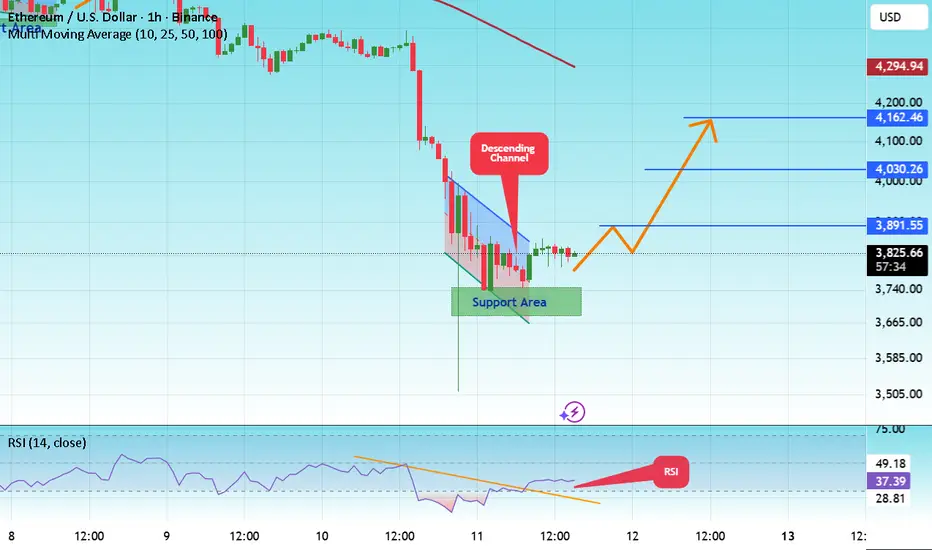
#ETH/USDT forms bullish patterns#ETH
The price is moving in a descending channel on the 1-hour frame and is expected to break and continue upward.
We have a trend to stabilize above the 100 moving average once again.
We have a downtrend on the RSI indicator that supports the upward move with a breakout.
We have a major support area in green that pushed the price higher at 3700.
Entry price: 3817.
First target: 3890.
Second target: 4030.
Third target: 4162.
To manage risk, don't forget stop loss and capital management.
When you reach the first target, save some profits and then change your stop order to an entry order.
For inquiries, please comment.
Thank you.
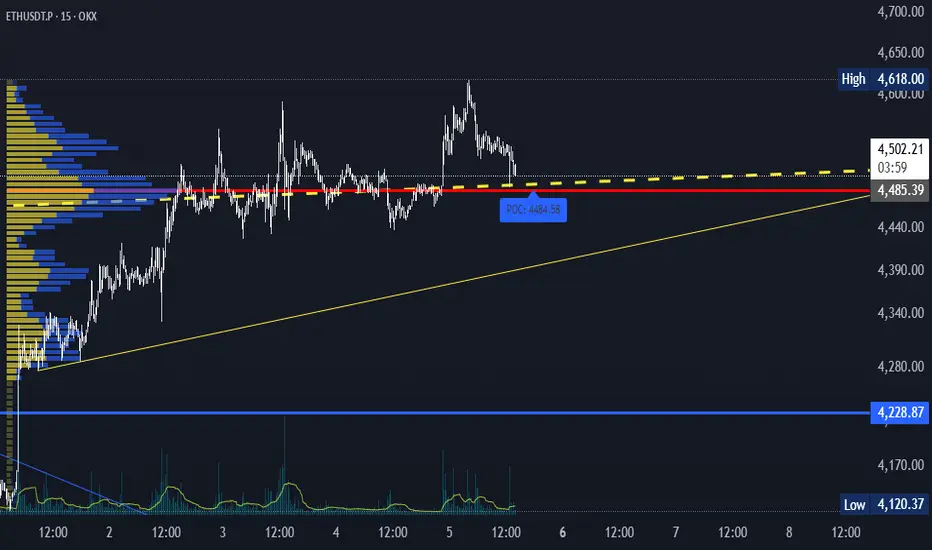
Ethereum Swing Trade Analysis - ETH LONGEthereum Swing Trade Analysis
Following a clear rejection at a supply zone after filling a daily imbalance (FVG), price action has shown notable structural changes. Specifically, we observed a break of structure on the 4-hour chart, which appears to be a direct reaction to the mitigation of this imbalance.
Additionally, a series of down-close candles on the H4 timeframe indicate potential bullish absorption, often suggestive of a reversal in momentum. This confluence, along with the recent fill of the daily fair value gap, suggests that price has likely found support at this key level.
Given these technical signals : rejection at resistance, structural break, and supportive price behavior around the filled FVG.
I am considering to enter a swing long position after filling M15 FVG imbalance.
The target for this trade is the equal highs on the buy-side liquidity around the $4,385 level.
Will be updating the course of this trade in the following days until it reaches final take profit target.
Talk to you soon !

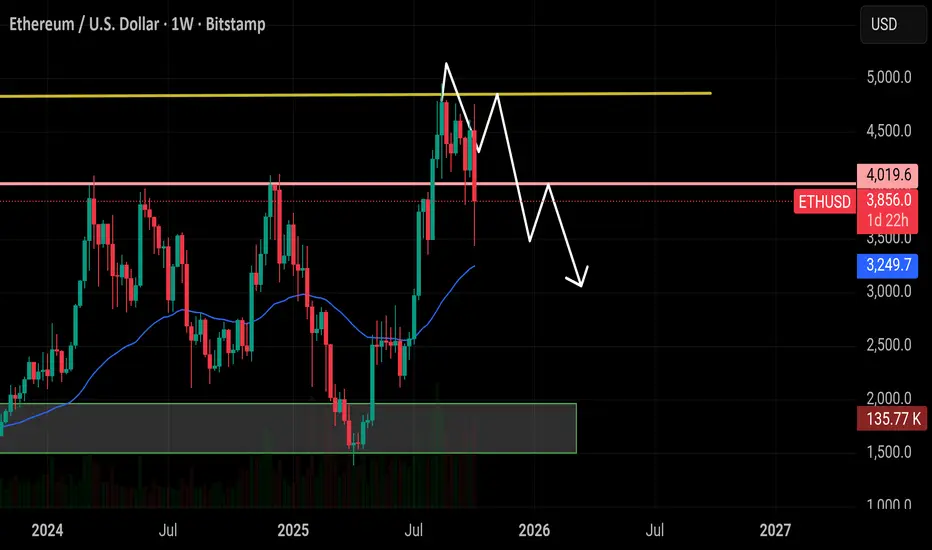
mrmoney limited ETH/USD position trading ideaprice has approached our monthly key resistance level which made price to have a bearish turn we have a minor support zone which price reacted to and has recently givenen us bullish momentum

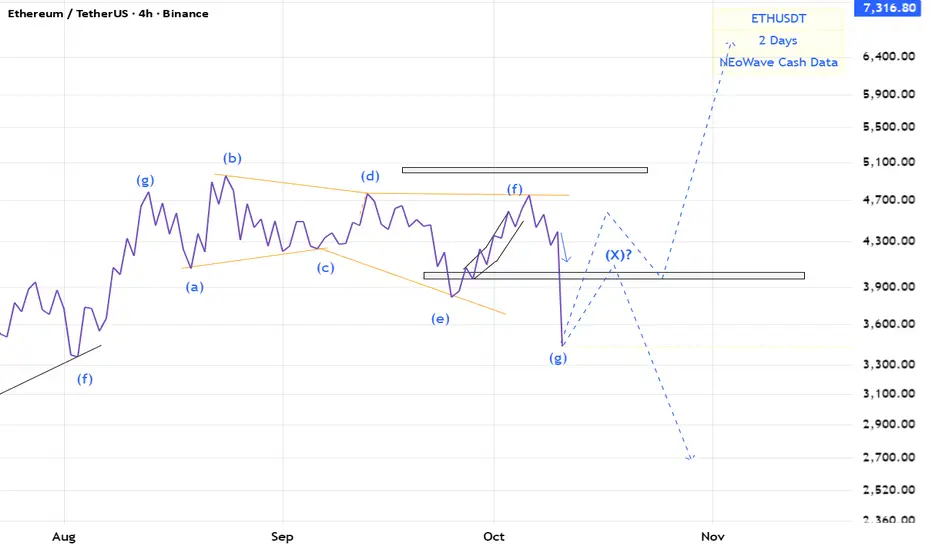
ETH(based on NEo wave)stop loss touched and now there are 2 ways for eth.
we need a post pattern confirmation for bullish wave.
or there is an x wave an correction stills go on.
$ETH hit our first target at $3,500 exactly as expected.CRYPTOCAP:ETH hit our first target at $3,500 exactly as expected. As mentioned, a short bounce from that zone played out with an $800 move, pushing the price above $4,300. Now ETH is trading around $3,800. For a sustained upside, it needs to reclaim $4,000 as support. I’m still holding my short setup if $4,000 isn’t regained, the next downside targets remain $3,500 and $3,000.
Only your like motivate me
$ETH Performing Ascending Channel
An ascending channel, or rising channel, is a chart pattern used in technical analysis to identify a security's ongoing uptrend. It is characterized by the price fluctuating between two parallel, upward-sloping trendlines.
Key components
Higher highs and higher lows:
The price consistently makes higher swing highs and higher swing lows over a period of time, indicating steady bullish momentum.
Parallel trendlines:
Two parallel lines are drawn to frame the price action.
Upper line (resistance):
Connects the higher swing highs. It represents the point where selling pressure is strong enough to temporarily stop the price from rising.
Lower line (support):
Connects the higher swing lows. This line indicates where buying pressure is strong enough to prevent the price from falling further.

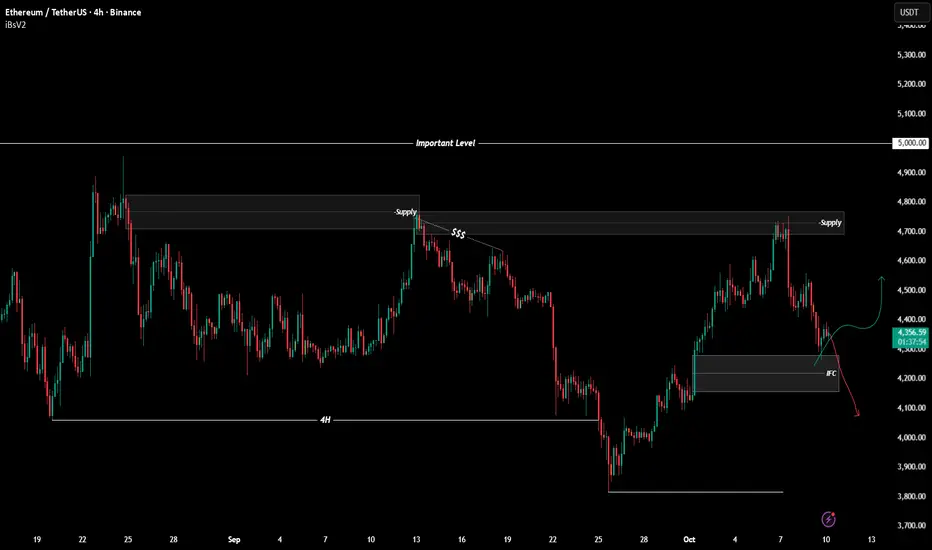
$ETHUSDT Analysis - Oct 10 | 4H Time FrameBINANCE:ETHUSDT Analysis - 4H
Hello and welcome to another analysis from the Satoshi Frame team!
I’m Abolfazl, and today we’re going to analyze Ethereum on the 4-hour timeframe.
After rejecting from the supply zone, Ethereum has reached an IFC, which could cause a price pullback.
On the 15-minute timeframe, look for confirmation signals to enter a long position — the first target is around $4,520, followed by $4,750.
Keep in mind that this setup is very risky, and no entry should be taken without proper confirmation.
The second scenario is a break below $4,200, which could provide a short opportunity targeting $3,950, and then the 4H low. (The break must be confirmed by a full candle close, not just a shadow.)
These scenarios allow you to align with price movement in both directions — the key is to wait for precise confirmations before entering any trade.
See you in the next analyses!
Stay tuned with the Satoshi Frame team...
#ETH/USDT looking extremely bullish#ETH
The price is moving within a descending channel on the 1-hour frame, adhering well to it, and is heading for a strong breakout and retest.
We have a bearish trend on the RSI indicator that is about to be broken and retested, which supports the upward move.
There is a major support area in green at 4400, which represents a strong support point.
We are heading for consolidation above the 100 moving average.
Entry price: 4455
First target: 4512
Second target: 4573
Third target: 4650
Don't forget a simple matter: capital management.
When you reach the first target, save some money and then change your stop-loss order to an entry order.
For inquiries, please leave a comment.
Thank you.

Bitcoin hits all-time high, altcoins follow suit!Bitcoin (BTCUSD) has smashed a new all-time high, reaching $125,700! The rally is fueled by steady inflows into spot ETFs, rising institutional interest, expectations of a softer Fed policy, and growing demand for safe-haven assets. Additional tailwinds include tech upgrades across networks and a revival in trading activity. This historic milestone for Bitcoin has lifted the entire crypto market. Investors are turning their attention back to top-10 altcoins — names with strong recognition, loyal communities, and clear development roadmaps.
Ethereum (ETHUSD) — trading around $4,558.76. The network has undergone major upgrades, making wallets more user-friendly and transactions faster and more stable. Layer-2 solutions are gaining traction, fees are becoming more predictable, and the network load is better distributed. As a result, investor interest in ETH-based tools and its ecosystem continues to grow. If Ethereum’s roadmap stays on schedule, it could further strengthen its position as the go-to platform for decentralized applications.
Solana (SOLUSD) — around $233.30. The ecosystem is preparing a high-performance validator module aimed at significantly boosting speed and resilience. This is critical for high-traffic use cases like exchanges, gaming, and micro-payment services. Solana is also set to gain the spotlight during a major industry conference later this year — a typical launchpad for new partnerships, grants, and product announcements. If improvements are implemented successfully, Solana could gain more ground in the fast and low-cost transactions segment.
BNB (BNBUSD) — approximately $1,208.83. The network continues to cut costs for users and developers, expand its toolkit for launching apps, and maintain price stability through regular supply control. The easier it becomes to build and scale on BNB Chain, the greater the volume — and the stronger the token demand. With security and performance updates expected on schedule, BNB remains a top-tier infrastructure asset.
FreshForex analysts believe Bitcoin’s record high reaffirms the global appetite for digital assets, while strong developments across major altcoins add depth and resilience to the market. Q4 2025 could deliver solid returns for active buyers — with the most powerful surge expected in Q1 2026.

Continuation of the previous idea based on the Harmonious EnergyThe consolidation phase is coming to an end. The market structure is gradually moving into the next stage of the energy cycle, where a new flow direction is forming.
At the moment, I am observing a continuation of the energy movement with a noticeable manifestation of buyer strength. The key focus is on price behaviour near the resistance level — this is where it will become clear whether buyers will be able to maintain control and continue the upward momentum, or whether the market will enter a redistribution phase.
According to the GPE concept, this moment reflects the transition from balance to energy release — when the accumulated potential turns into real movement.
📌 Observation: price reaction to resistance and confirmation of the flow's strength.
💬 If you have any questions or would like to discuss the idea in more detail, I am always open to dialogue.

Trading idea based on the Harmonious Energy Flow (HEF) conceptAt the current stage, there is a clear manifestation of buyers’ strength, even though the market environment is changing rapidly without any significant price movement. This forms a state of consolidation, where energy is being accumulated for the next impulse.
According to the HEF concept, consolidation represents a transitional phase — the market is searching for balance before initiating a new wave of directional movement. My current expectation is focused on the moment of breakout from consolidation, when the market will reveal the true side of strength.
📌 Main focus: observing how buyers maintain their advantage within this narrow structure and waiting for a signal confirming the exit from balance.
If you find my charting approach interesting, you are welcome to connect and discuss further. I’m open to communication and collaboration.
Would you like me to refine this version for maximum stylistic alignment with TradingView’s publication tone (slightly shorter, more analytical, and visually structured)?
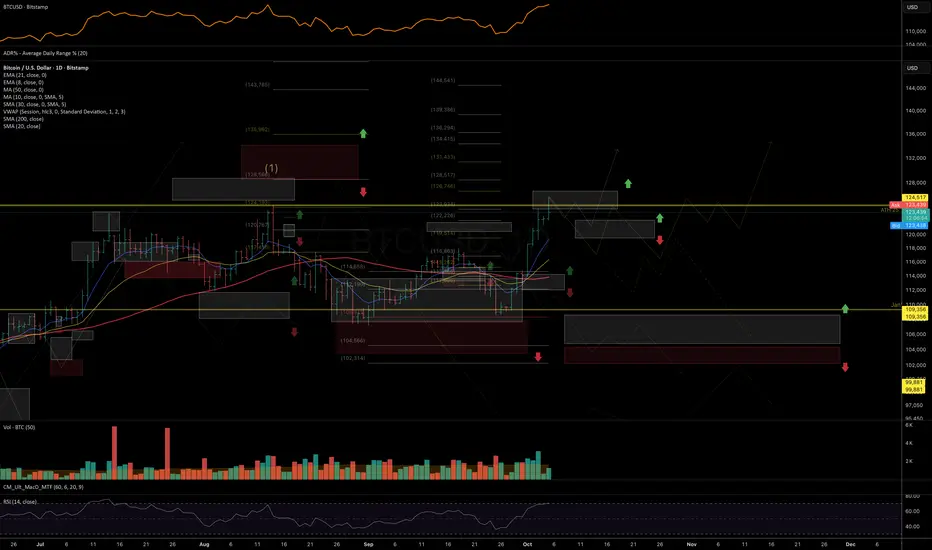
Weekly Crypto Market Outlook: Trend Structures and Expectations The market continues to follow a macro-pattern similar to the previous bull cycles that unfolded in Q4 of 2013, 2017, 2020, and 2021. I discussed this structure in detail in my August 18 update:
Specifically: a summer rally, several weeks of September correction and consolidation, followed by the beginning of a new upside leg in early October.
Updated BTC chart:
Another key development is the stablecoin market capitalization approaching a major technical zone. A confirmed breakout above it could signal a strong liquidity rotation into crypto assets — potentially marking the start of a new wave of growth across the crypto space, similar to the dynamics seen in 2023 and 2024.
Inverse correlation of BTC and stablecoin market cap:
Perhaps the most compelling factor is Bitcoin’s relationship with gold. Despite massive institutional adoption through ETFs, the BTC/GOLD ratio has remained stagnant since early 2021. This suggests that Bitcoin remains significantly undervalued relative to gold, leaving substantial room for appreciation as the digital asset continues its mainstream integration.
BTC/GOLD chart:
These factors — combined with the fact that most altcoins have already broken above their local resistance zones mentioned in the previous review — point to a potential recovery of upside momentum across the crypto market and higher targets into Q4.
As long as prices hold above their local and mid-term support zones, I expect continuation of the rally toward the next resistance levels. Breaking these support zones, will push odds in favor of more prolonged consolidation. But as long as BTC is not closing bellow its 50DMA for more than two weeks, macro bull cycles remains intact.
Below are the key technical levels for the main assets this week:
BITSTAMP:BTCUSD
Chart:
Short-term support: 122–119.5K
Mid-term support: 117–115K
Resistance: 131–135K
BITSTAMP:ETHUSD
Chart:
Support: 4400–4375
Resistance: 4870–5070
BINANCE:BNBUSD
Chart:
Support: 1142–1089
Resistance: 1225–1275
BINANCE:XRPUSDT
Chart:
Support: 2.92–2.88
Resistance: 3.20–3.35
CRYPTO:HYPEHUSD
Chart:
Support: 48.5–47.35–46
Resistance: 55.5–60
BINANCE:SOLUSDT
Chart:
Short-term support: 223–219
Mid-term support: 212–207
Resistance: 247–260
Thank you for reading - wishing you a great Sunday and a strong start to the new trading week.
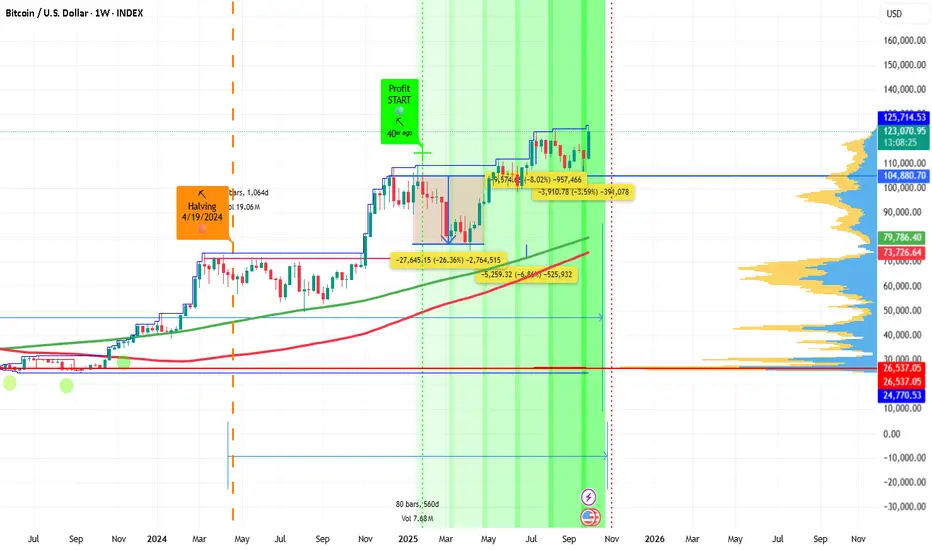
15-30 days to go and we start taking profits As you can see I expect a push to 150K and then btc.d goes down and we see alts pump but this is the time to lower the risk appetite and make sure to lock your profits. I will try to be out 65-70% in alts positions and convert some to bitcoin.
I wish you, all the best.