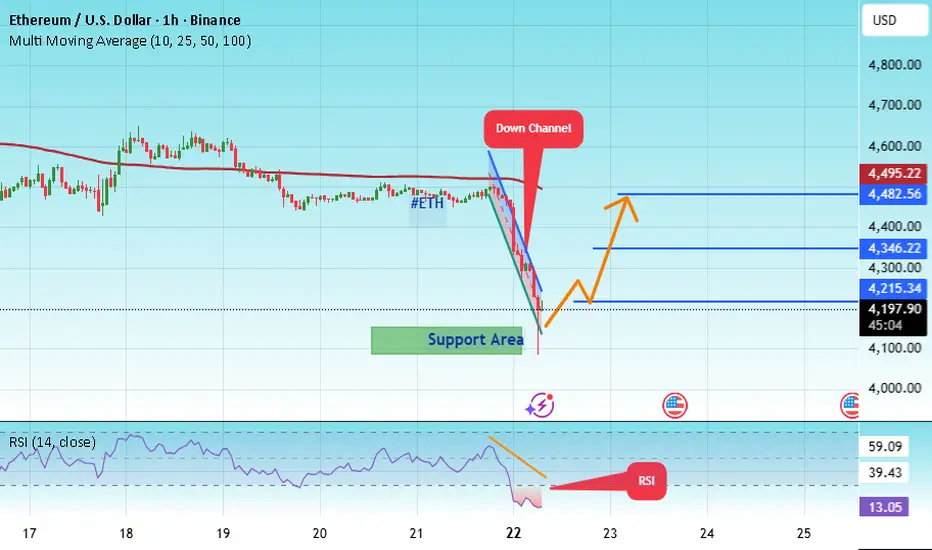
#ETH/USD - Roll back - Its coming baack to 4500#ETH
The price is moving within a descending channel on the 1-hour frame, adhering well to it, and is heading for a strong breakout and retest.
We have a bearish trend on the RSI indicator that is about to be broken and retested, which supports the upward move.
There is a major support area in green at 4111, which represents a strong support point.
We are heading for consolidation above the 100 moving average.
Entry price: 4136.
First target: 4215.
Second target: 4346.
Third target: 4482.
Don't forget a simple matter: capital management.
When you reach the first target, save some money and then change your stop-loss order to an entry order.
For inquiries, please leave a comment.
Thank you.
Ethreum
ETH 03.10#ETH
Ether reacted in no-man's lands. Apart from the ndPOC at 4536, I had no zones there, and there are also no specific signs of weakness to reverse from the current ones. There's nothing to short from yet; I'll wait for the 4700 zone, and I'll only go long from the nearest S-zones if I have confirmation.
Support zones:
4391-4403
4272-4300
4196-4230
Resistance zones:
4660-4724
4768-4780

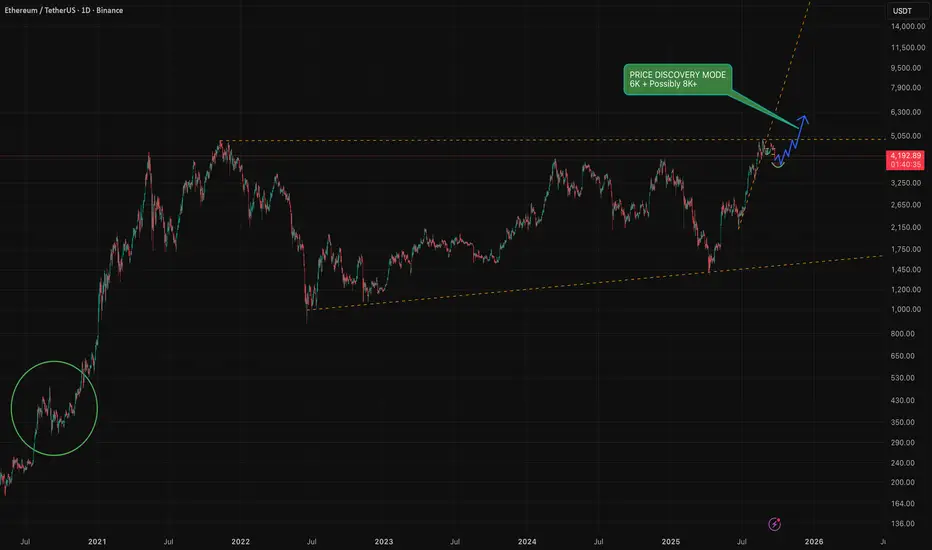
History doesn't repeat but RHYMES ! I highly recommend everyone to have look at September 2020
I personally think that this will be the same scenario where we will have some fake-outs to drive the retails out / liquidate then the price will carry on upwards and go into price discovery mode where we are more likely to see 6K and hopefully more, if the volume and kicks in the ETF's and more retail pump we can see somewhere between 8K to 12K ( Optimistically )
I personally will be taking profits along the way tho and not going to wait for the top as we all know no one can predict the top nor the bottom !
Thank you all for reading my idea and feel free to share yours here in the comments.
To get access to my indicators please join the FREE tg channel, link in my BIO !
ETH 02.10#ETH
Ether doesn't care about any resistance right now, and there's nothing holding it back until it reaches the liquidity zone and the upper limit of the range around 4700. The HTF can't afford to lose 4200. There's plenty of local liquidity at 4280, and 4300 is the fair value (POC) zone in the range since August. We might struggle here for a while if they don't allow a direct expansion to 4700 without any pauses.
Support zones:
4268-4280
4200-4230
Resistance zones:
4456-4480
4660-4724
4768-4780

ETH Macro analysis and current cycle targets of $16k-20KI’ve been invested in Ethereum since 2020. Along the way, I took some profits above $4,000 and later rebuilt my position around $1,650. My conviction is rooted in direct experience—after 23 years working in IT, I clearly see both the strengths and limitations of the technology.
What I recognized back in 2020—its dominance, brand recognition, the credibility of its founder, and the trust it commands—is only now becoming clear to the broader market. This is reflected in the growing wave of ETH-based treasury products and institutional adoption.
For me, DeFi was never the main driver. While it has been an important use case, I believe Ethereum’s long-term value will come from its network dominance and trust, which will inevitably extend across multiple industries and verticals.
The logarithmic price chart of ETH since its inception illustrates this well. Historically, each cycle has peaked at roughly 3.4x the previous cycle’s high. If that pattern continues, it aligns with the upper band of the long-term log channel—suggesting potential in the $16K–$20K range during the next cycle.
I don't overthink; I go with what I see and what I know to be the macro trend.
Market idea based on the Harmonious Energy Flow (HEF) conceptAt the current stage, we can observe a clear manifestation of buyers’ strength, even though the market conditions are shifting rapidly without any significant price expansion. This creates a state of consolidation, where energy is being accumulated for the next move.
According to the HEF concept, consolidation represents a transitional phase — the market is searching for balance before moving into a new wave of directional flow. My current expectation is the transition towards the breakout moment, when price finally exits this consolidation zone and reveals the true side of strength.
📌 Key focus: monitoring how buyers sustain their advantage within this tight structure, and waiting for the signal of release from balance.
If you find my charting approach interesting, you are very welcome to connect for further discussion. I am open to dialogue and exchange of views.

$BMNR - Cup & Handle Formation $215 Price TargetA major cup and handle pattern is forming. Watch for breakout level around the 64-ish level. Once breakout occur, use the Fib extension overlay for price objective that can range from $81 to $215. This is a very bullish setup happening.

ETHUSD ANALYLTICAL IDEA, FOR 30 SEP, 2025.After the quick fall below $4000, in value, the second in command on the coin market sharply went back to its original position and currently trades around $4100, but the overall direction is bullish as considered the altcoin season. But the question is, will it hold? Or continue pushing above or below well, for now, we can only sit tight on our hands, as my Bias remains bearish for the short term, and I look forward to taking sell trade positions as the price continues to push further in that direction.
As usual, my calls or analysis are based on what we see, the current Bias, and from a probability standpoint, meaning that this projection may be or may not be validated, so tread carefully, and as usual, this is not financial advice, trade responsibly.

#ETH/USDT : Bounce From Support, Eyes on $ 4128#ETH
The price is moving within a descending channel on the 1-hour frame, adhering well to it, and is heading for a strong breakout and retest.
We have a bearish trend on the RSI indicator that is about to be broken and retested, which supports the upward breakout.
There is a major support area in green at 3950, which represents a strong support point.
We are heading for consolidation above the 100 moving average.
Entry price: 4012.
First target: 4050.
Second target: 4084.
Third target: 4128.
Don't forget a simple matter: capital management.
When you reach the first target, save some money and then change your stop-loss order to an entry order.
For inquiries, please leave a comment.
Thank you.

Weekly Crypto Market Review: BTC, ETH, SOL, XRP, BNB, HYPEReview of trend structures and my expectations for the coming weeks on Bitcoin and key altcoins.
The key local support zones highlighted in the previous market outlook did not hold against selling pressure, increasing the likelihood of a more prolonged consolidation across the crypto space.
As long as prices continue to close below their local resistance areas, the base scenario remains in favor of further correction toward macro support levels.
Below is a brief summary of important resistance, support zones and potential trend structures I am following:
BITSTAMP:BTCUSD
Chart:
Resistance: 112–114.5k
Support: 103.5–101–98k
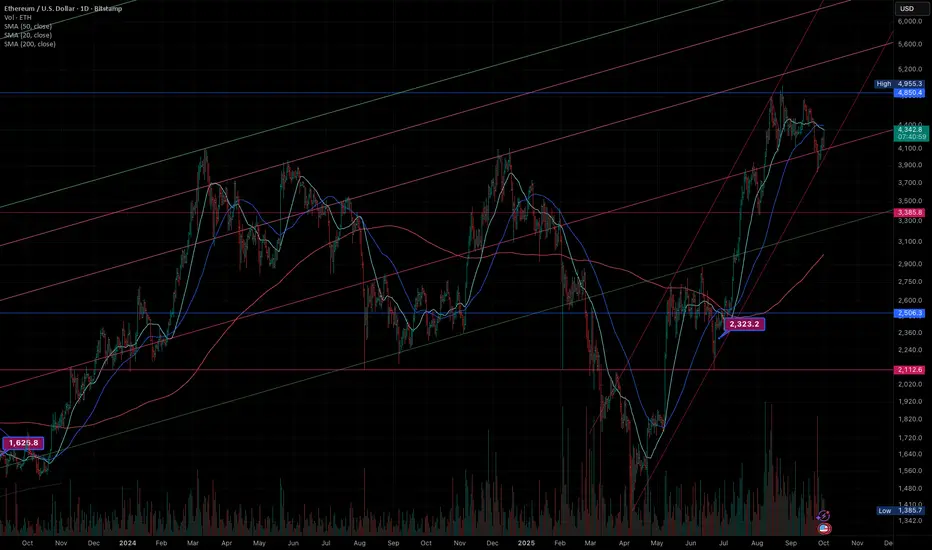
BITSTAMP:ETHUSD
Chart:
Resistance: 4115–4215
Support: 3700–3430
BINANCE:BNBUSD
Chart:
Resistance: 1020–1040
Support: 900–870–840
BITSTAMP:XRPUSD
Chart:
Resistance: 2.87–2.99 / 3.07
Support: 2.55–2.40–2.32
PYTH:HYPEUSD
Chart:
Resistance: 49–50–53
Support: 35.5–29–23
COINBASE:SOLUSD
Chart:
Resistance: 213–219
Support: 177–169
Thank you for your attention, and I wish you a successful week ahead.

Ethereum $ETH crypto trade idea using the weekly demand levelThere is an Ethereum CRYPTOCAP:ETH crypto trade idea using the weekly demand at $3,872. This is a very similar crypto swing trade idea I recently shared with BitCoin. Let's see if it wants to rally for a couple of weeks. You can use the smaller timeframes to trade crypto intraday strategies or scalping strategies.

BMNR HIGH PROBABILITY SETUP SOON!!!🚨 BMNR HIGH PROBABILITY BUY SETUP 🚨
* Here We Can See Clearly The Next Potential Move For BMNR Coming Hours/Days.
* Keep Your Eyes Close On Your Trading Positions.
* Happy PIP Hunting Traders.
FXKILLA.

ETH – Eyeing $3.3k Sweep Before Loading LongETH has broken down from its recent range, showing lower highs and consistent selling pressure. I’m watching for one more leg lower into the $3,300 area.
Why $3,300?
A clean sweep here would trap shorts and flush out late longs, setting the stage for a strong bounce.
Setup Plan:
Short-term bias: Bearish, expecting continuation lower into ~$3,300
Will not long until we get a reaction at that level
Long trigger: Strong bounce/reversal signals at $3,300 zone
Targets on the bounce: $3,500 → $3,650 → $3,800
Stop loss: Below $3,250
ETH likely has one more dip before setting up for a cleaner move higher. Patience pays here.
BMNR HIGH PROBABILITY SETUPS SOON!!!🚨 BMNR HIGH PROBABILITY SETUPS 🚨
* Here We Can See Clearly The Next Potential Moves For BMNR Coming Hours/Days.
* Keep Your Eyes Close On Your Trading Positions.
* Happy PIP Hunting Traders.
FXKILLA.

$ETH shows bullish hidden RSI divergence.A **bullish hidden RSI divergence** is a trading signal that suggests a continuation of an upward trend, often indicating that the price will keep rising. It occurs when the price action and the Relative Strength Index (RSI) show a specific pattern. Here's a simple explanation of how to identify and trade it:
### Step 1: Understand the Pattern
- **Price Action**: The price makes **higher lows** (each low point is higher than the previous one), indicating an uptrend.
- **RSI**: The RSI makes **lower lows** (the RSI is declining while the price is not), showing a divergence from the price trend.
- This mismatch suggests that the uptrend is still strong, and the dip in RSI is just a temporary slowdown in momentum, not a reversal.
### Step 2: Identify the Divergence
1. **Chart Setup**: Use a price chart (e.g., candlestick chart) with the RSI indicator (typically set to 14 periods) on a platform like TradingView .
2. **Spot Higher Lows in Price**: Look for a price chart where the recent low is higher than the previous low (e.g., $100 to $105).
3. **Check RSI for Lower Lows**: At the same time, check if the RSI is making a lower low (e.g., RSI drops from 50 to 45 while price makes a higher low).
4. **Confirm the Uptrend**: Ensure the overall trend is bullish (price is generally moving up with higher highs and higher lows).
### Step 3: Trading the Bullish Hidden RSI Divergence
1. **Entry Point**:
- Enter a **buy** trade when you confirm the divergence and see the price starting to rise again after the higher low.
- Look for additional confirmation, like a bullish candlestick pattern (e.g., a hammer or engulfing candle) or a break above a resistance level.
2. **Stop Loss**:
- Place a stop loss below the most recent higher low to protect against a potential trend reversal.
- For example, if the higher low is at $105, set the stop loss slightly below, like $103.
3. **Take Profit**:
- Target a take-profit level based on previous highs, support/resistance levels, or a risk-reward ratio (e.g., 1:2, meaning you aim for twice the profit compared to your risk).
- For instance, if your stop loss is $2 below entry, aim for a $4 profit target.
### Step 4: Manage the Trade
- **Monitor RSI**: Ensure RSI doesn’t drop into oversold territory (below 30) or show signs of a bearish reversal.
- **Adjust Stop Loss**: As the price moves up, consider trailing your stop loss to lock in profits.
- **Exit Strategy**: Exit the trade if the price hits your target, or if you see signs of a trend reversal (e.g., a bearish divergence or break of key support).
### Example
- **Price**: Stock XYZ makes a low at $100, then a higher low at $105.
- **RSI**: RSI drops from 50 to 45 during the same period.
- **Action**: You enter a buy trade at $106 after a bullish candle. Set a stop loss at $103 and aim for a take-profit at $110 (1:2 risk-reward).
- **Outcome**: If the price continues its uptrend to $110, you take profit. If it drops below $103, you exit with a small loss.
### Tips
- **Timeframes**: Use higher timeframes (e.g., 1-hour, 4-hour, or daily) for more reliable signals.
- **Confirmation Tools**: Combine with other indicators like moving averages or trendlines for stronger signals.
- **Practice**: Test this strategy on a demo account before using real money to understand how it works in different market conditions.
- **Risk Management**: Never risk more than 1-2% of your trading account on a single trade.
This strategy works best in trending markets, so always confirm the broader trend before trading.

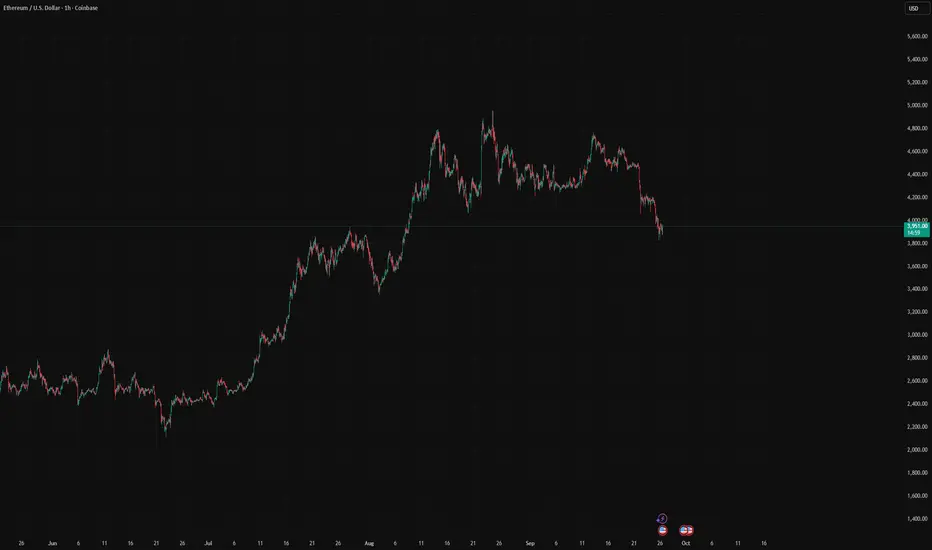
Ethereum $ETH similar price action to late JuneIt's not perfect look to see CRYPTOCAP:ETH losing the daily range
However, the current PA oddly reminds me of one from late June
RSI and AO are similar as well
The next few days will be interesting to see if they are trying to scare the paper hands before the generation run, or the generational run is getting postponed for now

$ETH trading near $4,180, sitting close to the $4,000 support CRYPTOCAP:ETH trading near $4,180, sitting close to the $4,000 support zone. A short-term bounce from here is possible, with pullback targets toward $4,500. However, I’m still holding my short position, watching for a clean break below $4,000 that could open the way toward $3,500 and lower levels.

The next Bitcoin Long to take In this video I cover the next best available levels of where we are very likely to get a strong reaction from after this correction .
I have taken a variety of Fib pulls to determine the next buy levels as well as covering a local short setup .
Appreciate your support Thank alot
Tools used Fibs, AVWAP , VP, and Tpoc chart + pivots

ETHUSDTHello Traders! 👋
What are your thoughts on Ethereum?
Ethereum has recently broken above the key resistance area near 4100, printing a new high slightly above the previous peak. After this breakout, price action has entered a corrective phase, suggesting a healthy pullback.
This correction is currently forming a bullish flag pattern, which may act as a continuation setup.
As long as ETH remains above the highlighted support zone, the bullish scenario remains valid. A confirmed breakout from the flag formation could trigger the next impulsive wave, potentially leading to fresh all-time highs.
Keep a close eye on the flag breakout and watch for bullish momentum to resume once the consolidation completes.
Don’t forget to like and share your thoughts in the comments! ❤️

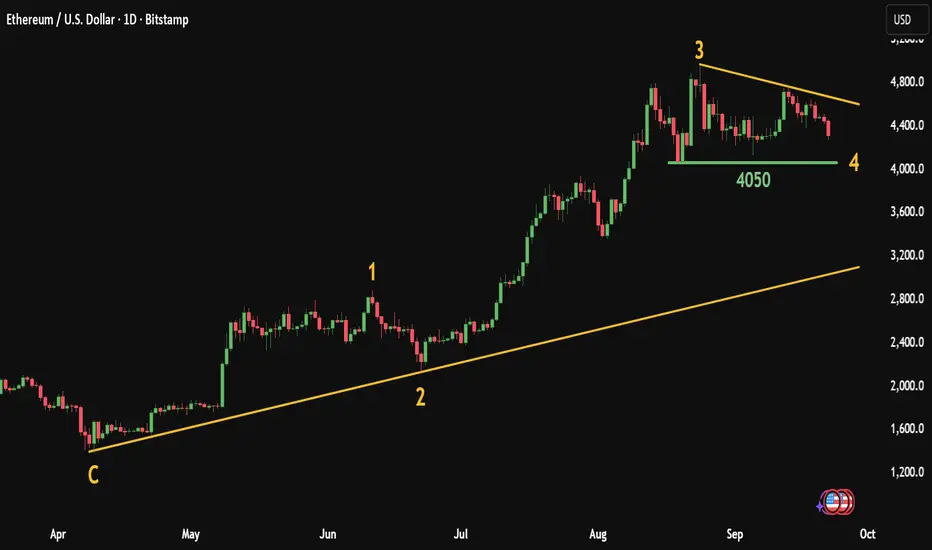
ETH Elliott Wave Analysis: Key Support at $4,050, Targets $5,200The attached chart clearly illustrates that Ethereum’s current price action is following a classic Elliott Wave structure, with three major impulsive waves completed and the market currently consolidating within the fourth corrective wave.
Ⅰ. Completed Waves
Wave C (the bottom): Marked the starting point of the new bullish cycle, around the $1,700 – $1,800 levels.
Wave 1: The initial impulsive rally, reaching $2,900 – $3,000.
Wave 2: A sideways/ corrective decline, which respected the previous bottom and maintained the overall bullish structure.
Wave 3: The strongest and most extended impulsive wave, pushing price aggressively to $4,800 – $4,900, showing the typical momentum associated with third waves.
Ⅱ. Current Phase – Wave 4
Price is consolidating within a descending contracting triangle, which is typical of a fourth-wave correction.
The key support lies at $4,050, acting as the main level to preserve the bullish Elliott structure.
Wave 4 is usually more complex and sideways than Wave 2, which fits well with the current market behavior.
Ⅲ. Outlook – Wave 5
As long as $4,050 holds without a daily close below it, the most likely scenario is the start of the fifth impulsive wave upward.
This wave is expected to break above the Wave 3 peak at $4,800 and extend into new highs.
Potential upside targets: $5,200 – $5,500, with room for higher levels if institutional momentum drives further expansion.
Conclusion:
Ethereum is unfolding within a clear Elliott Wave bullish cycle. The ongoing Wave 4 correction is consolidating around the $4,050 support level, which is the key pivot to watch. Holding this zone increases the probability of a Wave 5 rally, potentially driving ETH to fresh all-time highs in the coming weeks.
Crypto Market Weekly Review: Trend Structures and Key ExpectatioOverall trends continue to develop within the macro structures outlined in previous weekly reviews. Some assets (BNB, SOL, HYPE) are already in new uptrends, while others are only starting to form the first impulsive moves within broader bullish structures.
In the coming days, I expect local downside pressure to complete the ongoing September corrections, followed by a continuation of the uptrend toward target resistance zones. Another wave of Autumn consolidation is likely to follow afterward.
From a macro perspective, as long as prices hold above their key support zones, I continue to view the September lows as important macro higher-lows. Below these levels, most coins (possibly with the exception of ETH) are unlikely to fall and should instead continue forming higher lows ahead of a more sustainable rally into Q4.
⸻
BINANCE:BNBUSDT
Chart:
Support: 1000–930
Resistance: 1135–1150
⸻
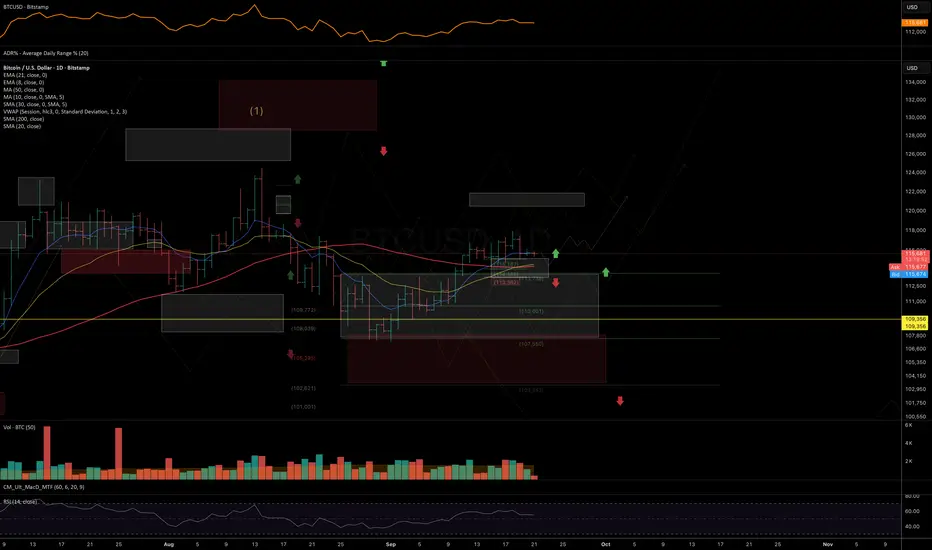
BINANCE:BTCUSDT
Chart:
Support: 115–113.3K
Resistance: 120–122K
⸻
BINANCE:XRPUSDT
Chart:
Support: 2.97–2.91 / 2.85
Resistance: 3.30–3.40
⸻
BINANCE:ETHUSDT
Chart:
Support: 3380
Resistance: 5060–5235
⸻
BINANCE:SOLUSDT
Chart:
Support: 230–223
Resistance: 285–310
⸻
$HYPEHUSDT
Chart:
Support: 52.5–51
Resistance: 67–73
Feel free to comment which coins and assets you’re most interested in, and I’ll prepare a separate review on them.
Thank you for your attention, and wishing you a successful week ahead!
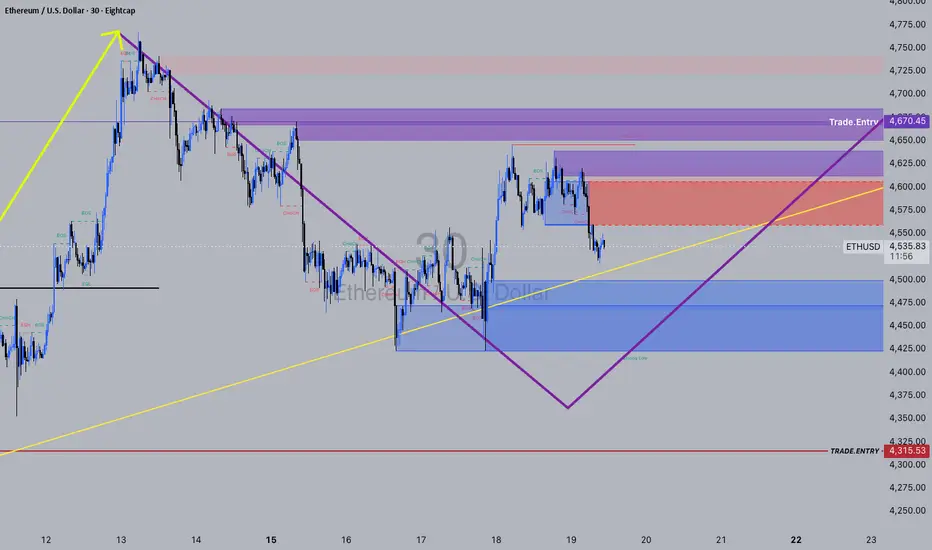
ETH_my_idea_until_Novemberso this is my view on ETH, yes its the m30, as the refined zone for the Daily and H4
from here i believe we can slowly build that long hold into November
we might get some fake outs and some liqi grabs, as this Daily zone is fairly big;
Lets see what big news and ETF's drives it
ETH UPDATEHello friends
Well, you can see that due to the bearish market cycle, the downward steps have gradually become smaller and we have hit a higher ceiling at the specified support, which is a sign of a weak trend or price flooring. If this specified price floor is maintained, the price can move to the specified targets.
*Trade safely with us*
