Altseason Checklist! To spot the beginning of an Altseason, there are several key charts you need to track on TradingView. These indicators show whether capital is really leaving Bitcoin and flowing into altcoins.
1. Altseason Starts with ETH
Almost every time, the first signs come from Ethereum (ETH). When ETH gains strength, the rest of the altcoins usually follow.
2. BTC Dominance (BTC.D) ⬇️
Condition: forming Lower Low / Lower High
Interpretation: money is rotating out of BTC and looking for better opportunities in altcoins.
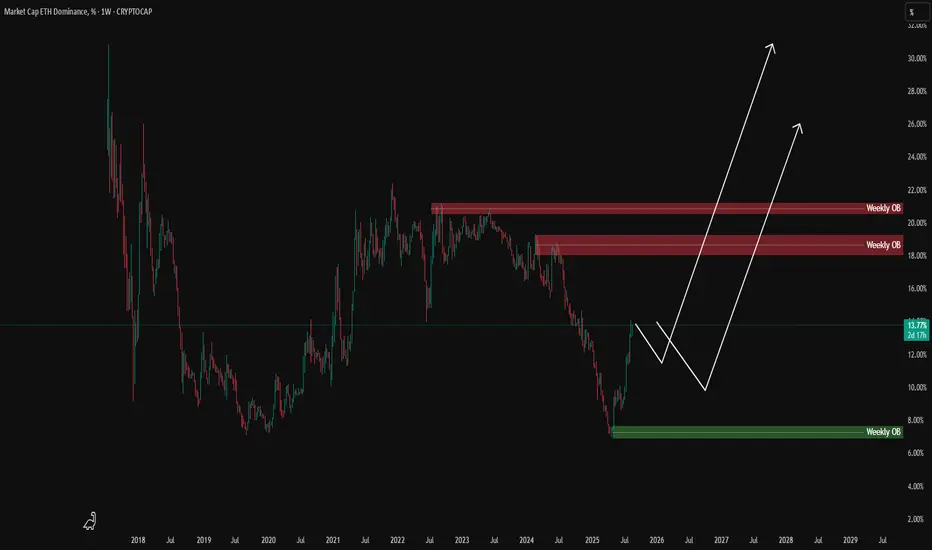
3. ETH Dominance (ETH.D) ⬆️
ETH’s share of the market is increasing.
This shows Ethereum is taking leadership over the flow of capital.
4. ETH/BTC Pair (ETHBTC) ⬆️
Key: breakout to the upside with weekly confirmation
This ratio reveals whether ETH is truly outperforming BTC.
When ETHBTC breaks up ⇒ strong trigger for ETH leadership.
5. TOTAL2ES ⬆️
Represents market cap of all altcoins excluding BTC.
Growth here means real money is flowing into alts, not just cycling into stables.
6. TOTAL3ES ⬆️ (with delay)
Represents market cap of all altcoins excluding BTC and ETH.
When this chart starts rising ⇒ after ETH, the rest of the alts join in.
This is usually the final confirmation of Altseason.
7. USDT Dominance (USDT.D) ⬇️ or ↔️
Should move down or at least stay flat.
If it rises too much ⇒ capital is not entering alts, it’s parking in stablecoins ⇒ Altseason trap.
⚠️ Key Note – Watch Out for the Trap
The biggest trap is when BTC.D is dropping and ETH.D is rising, but USDT.D is also climbing.
That doesn’t mean Altseason – it means money is leaving BTC but hiding in stablecoins instead of flowing into alts.
📌 Summary:
Starts with ETH
Confirm with BTC.D ⬇️, ETH.D ⬆️, ETHBTC ⬆️
Money entering alts ⇒ TOTAL2ES ⬆️
Expansion to full alt market ⇒ TOTAL3ES ⬆️
Watch USDT.D to avoid the trap.
Ethreum
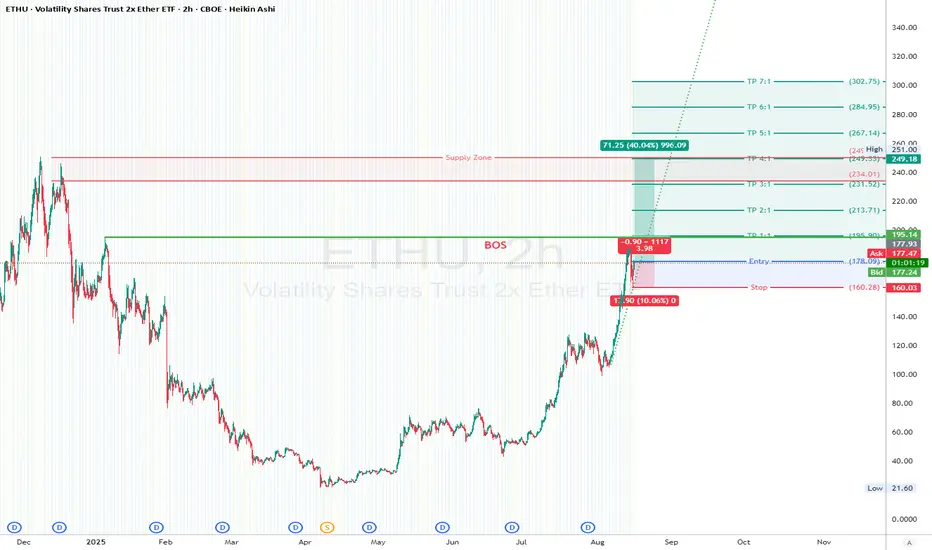
ETHU (2X Ethereum ETF)Targeting the end of the wave after a short correction.
Trade setup on the chart
Entry: 177.93
SL: 160.03
TP: 249.18 (4:1RR)
Trade safe!
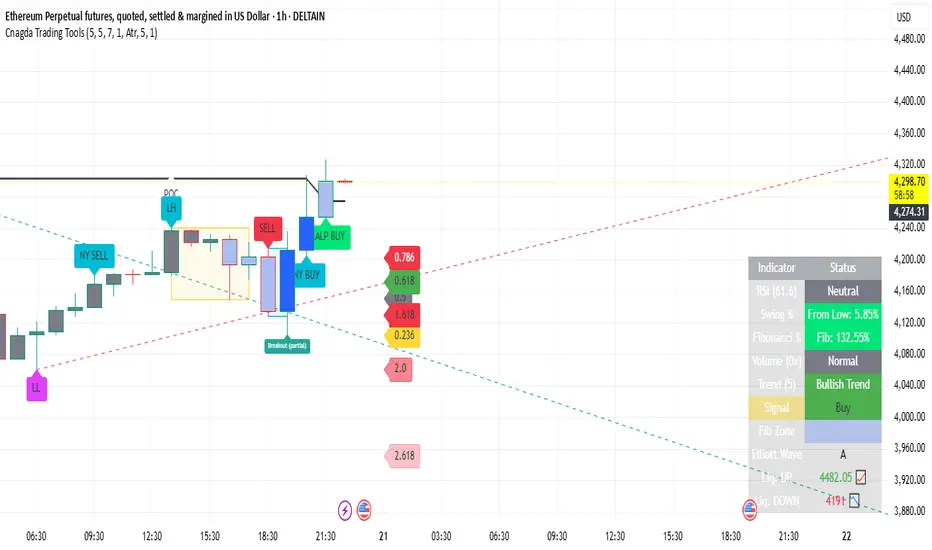
Where is ETH Headed Next? Clear Entry & Exit PlanCurrent Status (August 20, 2025, 1H Chart) Eth
Price: 4,310.40 USD (1-hour close)
Day High: 4,327.60 USD
Day Low: 4,253.65 USD
Change: +1.32% (large positive candle)
1. Trend and Momentum Indicator wise:
Almost all signals are bullish:
Mid-term moving averages (EMA/WMA) are pointing upwards.
Trend line breakouts and labels like “BUY”/“SCALP BUY” may appear.
Volume is also supporting – “High” or “Above Avg” on the dashboard.
RSI will also be above 50 – a sign of continued strength in the trend.
2. Next targets (Fibonacci Extensions)
Potential targets estimated from Fibonacci levels:
1.618 Extension: First resistance/target (approx. zone above current price)
2.0 Extension: Second target
2.618 Extension: Last/aggressive target
These levels are drawn automatically by Cnagda Indicator, and based on them price may pause, or reverse with weak volume.
3. Where can reversal happen?
Reversal Zone:
If RSI moves near or above 70 and price touches Fibonacci 1.618 or 2.0 extension – short term top or reversal is expected there.
If dynamic labels “SCALP SELL”, “SELL”, or “Breakout (red/orange)” are shown, it will be a reversal area.
If the "Signal" line in the dashboard becomes "Strong Sell" or "Sell" – the possibility of reversal increases a lot.
4. Entry-Exit Trading Plan
Entry (Long):
Entry Trigger:
When "BUY", "SCALP BUY" or "Breakout" (lime/green label) appears, and price volume and RSI give confirmation.
Stoploss:
Slightly below previous swing-low (dashboard or Fibonacci low zone)
Target (Long):
Primary target: 1.618 Fibonacci Extension (from Fib Levels line)
If strength continues: 2.0 or 2.618 Extension (hold position from trailing SL)
Partial Exit: "Liq. UP" from dashboard table
Reversal/Short Entry:
If “SELL” or “SCALP SELL”/Breakout is shown at the higher level and dashboard is "Sell/Strong Sell" – go short.
Plan short only if volume is falling, RSI is 70+ (overbought).
Target: Fibonacci 1.0, 0.618, or "Liq. DOWN".
Takeaway for Readers:
"Ethereum is currently bullish in trend and there is a high chance that it will touch the next Fibonacci extension levels (1.618/2.0/2.618) -
But as soon as the reversal label appears in the overbought zone or with strong volume, profit booking will be justified.
The perfect trading plan is:
Take trades according to the trend and the direction of the Cnagda Indicator.
Entry only on your signal, and target on the Fib level.
Take reversals only on clear confirmation of the table and signal."
Author Note:
This article is completely based on the Pine Script indicator which is as advanced as "Cnagda Trading Tools" - do not rely on anything other than real-time algorithmic signals...
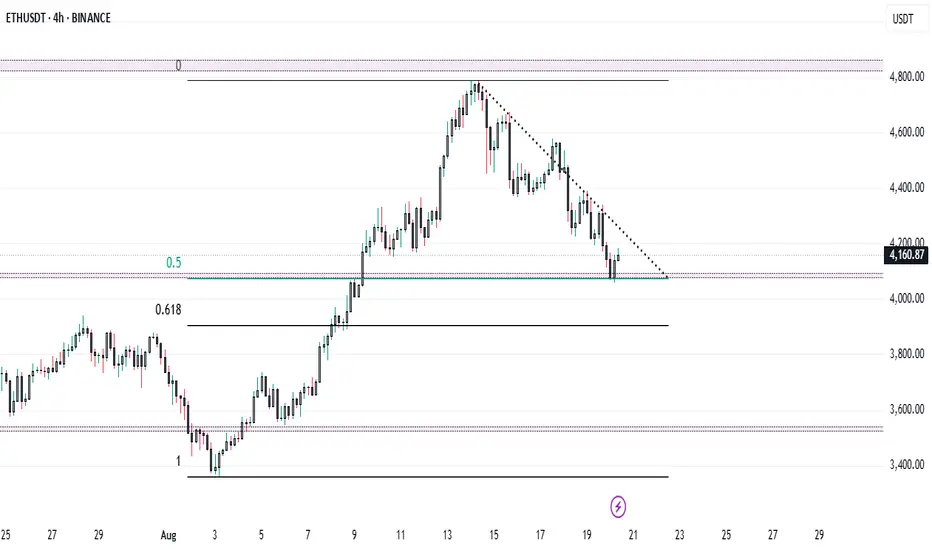
ETH at $4,100 – Can Bulls Defend Key Support Before FOMC..?ETH + FOMC = Volatility Ahead ? 🔥
Ethereum at Make-or-Break Zone: $4,100 Support in Focus!
Ethereum (ETH/USDT) on the 4H timeframe is showing a decisive battle between bulls and bears. After topping near $4,700, ETH has been in a steady downtrend, respecting the descending trendline.
🔑 Key Levels to Watch
* Immediate Support: $4,100 – $4,150 (0.5 Fib retracement)
* Major Support: $3,950 – $4,000 (0.618 Fib retracement)
* Resistance Zone: $4,300 – $4,350 (descending trendline)
* Major Resistance: $4,600 – $4,700 (recent swing high)
📈 Bullish Scenario
✅ A breakout above $4,300 trendline resistance could trigger strong momentum toward $4,500 - $4,600.
✅ Holding $4,100 support will keep buyers in control.
📉 Bearish Scenario
❌ If ETH fails to hold $4,100, expect a deeper retracement toward $4,000 (0.618 Fib).
❌ A break below $3,950 may extend the fall to $3,700 – $3,600.
⚠️ Market Note
📌 Today’s FOMC meeting could heavily impact the crypto market trend.
Expect volatility as Fed commentary on interest rates may guide ETH’s next major move.
⚖️ Conclusion
ETH is at a critical support zone where the next move will define short-term direction.
* Above $4,300 → Bulls regain control.
* Below $4,100 → Bears target $4,000 and lower.
ETH/EUR AnalysisI’m waiting for a 15–20% pullback from the recent highs before entering, with the plan to accumulate and hold long term.
On the 4H chart, ETH is currently trading below the Ichimoku cloud, showing short-term weakness and leaving room for a deeper correction.
Strategy: Patience for a better entry, then position for the long-term upside.

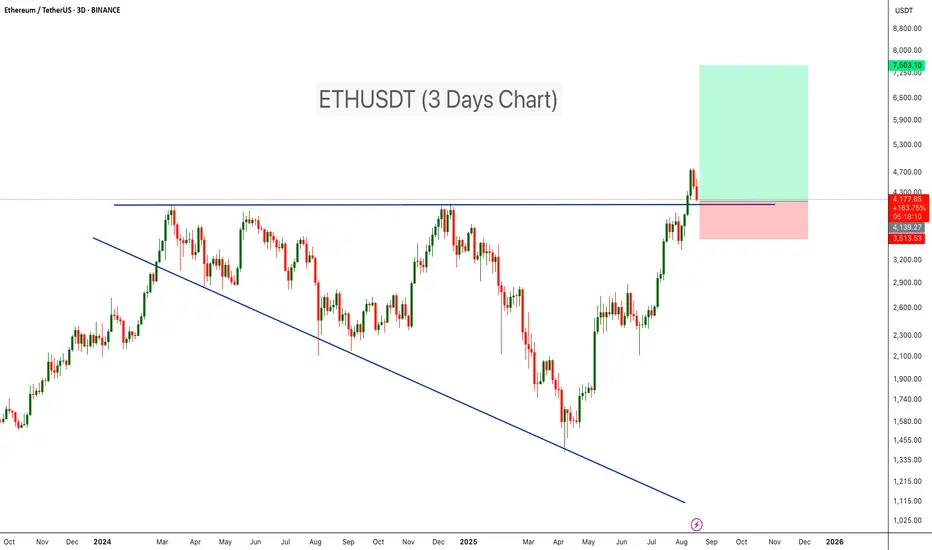
Ethereum Retesting Major Breakout ZoneBINANCE:ETHUSDT has completed a major breakout from a Broadening Wedge Pattern and is now retesting the wedge’s resistance line as support — a bullish continuation signal on the higher timeframe.
- Broadening Wedge Formation: ETH traded within a large broadening wedge throughout 2024 into early 2025, forming expanding highs and lows.
- Breakout Confirmation: The breakout above wedge resistance ($4,10) confirms bullish momentum and shifts market structure in favor of buyers.
-Retest in Progress: Price is currently pulling back, testing the former wedge resistance as fresh support — a textbook technical setup.
-Volume Validation: The breakout was accompanied by a surge in volume, strengthening the case for continuation.
🔷Entry Zone: $4,100 – $4,300
🔷Stop Loss: Below $3,500 to protect against a failed retest.
🔷Targets: $6,500 – $7,500
Cheers
Hexa
ETHUSD formed a bullish wedge, ready to reverseETHUSD formed a bullish wedge, ready to reverse
ETHUSD has been declining since August 14. During the last 2 days the asset started to trade within a narrow declining range, eventually forming a bullish wedge. Price came to an intermediate support level of 4,200.00, showing bullish divergence on the RSI on 30-m chart. Price is expected to rise towards local resistance of 4,400.00 and the upper border of the descending channel (highlighted with red).

Close view of ETH Short Description : the possible next Move of ETH Shown in graph. ETH can drop to 4100 as 5th wave of correction pattern
ETHUSDTBINANCE:ETHUSDT is overall trend in the 4-hour timeframe is bullish, with strong buying momentum. The price is currently at the 4200 USD resistance, and if this level breaks, the next target will be around 4500 USD.
Supports:3950 USD, 3730 USD, 3350 USD
Resistances: 4200 USD, 4500 USD
⚠️Always apply proper risk management.

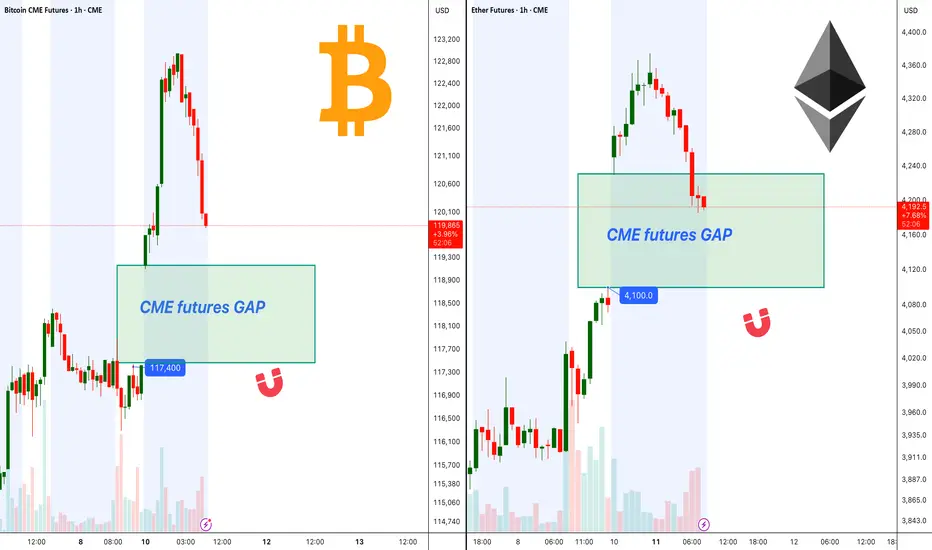
BTC, ETH CME Gaps Could Fill Before Bullish Continuation!Ethereum CME futures currently show a visible gap around $4,100 . Price is approaching this level, and based on historical behavior, CME gaps often act as magnets, drawing price in to fill them before a continuation in trend.
Bitcoin CME futures also have a gap sitting near $117,400. The recent rally has brought BTC close to this zone, increasing the probability of a short-term retracement to fill the gap before any significant breakout attempts.
Both gaps are key areas to watch, as a clean fill followed by strong buying pressure could set the stage for the next bullish wave in BTC and ETH.
Cheers
Hexa
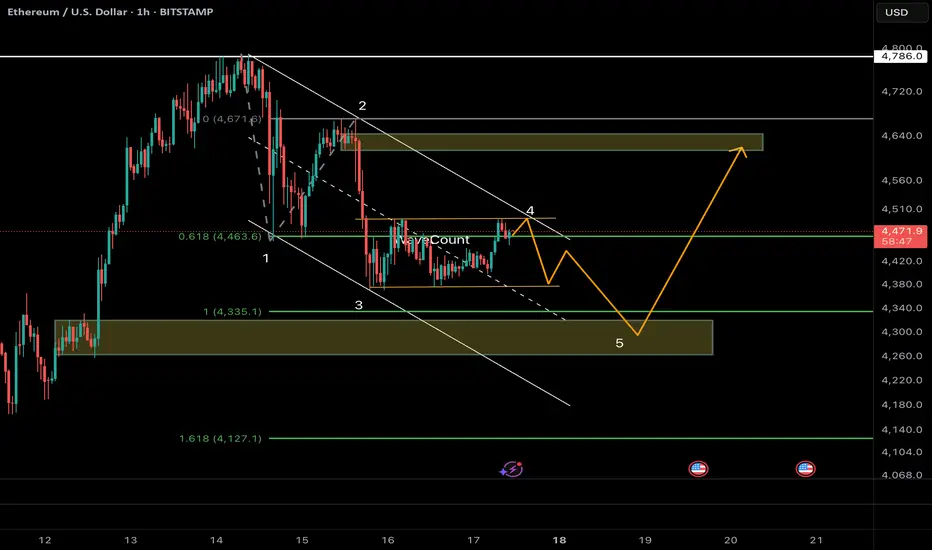
ETH/USDT :Wave 5 Drop to 4300–Rebound Rally to 4600 Before Crashthereum has likely completed a 5-wave impulsive rally from 1380 → 4780, with the channel break confirming a larger correction in progress.
Currently, price is unfolding Wave A of an ABC NeoWave structure, subdividing into 5 smaller waves.
⸻
🔹 Wave Count Breakdown
• Wave 1: Sharp drop to ~4335
• Wave 2: 61.8% rebound to 4463
• Wave 3: Extended selloff (161.8% of W1) → 4335
• Wave 4: Shallow retrace (~38.2% W3) → 4463
• Wave 5 (in progress): Targeting 4300–4270 (1.618 Fib + channel floor)
👉 Monowave count (~45–55) sits perfectly inside NeoWave’s 34–89 range → confirming impulsive character of this Wave A.
⸻
🔹 Next Path Scenarios
1. Wave A completion → Short-term bottom around 4300 (confluence of Fib + channel).
2. Wave B rebound → Relief rally toward 4460–4600 (38.2–50% retrace of A). Likely a sharp ABC bounce that traps late shorts.
3. Wave C decline → Resumption of downtrend toward 3800–4000, with risk of an extended drop to 3500 if momentum accelerates.
⸻
🔹 Technical Clues
• Fib structure: Textbook alternation (W2 deep / W4 shallow).
• RSI divergence at lows → exhaustion signals.
• Dominance context: USDT.D rebounding + BTC.D >60% → capital rotation suggests ETH downside risk remains elevated.
⸻
🔹 Trade Setup (Bias: Short with rebound play)
• Entry (short): Below 4400 on BOS confirmation (break of 4335).
• Targets: TP1 = 4300 (end of A), TP2 = 3800 (post-B wave).
• Rebound long: Consider 4300 → 4600 scalp if Wave A completes.
• Stops: Above 4463 (W4 high) for shorts / below 4300 for longs.
• Risk mgmt: 1–2% position size; trail stops along channel midline.
⸻
⚠️ Volatility remains extreme. Manage risk strictly—crypto psychology flips fast.
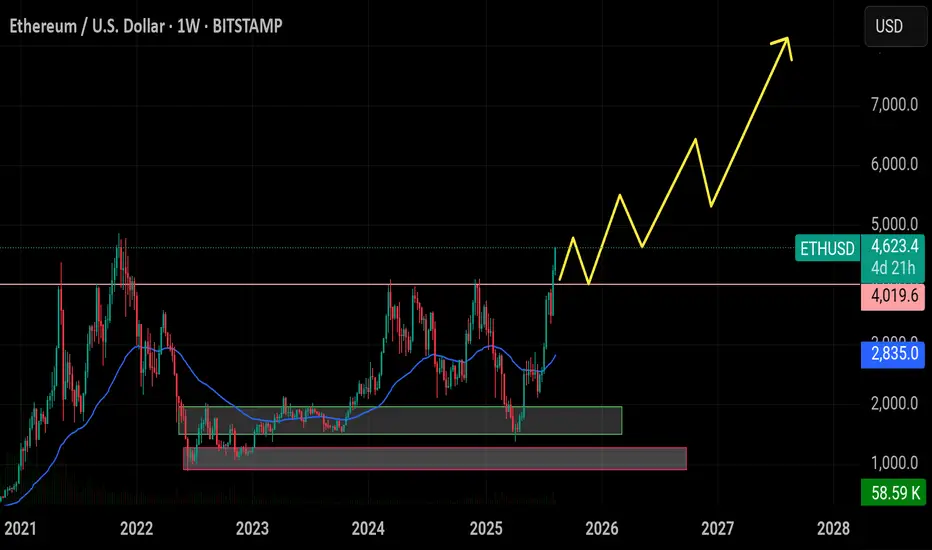
ETH on track for new All-Time Highcurrently, Ethereum is moving within a channel on the daily timeframe and the midline of the channel has temporarily limited further price growth. this price correction could present an entry opportunity for those who missed the 2000$, or a chance for re-accumulation. however the overall trend remains bullish. the support lines are clearly marked on the chart and it is expected that ETH will reach a new all-time high in the future, with the potential to grow up to $8000
ichimoku analysis was also used, but it has been removed for chart clarity.

ETH: LIVE TRADEHello friends🙌
✅Given the good rise we had, we had a small correction that was a buying opportunity and there is another support area where we can buy the second step in case of further correction.
We have also specified targets for you, be careful and do not act emotionally and observe capital and risk management.
🔥Follow us for more signals🔥
*Trade safely with us*

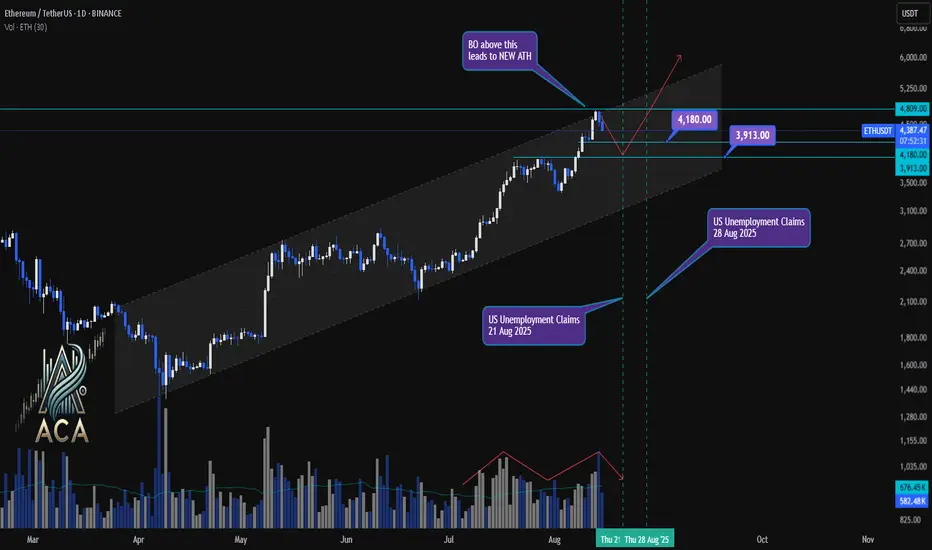
ETHUSDT 1D Chart Update | Channel Structure, Economic EventsETHUSDT 1D Chart Update | Channel Structure, Economic Events & ATH in Focus
🔍 Here’s the latest breakdown of ETH/USDT price action on the daily chart—channel dynamics, correction levels, and upcoming catalysts.
⏳ Daily Overview
Ethereum is trending strongly within an ascending channel, respecting both mid-level and upper resistance. After a local correction, price is rebounding with sturdy volume participation—signaling renewed interest from buyers.
📉 Correction Levels & Volume
- Recent correction found support at the $3,913 zone, with the $4,180 mark now acting as next key level.
- Volume has picked up on bullish candles, confirming the strength of this bounce.
- Correction appears healthy: price stayed within the channel, higher lows maintained.
📊 Channel, Economic Events & Breakout Setup
- ETH continues trading inside the established channel, posting higher highs and higher lows.
- Two major US economic events ahead—Unemployment Claims releases on Aug 21 and Aug 28, 2025—that could trigger volatility.
- Watch for a breakout (BO) above $4,809: crossing this sets the stage for a new all-time high (ATH).
🎯 Key Levels & Scenario
- $3,913: Correction support zone; ideal spot for high RR (risk/reward) long entries if retested.
- $4,180: Immediate resistance; flipping this could attract trend-following bulls.
- $4,809: Channel top and major breakout threshold. If price closes above, expect acceleration toward new ATH territory.
🚨 Conclusion:
ETH is pushing firmly inside its channel, with correction and volume patterns favoring bullish continuation. Key economic events may provide the volatility needed for a breakout move. Above $4,809, watch for new ATHs; dips to $3,913–$4,180 offer attractive re-entry zones for aggressive traders. Stay adaptive as August catalysts unfold.
#ETH/USDT Long after pull-back #ETH
The price is moving within a descending channel on the 1-hour frame and is expected to break and continue upward.
We have a trend to stabilize above the 100 moving average once again.
We have a downtrend on the RSI indicator that supports the upward move with a breakout.
We have a support area at the lower limit of the channel at 4465, acting as strong support from which the price can rebound.
We have a major support area in green that pushed the price upward at 4400.
Entry price: 4530.
First target: 4666.
Second target: 4797.
Third target: 4992.
To manage risk, don't forget stop loss and capital management.
When you reach the first target, save some profits and then change your stop order to an entry order.
For inquiries, please comment.
Thank you.

The season of Ethereum has arrived!
Do you know that Ethereum is currently the strongest coin in the market?
Even its targets and chart look stronger than Bitcoin’s.
Exactly 4 months ago, I posted an Ethereum analysis saying it had reached its lowest bottom, and at that time its price was exactly $2,180.
Take a look at the chart below.
Now my view is playing out, and Ethereum is only a few steps away from a new all-time high.
But did you know it’s still early, and you haven’t missed the opportunity yet?
Ethereum just broke a megaphone pattern on the weekly timeframe with a massive candle.
Even with all this upward movement, it only started breaking the pattern in the last couple of days, and it still has around 5% left to climb before hitting a new peak and entering price discovery mode.
And even with the crash that happened yesterday, it didn’t drop much and bounced back very quickly, as if it were just a normal day.
Overall, Ethereum will be in the 5-digit range—just like I told you exactly 4 months ago, when many didn’t believe it—and it will reach that by the end of the year. Remember my words, just like every time I’ve told you before.
Best Regards:
Ceciliones🎯

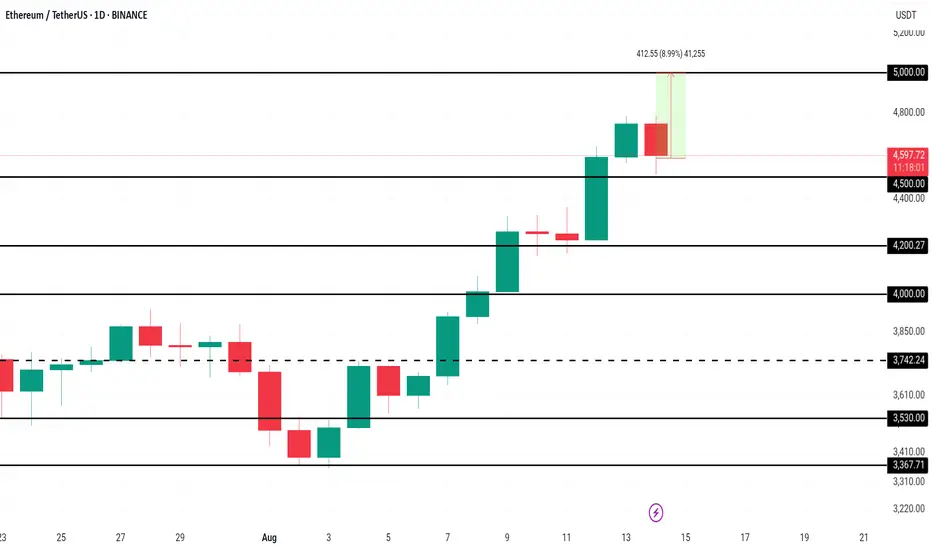
Ethereum Price Nears $5,000 After 3.5 Years; Will It Succeed?Ethereum is currently trading at $4,723, just 5.8% away from the $5,000 milestone. The asset has secured $4,500 as a solid support level, further strengthening its bullish outlook. This three-and-a-half-year high is energizing buyers, who see $5,000 as the next key target.
With robust whale accumulation, record futures interest, and positive funding rates, Ethereum’s path toward $5,000 appears intact. Once this level is breached, momentum could carry the price even higher, potentially targeting $5,500 in the following weeks.
However, the bullish scenario hinges on investor sentiment holding firm. If traders pivot to profit-taking, ETH could drop below the $4,500 support. A sustained move under this level might push prices toward $4,200, undermining the current uptrend and delaying further gains.
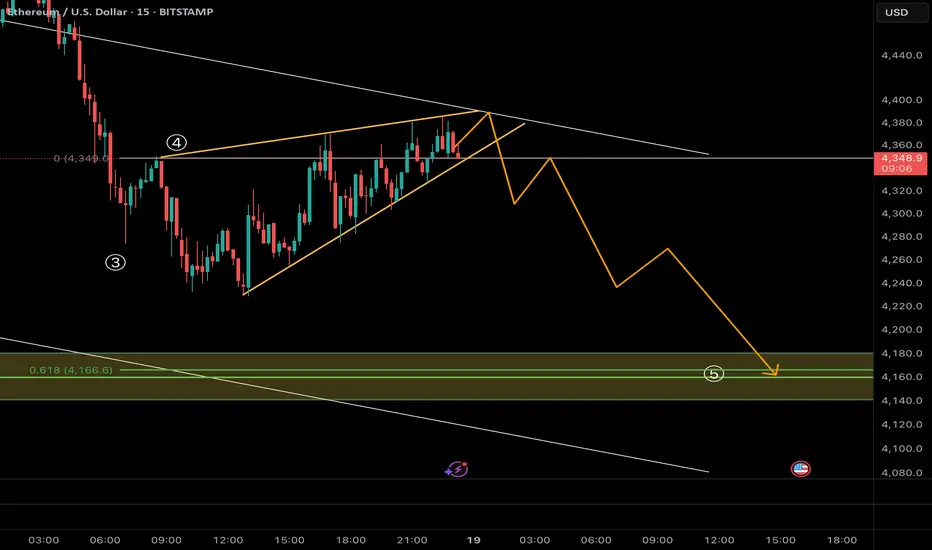
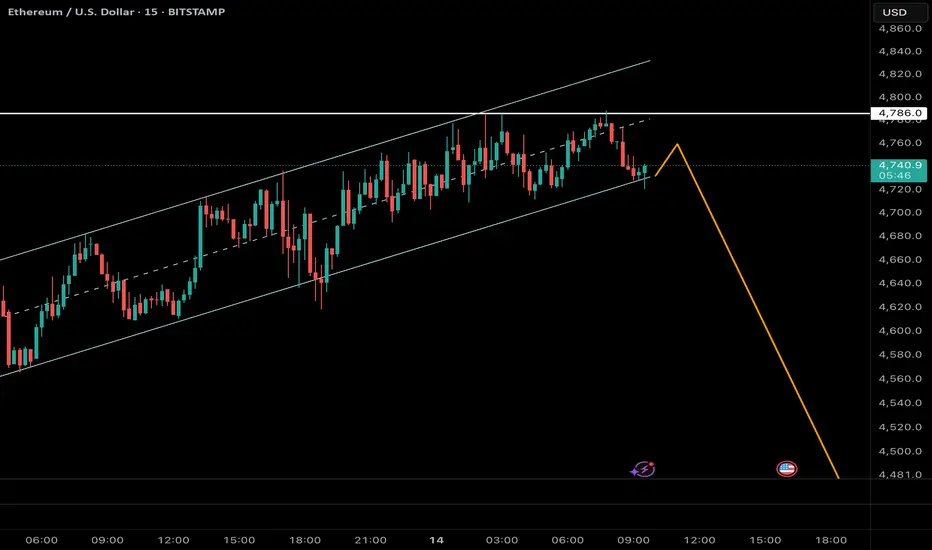
Ethereum on the Edge – The Breakdown Could Start Any Moment!Following yesterday’s analysis, where we identified Ethereum in the final stages of wave 5 of 5 at the upper boundary of its ascending channel, the 15-minute chart now reveals a contracting Neutral Triangle structure. This pattern typically forms as the final subdivision of wave 5, often preceding a sharp and decisive reversal.
Currently, price is testing the upper boundary of the B–D trendline. A confirmed breakdown from the E-wave low (≈ $4,590) would mark the completion of the triangle and signal the start of the anticipated decline.
Key Observations:
• Pattern: Neutral Triangle inside wave 5 of 5 (final stage of advance)
• Reversal Trigger: Break below E-wave low (~$4,590) on strong volume
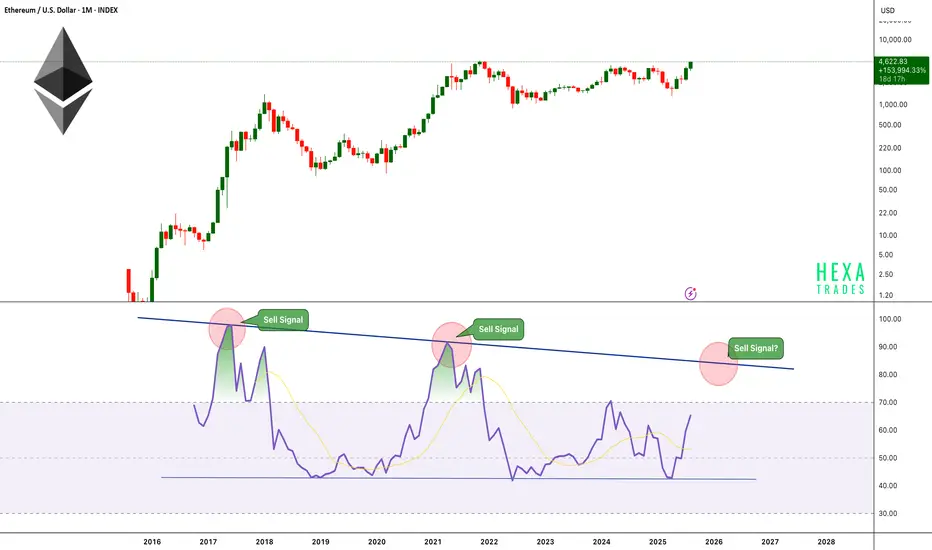
ETH Monthly RSI Approaches Cycle Top? Ethereum is showing strong momentum on the monthly timeframe, pushing toward levels not seen since its previous all-time highs. However, a critical technical indicator, the Monthly RSI is currently at 65 and steadily approaching its historically reliable sell zone between 83–85.
Key Observations:
-The monthly RSI has been capped by a descending trendline resistance since 2017.
-Each time RSI touched this resistance — in 2017 and 2021 — ETH reached a cycle peak, followed by a significant multi-month correction.
-Price is rallying strongly, but RSI still has room to rise before hitting the critical 83–85 zone.
Historical Pattern:
-2017: RSI rejection led to a ~90% decline.
-2021: RSI rejection triggered a ~75% drawdown.
-Now (2025): RSI is climbing toward this zone for the third time, potentially signaling a major profit-taking window once reached.
When the RSI reaches the trend resistance level of 83–85, the price could potentially touch the $7,500–$9,000 range.
Cheers
Hexa
$ETH has broken above the $4,000 resistance, CRYPTOCAP:ETH has broken above the $4,000 resistance, with short-term targets at $4,800–$5,000, and a potential retest zone around $4,050 for continuation.
Can ETH Reach $8,500 Amidst Bullish Catalysts and Threats?A confluence of unprecedented institutional buying, feverish derivatives activity, and bullish technical patterns has ignited the Ethereum market, propelling its price to multi-year highs and sparking bold predictions of a surge to $8,500 and beyond. This rally, however, is not without its skeptics, who point to signs of overheating, increasing profit-taking, and the ever-present shadow of a market cycle peak.
The world's second-largest cryptocurrency has been on a tear, with its price climbing significantly in a single month and nearing its all-time high. This powerful upswing has shifted the crypto world's focus away from a rangebound Bitcoin, raising questions about the mechanics of this bull run, its sustainability, and the myriad of forces pulling the price in opposite directions.
The Bull Case: A Perfect Storm of Institutional FOMO and Technical Breakouts
At the heart of the current rally is a tidal wave of institutional capital, a force that has fundamentally reshaped the market landscape. The recent launch of spot Ethereum Exchange-Traded Funds (ETFs) has been a resounding success, with reports indicating substantial net inflows on single trading days. This influx of "big money" provides a stark contrast to previous retail-driven rallies, suggesting a more stable, long-term buying pressure.
Leading this charge is one major institutional player, a technology firm chaired by a prominent Wall Street strategist. In a move that has drawn comparisons to aggressive corporate Bitcoin accumulation strategies, the firm has announced plans to expand its equity offering to a colossal sum, with the proceeds earmarked for further Ethereum purchases. The firm, already one of the largest corporate holders of Ethereum, is aiming to control a remarkable percentage of the total ETH supply. This monumental buying pressure from a single entity is a powerful bullish signal, fueling what some analysts have described as a price action that is "defying gravity."
The institutional appetite extends beyond this single entity. The total amount of Ether held by companies with crypto treasuries has surged. Simultaneously, Ethereum held on exchanges has dropped to a multi-year low, a bullish indicator that suggests investors are moving their assets into long-term storage with no immediate intention to sell.
This institutional fervor is underpinned by a compelling technical picture. Analysts have identified a rare but powerful chart pattern on Ethereum's daily chart that has been developing for months. This setup is characterized by a horizontal resistance level and a downward-sloping support line, indicating increasingly aggressive buying on each dip. A decisive breakout above this resistance, according to technical analysis principles, could initially target higher price levels, with stronger momentum potentially extending the rally significantly. Other optimistic projections see Ethereum potentially reaching even higher valuations, with some analyses pointing to a fractal pattern that mirrors Bitcoin's previous bull runs.
The Derivatives Dilemma: Record Highs and Muted Enthusiasm
The derivatives market paints a more complex and, in some ways, contradictory picture. Ether futures open interest has soared to an all-time high, with the monthly trading volume on institutional-grade exchanges hitting record levels. This surge in activity, particularly from platforms favored by institutional investors, undeniably signals heightened interest and preparation for volatility.
However, a closer look at the data reveals some nuances. The record open interest, when denominated in US dollars, is largely a function of the rising price of ETH itself, rather than a massive influx of new leveraged positions. In fact, open interest measured in ETH terms remains below its previous peak.
Furthermore, derivatives data suggests a surprisingly subdued appetite for leveraged bullish bets. The annualized premium for ETH perpetual futures has been hovering around a neutral level, below what would typically indicate strong demand for leveraged longs. This could be interpreted in two ways: either the rally is being driven more by spot buying and has a more solid foundation, or there is a lack of conviction among speculative traders about the sustainability of the current price levels.
The Bearish Counterpoint: Profit-Taking, Historical Cycles, and Competitive Threats
As Ethereum's price tiptoes near its previous highs, signs of profit-taking are beginning to emerge. On-chain analytics show that short-term holders, in particular, are ramping up their selling to realize gains. While long-term holders remain relatively steadfast, daily profit realization has climbed. With a vast majority of all Ether addresses now in a state of profit, the temptation to sell could create significant headwinds, potentially slowing the ascent.
Adding to the cautionary tone is analysis from some market experts who have advised investors to consider selling their Ethereum holdings by the autumn. Citing the psychology of market cycles, one analysis suggests that the current "Optimism" phase is likely to transition into a "Market Peak/Euphoria" phase, which is historically followed by a swift and brutal correction. This perspective predicts that Bitcoin could show signs of topping out first, with Ethereum following suit, potentially leading to a significant price collapse for ETH. The short-term target in this scenario lies in a range substantially higher than current prices, but would precede this potential downturn.
Beyond immediate market sentiment, Ethereum faces long-term strategic challenges. Its dominance in the decentralized finance (DeFi) space is being contested by a growing number of independent layer-1 blockchains that offer faster transactions and lower fees. Major corporations and traditional finance entities are increasingly favoring these proprietary chains for their own blockchain projects, seeking greater control and customization. This trend is reflected in on-chain metrics, with Ethereum's total value locked (TVL) showing a decline and its weekly base layer fees lagging behind some competitors.
Ethereum vs. Bitcoin: The Flippening Narrative Resurfaces
For much of the recent crypto market action, Bitcoin has been in a state of consolidation. This has allowed Ethereum to take the spotlight, with ETH significantly outperforming BTC in recent weeks. This divergence has reignited discussions of "The Flippening," the hypothetical moment when Ethereum's market capitalization surpasses Bitcoin's.
The bull case for Ethereum's outperformance hinges on its utility as a programmable platform for DeFi, NFTs, and a host of other decentralized applications. This contrasts with Bitcoin's primary role as a store of value. The massive institutional inflows into Ethereum, both through direct purchases and ETFs, are seen as a validation of its long-term potential beyond a simple inflation hedge.
However, some Bitcoin proponents argue that the current ETH/BTC rally is an engineered market event. They allege that influential players are rotating their Bitcoin holdings into Ethereum to inflate its price based on the corporate treasury narrative, only to later sell their ETH and convert the profits back into Bitcoin.
Conclusion: A High-Stakes Balancing Act
Ethereum stands at a pivotal juncture. The powerful narrative of institutional adoption, exemplified by audacious corporate accumulation strategies, combined with bullish technical indicators, provides a credible path towards ambitious price targets. The influx of capital through ETFs and the growing recognition of Ethereum's role as the backbone of Web3 are formidable tailwinds.
However, the journey is fraught with peril. The specter of a cyclical market top, as articulated by some analysts, cannot be ignored. The increasing profit-taking by short-term holders, the ambivalent signals from the derivatives market, and the persistent competition from other layer-1 blockchains are all significant hurdles that could stall the rally.
Whether Ethereum will surge to new all-time highs and beyond or succumb to the pressures of an overheated market remains to be seen. The coming weeks will be crucial in determining if the current bull run has the legs to defy historical patterns and establish a new paradigm for the world's leading smart contract platform. For now, the market remains in a delicate, high-stakes balancing act, with the potential for both explosive gains and sharp, unforgiving corrections.

Ethereum (ETH/USD) – Elliott Wave AnalysisThe current price structure suggests that Ethereum is completing the final stages of a 5-wave impulsive advance, with the market now positioned in wave 5 of 5. Price action has reached the upper boundary of the ascending channel, coinciding with a key Fibonacci projection zone (green resistance area), which aligns with typical wave 5 termination points.
Given this confluence, the probability of a medium-to-long-term top forming here is elevated. Once wave 5 completes, a corrective phase is expected, potentially retracing towards the midline or lower boundary of the channel. The projected path (blue arrows) anticipates a significant decline, consistent with the completion of a full impulsive cycle.
Key Points:
• Structure: Impulse wave (5 of 5) nearing completion
• Confluence: Channel resistance + Fibonacci projection zone
• Outlook: High probability of reversal and corrective decline
• Targets: First support near $3,650, with deeper retracements possible toward $3,000–$2,800 if bearish momentum accelerates
This suggests caution for late long entries, as risk/reward now favors a corrective move.

ARKK: The Calm Before the Innovation Storm -ALTSEASON Is COMING🚀 ARKK: The Calm Before the Innovation Storm 🌪️
The markets are shifting, and disruption is about to go vertical. ARK Innovation ETF (ARKK) is quietly positioning itself for what could be the most explosive move of this decade. With high-conviction bets in AI, Bitcoin, genomics, and next-gen tech, this isn’t just a fund—it’s a launchpad for exponential growth.
This post breaks down exactly why ARKK could go parabolic—and why the smart money is already moving in. 👇
Explosive upside in 2026
ARKK is already up over 24% YTD , showing strong momentum compared to broader markets and signaling early stages of a potential parabolic move .
High-conviction concentration in game-changers
Top 10 holdings include Tesla, Roku, Zoom, Coinbase, UiPath, Block, Crispr Therapeutics, DraftKings, Shopify, and Exact Sciences. These are leaders in innovation sectors with massive upside potential .
Deep exposure to Bitcoin and digital assets
Heavy allocation to Coinbase and Block gives indirect exposure to Bitcoin . If BTC breaks into a new cycle high , ARKK stands to benefit significantly.
Positioned in exponential growth sectors
Focus on AI, genomics, EVs, fintech, robotics, and blockchain , all of which are entering accelerating adoption phases globally.
Aggressive smart-money accumulation
Cathie Wood’s team continues buying aggressively during dips, reinforcing institutional confidence in the fund’s long-term trajectory.
Technical breakout structures forming
Ascending triangle and multi-month consolidation breakouts suggest a technical setup primed for explosive upside .
Innovation supercycle aligning
ARKK's themes are aligned with major global shifts like de-dollarization, decentralized finance, and AI convergence .
High beta = massive upside leverage
With a beta above 2 , ARKK tends to outperform in bull runs , offering leveraged exposure to innovation without the need for margin.
Resurgence of top holdings
Names like Coinbase, Tesla, Shopify, and Roku are up 50%–100% YTD , driving ARKK’s NAV growth and fueling bullish sentiment .
Long-term vision with short-term catalysts
The fund projects 5x returns over the next five years , while Bitcoin halving cycles, tech innovation, and regulatory clarity serve as short-term ignition points .
Marty Boots | 17-Year Trader — smash that 👍👍, hit LIKE & SUBSCRIBE, and share your views in the comments below so we can make better trades & grow together!
