Ethereum Sees Major Sell-Off as Price Fails to Break $4,000Ethereum’s price sits at $3,950 at the time of writing, stuck below the critical $4,000 resistance. The altcoin has been oscillating near $3,872, showing no clear directional bias.
The current indicators suggest that this consolidation phase above $3,742 support is likely to persist. However, if market conditions worsen and ETH slips below $3,742, a further decline toward $3,489 could follow. Such a move would confirm a bearish continuation pattern.
Conversely, if buying activity strengthens and overall sentiment improves, Ethereum could breach the $4,000 resistance level. A successful breakout would open the path toward $4,221, invalidating the bearish outlook and signaling renewed investor confidence.
Ethsignals


#ETH/USDT : Another Attempt To Resume Upward Movement#ETH
The price is moving within a descending channel on the 1-hour frame, adhering well to it, and is heading for a strong breakout and retest.
We have a bearish trend on the RSI indicator that is about to be broken and retested, which supports the upward breakout.
There is a major support area in green at 3826, which represents a strong support point.
We are heading for consolidation above the 100 moving average.
Entry price: 3874.
First target: 3920.
Second target: 3969.
Third target: 4200.
Don't forget a simple matter: capital management.
When you reach the first target, save some money and then change your stop-loss order to an entry order.
For inquiries, please leave a comment.
Thank you.

BMNR HIGH PROBABILITY SETUP SOON!!!🚨 BMNR HIGH PROBABILITY BUY SETUP 🚨
* Here We Can See Clearly The Next Potential Moves For BMNR Coming Hours/Days.
* Keep Your Eyes Close On Your Trading Positions.
* Happy PIP Hunting Traders.
FXKILLA.

ETHUSD Is showing a great buy opportunity - low risk high rewardETHER - ETH/USD experienced a big drop to the downside like most other cryptocurrencies... but it nows has very clear signs of a major bullish movement ahead. There is currently a head and shoulders pattern forming which has given us high confidence that it will head to the upside. BUY NOW!

Ethereum’s Hidden Fractal Points to $33K by November 2026Most of the space seems to think that the bull market is officially over, that the four-year cycle has come to a close. For most of the cycle, I have thought that way too. 1,064 days is up, and that’s the longest a Bitcoin cycle has ever gone for. So, the idea that the same thing will play out again is very valid, and it’s entirely possible that it is indeed the end. However, my stance is very different — I still think we have one year left in the tank, and I will present a lot of evidence to support why I believe this and why I’m sticking to it.
If you’ve been following me for a while, you know that we’ve found some very interesting bar patterns in history that keep on repeating, and this will be the primary source of evidence used in my thesis.
Bar Pattern Fractals
I have tested hundreds of indicators over the last six years and bought thousands of dollars’ worth of indicators, and in the end, the highest success rate has come from simply following bar pattern fractals. They repeat over and over. They are hard to find, but once you do, you can ride them for months.
ETH 2017 Fractal
What you see above is a fractal I have been following for months now. It has been mirroring the 2017 cycle, with some parts nearly identical in movement and timing, with only a few small deviations here and there. The macro pattern continues to play out like clockwork.
Take a look at this TA from March 2025. We caught near the bottom, called for max pain, and discussed this fractal that could be playing out. The ETH call was under 2000 back then.
I also published TAs on Chainlink and its repeating bar patterns. It was straightforward for catching big macro moves for LINK.
As you can see, these are just two examples of many fractals I’m following. The main one is ETH because it’s been a 1:1 mirror for the most part. The last spike down was a deviation for sure — well, at first I thought it was on the Bitstamp chart because it has the most historical data for ETH, but when I switched to the Binance chart, I found something very interesting.
A view of the bar pattern fractal is telling us where we are.
When switching to the Binance chart, we see a very interesting wick of 26% that nuked the market during that time — very similar to what Binance has done this time around. You cannot make this stuff up. So at first, I thought it was a small deviation, but in fact, after looking at this chart, it’s still a mirror, even including that huge scam wick of 27%. Amazing.
So as you can see, in terms of the bar pattern fractal, I simply cannot ignore the fact that this keeps mirroring, and if it continues, it’s possible that we have one more year left in this bull market, and that this four-year cycle thesis is, in fact, a massive bear trap.
If we take a look at the monthly candle that shook a lot of players out last cycle before the run-up, we can see that we printed a candle with wicks on both ends — very similar to what we are forming right now.
If we zoom into that moment on a smaller timeframe, you can now see the moves are similar — a big drop into a double bottom followed by a slow grind up. This is how ETH normally puts in bottoms.
Looking at ETH’s RSI levels on the monthly chart — during the first cycle, when it broke the all-time high, RSI was extremely overbought at 87. On the last cycle, it was 82. This cycle, ETH is at an all-time high and the RSI is only 59. We’re not even in the overbought range yet — there’s so much room for ETH to expand, it’s crazy.
Since its inception, ETH has always pulled off the same move: one very aggressive wave with an aggressive pullback, followed by one smaller wave that creates a higher high to finish off the cycle. It’s done this every time.
Which means that if the bar pattern fractal continues to mirror, then wave 1 tops in the first week of January 2026, followed by a massive correction that will again fool everyone into thinking the four-year cycle is 100% over. But what if ETH puts in a bottom in February 2026 and rallies back up to all-time highs? Nobody would believe it — the disbelief would be strong because everyone would have sold the top in Q4 2025 due to the four-year cycle theory.
The second major piece of evidence I’m leaning on is the Russell 2000. Since its inception, the Russell 2000 has done the exact same thing before expansion comes:
Double top
Second drop bear trap
V-shaped recovery back to all-time high
Expansion breakout
Same thing every time. Look at the chart and tell me we’re not going into expansion — there’s a very high chance. The last two times, we got that massive monthly candle breakout in November.
Which brings me to the main point — every time the Russell goes into expansion, Bitcoin has started its most aggressive run. The last three times, Bitcoin went on to break its all-time high and put in a cycle top within an average of 355 days.
Gold, shown above, is so close to the 4.236 extension right now that it would be crazy to buy here. There’s a high chance of a major top coming in, and we’re about to see a major rotation back into Bitcoin with those gains.
Just take a look at the Power of Law model for Bitcoin — the bull market hasn’t even started yet.
It’s crazy that people are calling the cycle top with the Mayer Multiple sitting at 1.19.
Conclusion
My view is that there is one more year left in this uptrend in crypto. Bitcoin has turned into a different beast. It has completely detached itself from the rest of crypto for the most part, but the first expansion is coming in 2026. If the bar pattern does not deviate, then greatness lies ahead.

Ethusdt - dragon longIf you like the idea, please put a ‘like’. It's the best ‘Thank you!’ 😊 P.S. Always do your own analysis before a trade. Set a stop loss. Capture profits in instalments. Withdraw profits in fiat and make yourself and your friends happy.

Ethereum Falls Below $4,000—But A Price Rebound Could Be NearEthereum’s price currently sits at $3,727, having fallen from $4,000 in the past 48 hours. However, technical indicators suggest that the altcoin may soon see a reversal, with investors preparing to defend key support levels.
If Ethereum bounces off the $3,742 support line, it could climb back toward $4,000. A successful breach of that barrier would likely push ETH higher, targeting the $4,221 level once again. This movement would align with historical recovery trends seen after periods of capitulation.
Still, a failure by investors to sustain momentum could trigger a deeper correction. Should the market sentiment turn bearish, Ethereum may decline toward $3,489. A drop below this level would invalidate the short-term bullish outlook, delaying any potential rebound.

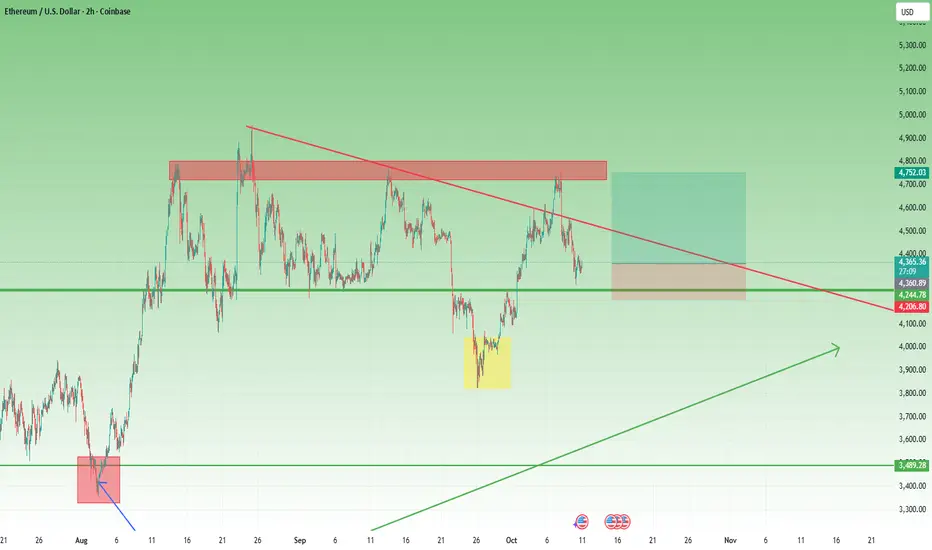
ETH - Potential Bullish Reversal towards PDHETHUSD – Potential Bullish Reversal Scenario 🐂
We’ve observed a strong bullish reaction following a sweep of the previous day’s low (PDL) within our identified Point of Interest (POI), aligned with a 1-hour Bullish Imbalance (BISI).
This reaction suggests a possible shift in market structure, and we are now anticipating a reversal to the upside, potentially targeting resting sell-side liquidity. There is also a chance we may see a Symmetrical Movement Theory (SMT) divergence forming relative to BTC, which could further validate bullish intent.
From my perspective, the liquidity engineered below the recent sweep presents a strategic area where institutional participants may look to accumulate long positions for a more sustained move upward.
We also have favorable draw on liquidity (DOL) to the buy side, including the previous day’s high (PDH) and visible engineered liquidity levels above.
Let’s now monitor price action following this bullish reaction to assess whether confirmation for a higher move develops.

ETH/USD Bearish Retracement from Daily FVG Zonea bearish retracement setup on Ethereum (ETH/USDT) in the daily timeframe. After a strong bearish impulse, the price entered a highlighted Daily Fair Value Gap (FVG) zone — a potential area of supply where sellers may regain control. The projection indicates a likely short-term pullback into the FVG before continuing downward toward Target 1 (≈ $3,601) and Target 2 (≈ $3,399).

BTH: Support Above 3800Today, after experiencing a sharp drop at the opening, the price of Ethereum found support above 3,800 and rebounded. Both attempts to test the bottom failed to break through the support at 3,800, which proves that the support here is solid. Then it entered a trend of slight oscillation and rebound. The long-short game is still relatively fierce. The subsequent trend needs to pay attention to the breakthrough of the key level of 4,000 and the effectiveness of the upper and lower support and resistance.
Buy 3930 - 3940 TP 3955 - 3965 - 3975 SL 3925
Sell 4015 - 4020 TP 3990 - 3980 - 3970 SL 4025
Daily-updated accurate signals are at your disposal. If you run into any problems while trading, these signals serve as a reliable reference—don’t hesitate to use them! I truly hope they bring you significant assistance

ETH : BUY OR SELL ?Hello friends
Given the good decline we had, there was a good opportunity to buy at good prices with capital and risk management and in steps and move towards the specified goals.
*Trade safely with us*

ETH/USDT — Critical Retest at 3950–3520 Before Next Major Move?Ethereum has once again faced strong rejection from the key supply zone between 4,940–5,272 (Fib 0.5–0.618), signaling heavy selling pressure at this multi-year resistance area.
Price action now points toward a potential retracement into the major demand zone (yellow block) between 3,950–3,520, where the next directional move is likely to be decided.
---
📊 Key Technical Structure
Major Supply Zone: 4,940 – 5,272 (Fib 0.5–0.618)
Minor Support: 4,120
Primary Demand Zone (Yellow Block): 3,950 – 3,520
Next Supports (if broken): 3,210 → 2,132
Bullish Fibonacci Targets: 6,345 → 8,082 → 10,891
---
📈 Bullish Scenario — “Reclaim & Expansion”
ETH still maintains a macro structure of higher-highs and higher-lows on the weekly timeframe.
As long as the 3,520 support holds, the broader trend remains bullish.
A strong rebound from 3,950–3,520 followed by a weekly close above 5,272 would confirm bullish continuation and open up:
Target 1: 6,345 (Fib 1.0)
Target 2: 8,082 (Fib 1.618)
Target 3: 10,891 (Fib 2.618 — potential cycle top)**
The key confirmation for bulls is a weekly reclaim above 5,272 with volume.
---
📉 Bearish Scenario — “Breakdown & Deeper Retracement”
If the selling pressure continues and ETH closes below 3,520, the bullish structure will be invalidated.
Such a breakdown could trigger a deeper retracement toward:
3,210 (Fib 0.618 confluence)
2,132–1,955 (deeper structural retracement)
Failure to defend the yellow block would shift ETH into a lower-high / lower-low structure, signaling a medium-term trend reversal.
---
🔍 Market Context
ETH is currently retesting the same macro resistance zone that marked the all-time high area in 2021.
The rejection at 5K highlights that supply remains dominant in this region, while the 3,950–3,520 demand block now serves as the key battlefield for bulls and bears.
As long as the yellow block holds, this pullback can still be considered a healthy correction within a macro uptrend.
But if it breaks, the market may enter a prolonged consolidation phase before the next cycle begins.
---
📍 Summary
Ethereum stands at a major inflection point:
Bullish Case: Bounce from 3,950–3,520 and reclaim 5,272 → targets 6.3K – 8K – 10.8K
Bearish Case: Breakdown below 3,520 → deeper correction to 3.21K or even 2.13K
The 3,950–3,520 demand zone is the final defense for ETH’s mid-term bullish structure — hold it, and the trend continues; lose it, and momentum fades.
---
#Ethereum #ETHUSDT #Crypto #TechnicalAnalysis #Fibonacci #PriceAction #CryptoMarket #WeeklyChart #ETHAnalysis #MarketStructure

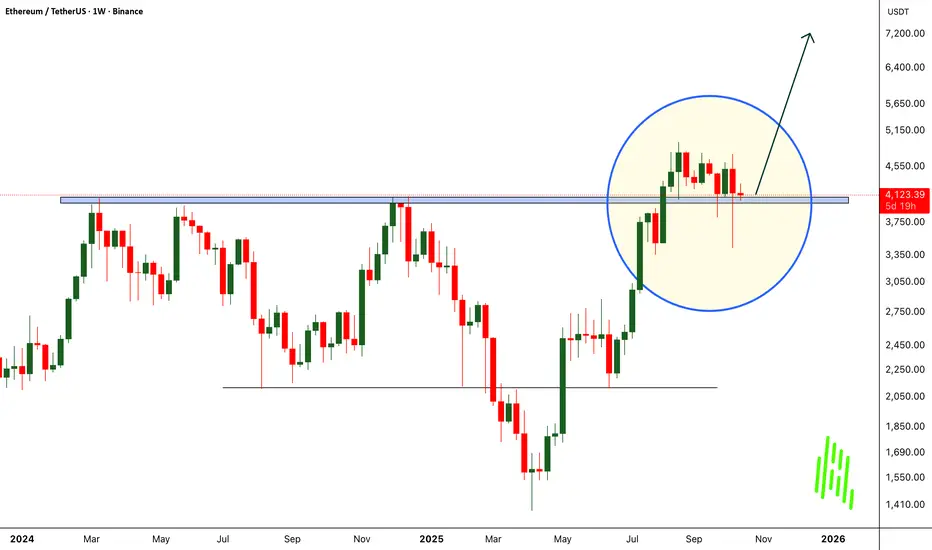
ETH Bulls Defending $4000. Can They Spark the Next Rally?After breaking out from a major resistance, BINANCE:ETHUSDT delivered a clean and healthy retest, just as expected. The bounce from that level showed strong buyer confidence, confirming that bulls are still in control.
Currently, Ethereum is holding a crucial support zone around the $4000 range. This level will play a key role in determining the next big move. If CRYPTOCAP:ETH manages to sustain and bounce from here, we could see the price rallying towards the $7000–$8000 zone in the coming weeks.
However, traders should stay cautious, a drop below $3500 could signal further downside and a deeper correction. As always, risk management is key in every setup.
Watch the $4000 zone closely, the next CITYINDEX:ETHUSD wave could be massive!
Follow Our Tradingview Account for More Technical Analysis Updates, | Like, Share and Comment Your thoughts
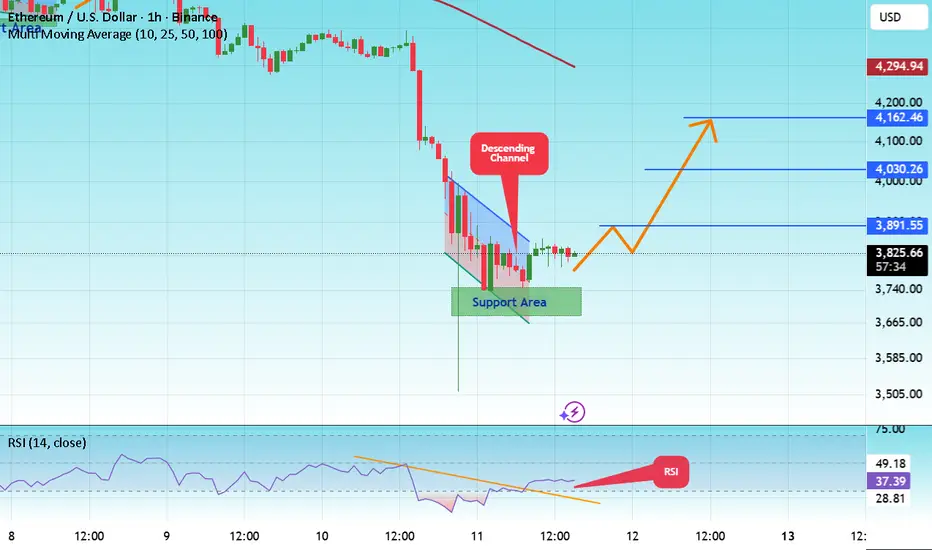
#ETH/USDT forms bullish patterns#ETH
The price is moving in a descending channel on the 1-hour frame and is expected to break and continue upward.
We have a trend to stabilize above the 100 moving average once again.
We have a downtrend on the RSI indicator that supports the upward move with a breakout.
We have a major support area in green that pushed the price higher at 3700.
Entry price: 3817.
First target: 3890.
Second target: 4030.
Third target: 4162.
To manage risk, don't forget stop loss and capital management.
When you reach the first target, save some profits and then change your stop order to an entry order.
For inquiries, please comment.
Thank you.
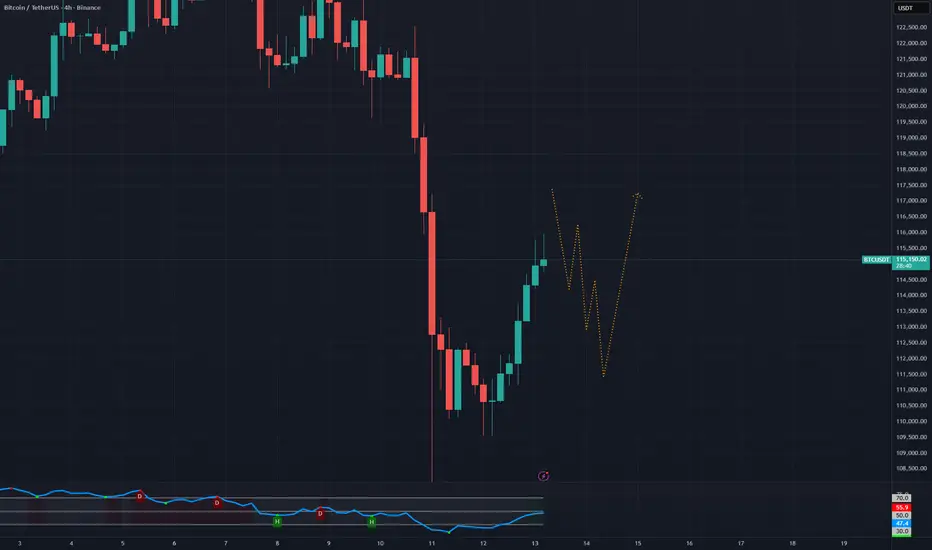
BTC Weekly Outlook (Oct 13 → Oct 20)After that brutal dump on Oct 10, BTC has been slowly reclaiming key levels — showing a short-term optimism across the market. It’s clear that many traders are buying the dip, thinking the crash was just a massive long squeeze after an overheated rally.
But personally, I don’t think it was just a long squeeze. It felt like a broader reaction to Trump’s sudden policy shift — something the market simply couldn’t price in fast enough. Both equities and crypto got hit hard by that shock, especially since everything had only recently stabilized after months of inconsistent policy moves under Trump’s return.
Looking at BTC, ETH, and internal money flow across the crypto market, I think we’re likely to see another short-term correction coming soon. Here’s why:
Profit-taking after the bounce:
The market just recovered from a deep dip — many short-term traders will likely take profits early, especially since the last BTC collapse still left a scar on most of them.
Stalled inflows:
The recent bounce didn’t come with major inflows. There’s been some recovery, but overall volume and liquidity seem to be slowing down.
Smart money behavior:
This bounce looks heavily driven by institutional/smart money. These players don’t gamble — they’ll wait to see how the market reacts next. If BTC drops again, expect them to pull back temporarily or rotate funds into BTC from alts (e.g., ETH).
Heavy resistance ahead:
BTC faces a major resistance zone at $116.8k – $117.5k. Breaking through that level will require a strong, high-volume push — not something easy to achieve right now.
Still, the weekly (W) timeframe remains healthy — momentum is intact, and overall this could still be viewed as a normal correction inside a larger bullish structure.
My take for the week (Oct 13 → Oct 20)
Price will likely attempt to push into the resistance zone above, but I expect at least one rejection bounce before any real breakout.
If that push fails, BTC might retest market sentiment around $114k, or in a more bearish case, down to $112k – $111.8k.
So this week, keep an eye on how price reacts near the upper resistance.
If we see a strong rejection, it’s worth considering short opportunities toward the lower zone — but be flexible with exits depending on how price reacts.
During the first half of the week, expect some choppy, whipsaw moves as bulls and bears fight for control.
After Oct 16, we’ll likely get a clearer short-term trend direction for the following week.
mrmoney limited ETH/USD position trading ideaprice has approached our monthly key resistance level which made price to have a bearish turn we have a minor support zone which price reacted to and has recently givenen us bullish momentum

ETH— What the 3500 Support Means and How I’m Trading ItExactly on Friday, just before the big drop, I bought ETH at 4300.
Fortunately, I had a stop loss at 4150, which — of course — got triggered.
But instead of frustration or searching for someone to blame, I took it like a trader should — accepted it, moved forward, and focused on what’s next. Because in trading, maturity starts where ego ends.
Technical Picture
Looking at the chart, after breaking the 4300 support line, ETH accelerated to the downside and found buyers around 3500.
This level is not random — it’s defined by:
1. A major horizontal support
2. The ascending trendline from previous lows
3. And the psychological round number of 3500
Naturally, we saw an initial rebound from that area.
Trading Plan
If the market retests the 3500 zone, I’ll be looking for buying opportunities, targeting a potential retest of 4300.
However — and this is crucial — my trade will be low-volume and protected by a tight stop.
Why? Because while I believe this could be a turning point, so does everyone else.
And when every retail trader sees the same thing, I trade carefully — because as we’ve all learned now, there’s no such thing as free money.
Final Thought
Discipline is not about winning every trade — it’s about staying rational when emotions scream louder than logic.
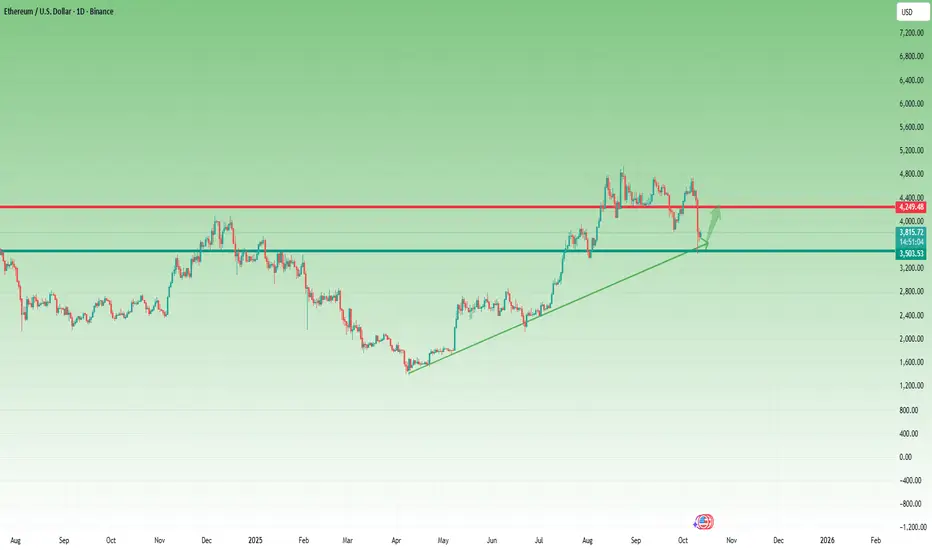
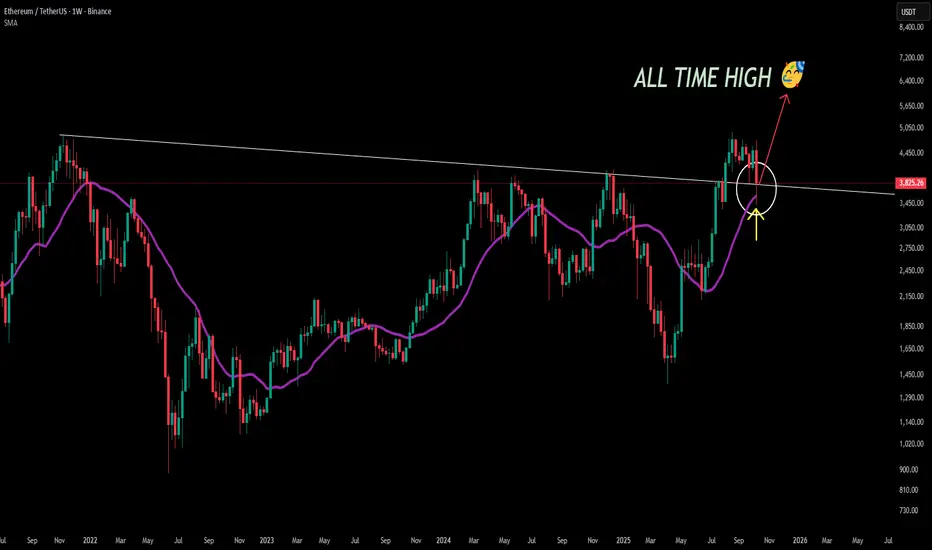
ETH might make a new all time highFrom the current weekly structure, Ethereum (ETH) appears to have completed its corrective phase. Yesterday’s move shows a clean retest of both the 20-period SMA and the long-term descending trendline, confirming this area as a strong confluence zone of support.
This reaction signals a potential reversal point where buyers may regain control. Given this setup, my bias turns bullish — I believe ETH has likely finished its downside correction and could be setting up for a major upward leg.
📈 Outlook: Over the coming months, I expect Ethereum to build momentum and potentially print a new all-time high if market conditions remain supportive.
Still, markets are inherently unpredictable — this remains my personal technical view, not financial advice.
$ETH hit our first target at $3,500 exactly as expected.CRYPTOCAP:ETH hit our first target at $3,500 exactly as expected. As mentioned, a short bounce from that zone played out with an $800 move, pushing the price above $4,300. Now ETH is trading around $3,800. For a sustained upside, it needs to reclaim $4,000 as support. I’m still holding my short setup if $4,000 isn’t regained, the next downside targets remain $3,500 and $3,000.
Only your like motivate me
ETH Correction Complete? Bullish Setup Reemerges As I mentioned in my previous ETH analysis, while my medium-term outlook remains bullish, I was anticipating a short-term correction.
That’s exactly what unfolded. After retesting the 4750 resistance zone, Ethereum began to retrace, reaching the support area just below 4300 earlier today.
Currently, the price is rebounding, and there’s a strong probability that the corrective phase has ended.
I’m now looking to re-enter long, as even a move back to the recent highs could offer a 1:2.5 risk–reward setup — a solid short-term opportunity within the broader bullish structure.
$ETH Performing Ascending Channel
An ascending channel, or rising channel, is a chart pattern used in technical analysis to identify a security's ongoing uptrend. It is characterized by the price fluctuating between two parallel, upward-sloping trendlines.
Key components
Higher highs and higher lows:
The price consistently makes higher swing highs and higher swing lows over a period of time, indicating steady bullish momentum.
Parallel trendlines:
Two parallel lines are drawn to frame the price action.
Upper line (resistance):
Connects the higher swing highs. It represents the point where selling pressure is strong enough to temporarily stop the price from rising.
Lower line (support):
Connects the higher swing lows. This line indicates where buying pressure is strong enough to prevent the price from falling further.

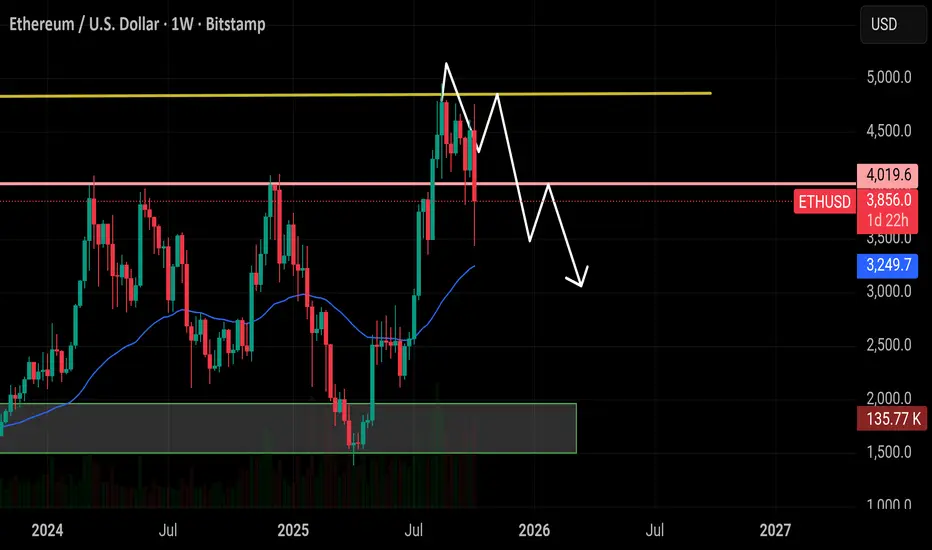
ETH/USDT: Two shortsHi guys!
Overall Market Structure
The price has been moving within a rising parallel channel, making higher highs and higher lows, which forms a bullish structure.
Recently, however, the price broke below the lower boundary of the ascending channel, signaling a potential bearish reversal or a correction phase.
The recent bounce toward the previous channel support (now resistance) forms a potential short entry zone.
📉 Short Position 1 (Aggressive Entry)
Entry: Around $4,485–$4,500
Reasoning: Price retested the broken channel support line (now acting as resistance).
Stop-Loss: Above $4,575, just beyond recent swing high/structure break.
Take-Profit: Around $4,345.
Risk–Reward: Approx. 1:2
📉 Short Position 2 (Conservative Entry / Continuation Setup)
Entry: After a confirmed lower high and bearish candle close below $4,450.
Reasoning: Confirms momentum shift toward the downside.
A break and retest of $4,345 support could open the way to $4,090, the next demand zone.
Stop-Loss: Above $4,510 (recent minor resistance).
Take-Profit: Around $4,090 (bottom of marked green area).
Risk–Reward: Approx. 1:3 or higher
