ETHUSD 1H – Bulls Gaining StrengthBITSTAMP:ETHUSD
📊 🚀
Structure | Trend | Key Reaction Zones
ETH retested the strong demand zone (4400–4450) and showed a clear bullish reaction, reclaiming short-term structure with higher lows forming.
Market Overview
After the sharp rejection from the 4750 resistance zone, ETH entered accumulation and tapped the key demand box. Price is now showing momentum recovery with bullish candles breaking back above the 4500 level, indicating potential continuation toward upper resistance levels.
Key Scenarios
✅ Bullish Case 🚀 → 🎯 Target 1: 4620 | 🎯 Target 2: 4670 | 🎯 Target 3: 4750
❌ Bearish Case 📉 → Break below 4450 may shift bias back toward 4400.
Current Levels to Watch
Resistance 🔴: 4620 – 4670 – 4750
Support 🟢: 4450 – 4400
⚠️ Disclaimer: This analysis is for educational purposes only. Not financial advice.
Ethsignals

HERE ARE THE NEXT TARGETS OF BITCOIN AND ETHEREUM (warning) Yello Paradisers! Enjoy the video!
And Paradisers! Keep in mind to trade only with a proper professional trading strategy. Wait for confirmations. Play with tactics. This is the only way you can be long-term profitable.
Remember, don’t trade without confirmations. Wait for them before creating a trade. Be disciplined, patient, and emotionally controlled. Only trade the highest probability setups with the greatest risk to reward ratio. This will ensure that you become a long-term profitable professional trader.
Don't be a gambler. Don't try to get rich quick. Make sure that your trading is professionally based on proper strategies and trade tactics.

ETHUSD Bullish Trend Potential | Break and Retest Trade Plan📹 In this video, we take a closer look at Ethereum (ETH), which has been in a strong bullish trend on the higher time frames 🔥. Recently, ETH has seen a deep pullback, offering potential opportunities if price action confirms a bullish break of market structure on the 30-minute timeframe ⏱️.
💡 I’m watching for a break and retest of the existing range low support, which could signal a continuation of the broader uptrend.
📊 In the video, we cover price action, market structure, trend analysis, and share a trade idea based on these factors 🎯.
⚠️ Disclaimer: This content is for educational purposes only and not financial advice.

$ETH hit the $4,750 resistance again, just like I said before. CRYPTOCAP:ETH hit the $4,750 resistance again, just like I said before. It went below $4,000 for a short time but closed the week back above it. Now the price is falling again. If it breaks below $4,000, the next targets are $3,500 and $3,000.

Continuation of the previous idea based on the Harmonious EnergyThe consolidation phase is coming to an end. The market structure is gradually moving into the next stage of the energy cycle, where a new flow direction is forming.
At the moment, I am observing a continuation of the energy movement with a noticeable manifestation of buyer strength. The key focus is on price behaviour near the resistance level — this is where it will become clear whether buyers will be able to maintain control and continue the upward momentum, or whether the market will enter a redistribution phase.
According to the GPE concept, this moment reflects the transition from balance to energy release — when the accumulated potential turns into real movement.
📌 Observation: price reaction to resistance and confirmation of the flow's strength.
💬 If you have any questions or would like to discuss the idea in more detail, I am always open to dialogue.

Trading idea based on the Harmonious Energy Flow (HEF) conceptAt the current stage, there is a clear manifestation of buyers’ strength, even though the market environment is changing rapidly without any significant price movement. This forms a state of consolidation, where energy is being accumulated for the next impulse.
According to the HEF concept, consolidation represents a transitional phase — the market is searching for balance before initiating a new wave of directional movement. My current expectation is focused on the moment of breakout from consolidation, when the market will reveal the true side of strength.
📌 Main focus: observing how buyers maintain their advantage within this narrow structure and waiting for a signal confirming the exit from balance.
If you find my charting approach interesting, you are welcome to connect and discuss further. I’m open to communication and collaboration.
Would you like me to refine this version for maximum stylistic alignment with TradingView’s publication tone (slightly shorter, more analytical, and visually structured)?
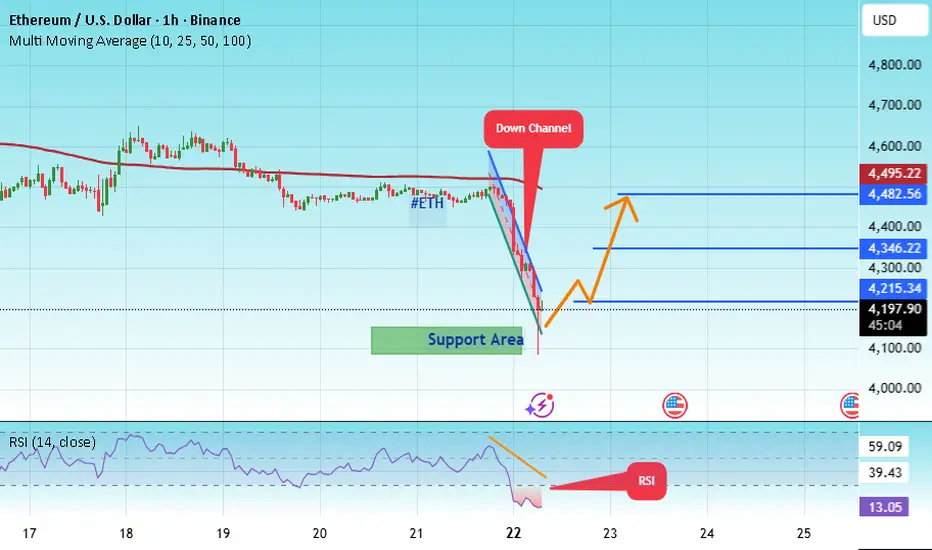
#ETH/USD - Roll back - Its coming baack to 4500#ETH
The price is moving within a descending channel on the 1-hour frame, adhering well to it, and is heading for a strong breakout and retest.
We have a bearish trend on the RSI indicator that is about to be broken and retested, which supports the upward move.
There is a major support area in green at 4111, which represents a strong support point.
We are heading for consolidation above the 100 moving average.
Entry price: 4136.
First target: 4215.
Second target: 4346.
Third target: 4482.
Don't forget a simple matter: capital management.
When you reach the first target, save some money and then change your stop-loss order to an entry order.
For inquiries, please leave a comment.
Thank you.
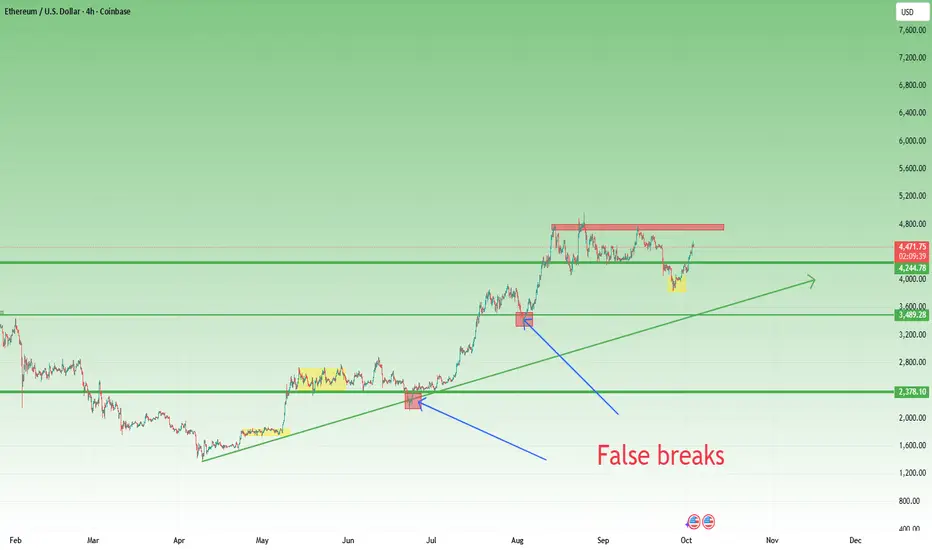
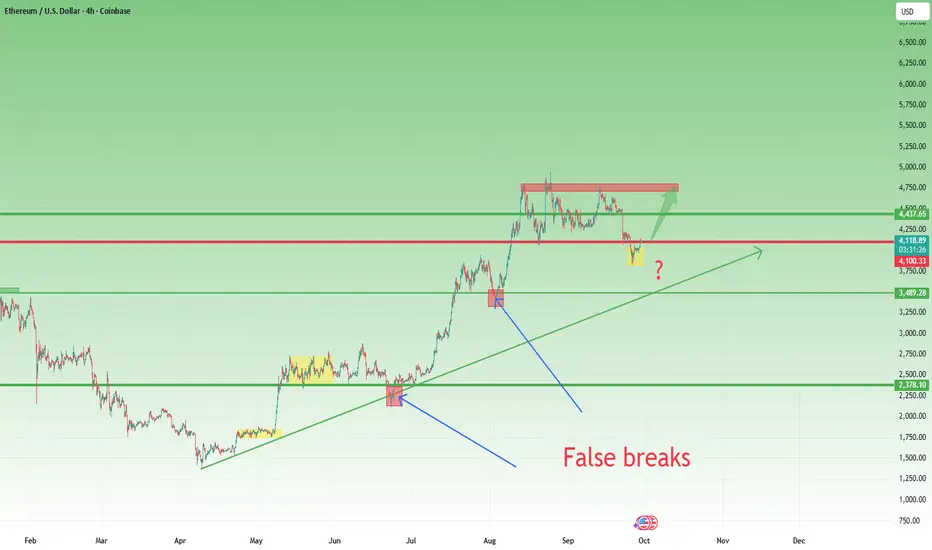
Ethereum: Bulls in Control, But Time for a BreatherIn my previous ETH analysis, I pointed out the high probability of a false breakdown under the 4100 technical support and the 4000 psychological level.
The reasoning was simple: during the strong bull leg from 1350 to 4900 (since April), ETH had already shown this type of price action twice.
That call proved correct. ETH reversed higher, hit my 4400 target, and even pushed further, printing highs close to 4600.
Now, after a nearly 15% rise since last Friday, the market may be due for a pause — a chance to consolidate or correct part of the gains.
________________________________________
Technical View
• Support: 4300 is the key level. As long as this holds, bulls remain in control.
• Resistance: Immediate pressure sits near 4600, the recent top.
• Structure: The trend remains strong and healthy, but after such a rapid move, short-term cooling is normal.
________________________________________
Trading Plan
The strategy remains simple: buy dips against 4300.
As long as that support is intact, ETH’s bull case stays firmly alive. 🚀
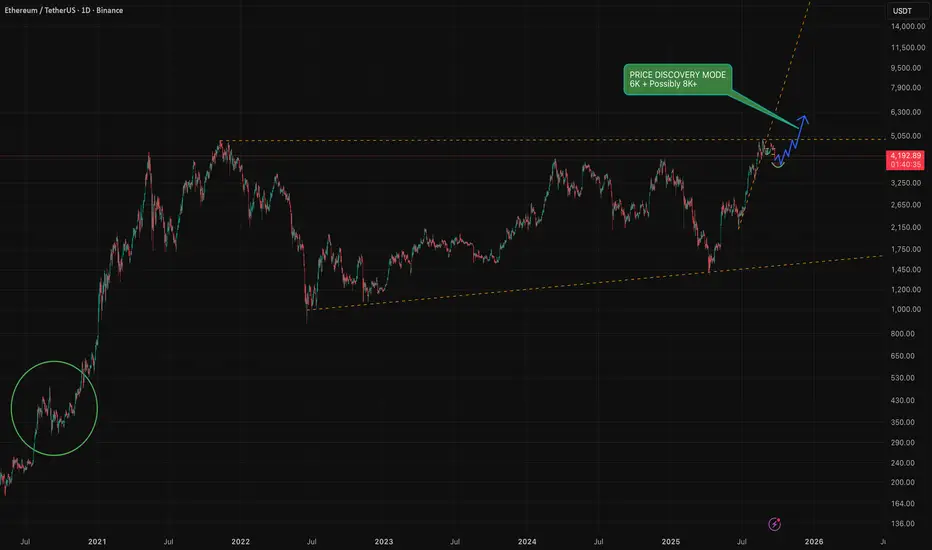
ETH Top / all time high In my earlier analysis I predicted the 2020 September happening again and it is happening as you are reading this.
From the chart and my analysis I can see ETH topping out around 6.8K this run !
I know, we are all hoping for 12K this BullRun and more but personally I am taking out profits around 6K slowly until the top hits and see a clear reversal.

History doesn't repeat but RHYMES ! I highly recommend everyone to have look at September 2020
I personally think that this will be the same scenario where we will have some fake-outs to drive the retails out / liquidate then the price will carry on upwards and go into price discovery mode where we are more likely to see 6K and hopefully more, if the volume and kicks in the ETF's and more retail pump we can see somewhere between 8K to 12K ( Optimistically )
I personally will be taking profits along the way tho and not going to wait for the top as we all know no one can predict the top nor the bottom !
Thank you all for reading my idea and feel free to share yours here in the comments.
To get access to my indicators please join the FREE tg channel, link in my BIO !
Ethereum Price Approaches $4,500 Despite Crucial Holders’ ExitEthereum is trading at $4,383, just below the $4,500 resistance level. The altcoin king has attempted several times to secure $4,500 as a support floor but has not yet succeeded. This remains the most critical barrier in determining ETH’s near-term direction.
If inflows continue strengthening, ETH could break past $4,500 and secure it as support. Such a move would pave the way for a rise toward $4,775 and potentially retest the all-time high of $4,956. The continuation of this momentum would reinforce a strongly bullish outlook.
However, failure to breach resistance could change sentiment. Ethereum risks slipping back to $4,222 support, with the possibility of falling to $4,074. Such a decline would invalidate the bullish thesis and signal renewed weakness in the altcoin king’s price action.

Market idea based on the Harmonious Energy Flow (HEF) conceptAt the current stage, we can observe a clear manifestation of buyers’ strength, even though the market conditions are shifting rapidly without any significant price expansion. This creates a state of consolidation, where energy is being accumulated for the next move.
According to the HEF concept, consolidation represents a transitional phase — the market is searching for balance before moving into a new wave of directional flow. My current expectation is the transition towards the breakout moment, when price finally exits this consolidation zone and reveals the true side of strength.
📌 Key focus: monitoring how buyers sustain their advantage within this tight structure, and waiting for the signal of release from balance.
If you find my charting approach interesting, you are very welcome to connect for further discussion. I am open to dialogue and exchange of views.

$BMNR - Cup & Handle Formation $215 Price TargetA major cup and handle pattern is forming. Watch for breakout level around the 64-ish level. Once breakout occur, use the Fib extension overlay for price objective that can range from $81 to $215. This is a very bullish setup happening.

Ethereum Price Bounces Off 7-Week Low—Future Still Promising?Ethereum trades at $4,187, just under the $4,222 resistance level after rebounding from a $3,872 low. This recovery highlights buyer interest at support levels. However, the broader market remains cautious, waiting to see whether Ethereum can sustain momentum and reclaim critical price barriers.
If Ethereum breaches $4,222, it could flip this level into support, potentially extending gains. Still, breaking above $4,500 will be difficult without fresh inflows. Limited liquidity and investor hesitation could keep Ethereum rangebound, consolidating until stronger catalysts emerge in the market.
On the downside, failure to maintain support could reignite bearish sentiment. If selling intensifies, Ethereum might slip through $4,074 and retest $3,872. Such a decline would invalidate the bullish outlook.

#ETH/USDT : Bounce From Support, Eyes on $ 4128#ETH
The price is moving within a descending channel on the 1-hour frame, adhering well to it, and is heading for a strong breakout and retest.
We have a bearish trend on the RSI indicator that is about to be broken and retested, which supports the upward breakout.
There is a major support area in green at 3950, which represents a strong support point.
We are heading for consolidation above the 100 moving average.
Entry price: 4012.
First target: 4050.
Second target: 4084.
Third target: 4128.
Don't forget a simple matter: capital management.
When you reach the first target, save some money and then change your stop-loss order to an entry order.
For inquiries, please leave a comment.
Thank you.

ETH Repeats the Pattern – $4800 Next Target?In my previous ETH analysis, I pointed out that while the price broke below the $4100 technical support and the $4000 psychological level, this move could represent a false break. But for this scenario to be valid, the market needed confirmation.
Since then, ETH has stabilized above $4000 and is now hovering around the $4100 level again.
📌 Looking back at the April rally (from $1400 upwards), we can already identify two similar cases of temporary breakdowns followed by strong recoveries.
• Each time, the market shook out weak hands before resuming the bullish leg.
• This repetition builds the case for another potential rebound, even if no outcome is ever guaranteed.
⚡ Trading Outlook:
• Bullish scenario: I expect ETH to rebound towards the $4400 zone, with the possibility of a retest of the $4800 resistance.
• Invalidation: A daily close back under $4000 would cancel this bullish setup and reopen the downside risk.
• Confirmation: A strong daily close near the highs of the day will add conviction to the bullish continuation.
👉 For now, the structure remains intact, and the bias stays bullish. The key levels to watch are $4000–4100 supports and $4400–4800 for resistance. 🚀
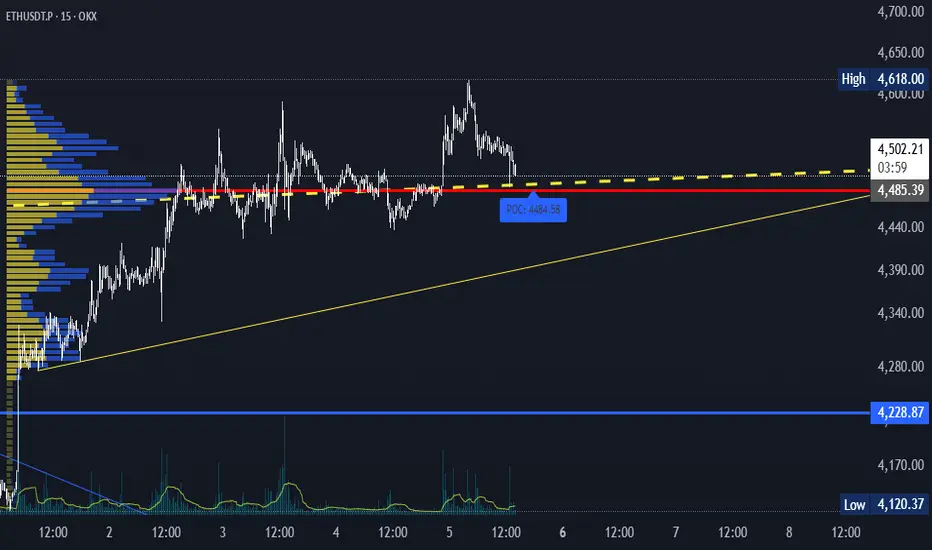
ETHUSD Weekly Scenarios BullsWeekly Scenarios
Bulls
If ETH holds support at $4,200 and manages to rebound above the $4,500-4,600 resistance, we can expect a rally to $5,000 and beyond.
Sideways/Consolidation
The price may remain stuck in the $4,200-4,600 range until the market finds enough signal or volume to break out.
Bears
A breakout below $4,200 with volume confirmation will lead to a decline to $3,800 and below.

ETHEREUM HIGH PROBABILITY SETUP SOON!!!🚨 ETHER HIGH PROBABILITY BUY SETUP 🚨
* Here We Can See Clearly The Next Potential Moves For ETHUSD Coming Hours/Days.
* Keep Your Eyes Close On Your Trading Positions.
* Happy PIP Hunting Traders.
FXKILLA.

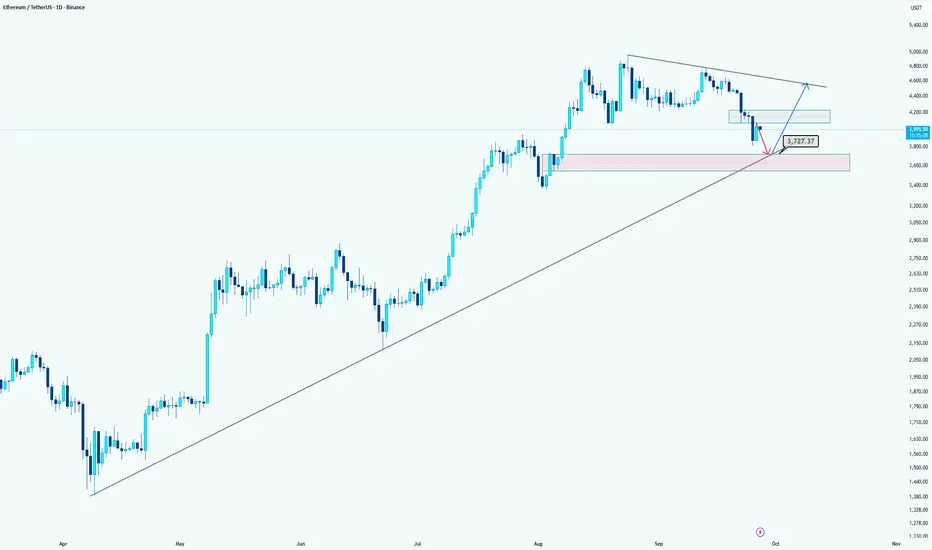
Ethereum: Levels to WatchHi guys!
Ethereum is currently showing weakness after failing to break higher. The price is likely to retest the MPL zone around $3727, which also aligns with the long-term ascending trendline, making it a strong confluence support.
The pink area highlights a potential demand zone where buyers may step in. If the market confirms bullish signals in this area, a long position toward the descending trendline resistance could be considered. However, extra confirmations are recommended before entering long.
Summary:
Short-term target for shorts: $3727 (MPL plus trendline support).
Watch the pink zone for potential long entries, but wait for confirmation.
Let's see what will happen!
From 4800 Highs to 3850 Lows – ETH Eyes RecoveryAfter a fresh test of the 4800 zone in mid-September, ETH started to decline, with the selloff accelerating after September 22nd, in line with the broader crypto market weakness.
The drop broke below the 4100 technical support and even under the psychological 4K mark, sending price as low as 3850.
Yesterday, however, ETH managed to recover part of the losses and climbed back above 4K, a positive sign for the bulls.
From a structural point of view, the overall trend remains strongly bullish, and I see this move as nothing more than a correction and a hunt for liquidity at lower levels.
Trading Outlook:
• In the coming days, I expect ETH to reclaim the 4100 zone, turning the breakdown into a false break.
• If that happens, the door opens for upside continuation, with potential to retest 4500 and even challenge the 4800 resistance again.
• For now, I remain on the sidelines, waiting for confirmation before taking a new position.

#ETH is on a mission New ATH#ETH is on a mission to reach its new all-time high (ATH).
First, it may liquidate some long traders, then fill the order blocks of smart buyers before creating a new ATH.
~Namaste~
$ Jai Shree Ram $

$ETH is trading around $4,000 after hitting the $4,800–5,000 $ CRYPTOCAP:ETH is trading around $4,000 after hitting the $4,800–5,000 resistance zone I mentioned in my last update. As expected, a short-term correction is playing out toward $3,500–$3,200, with possible extension to $3,100, where I’ll be looking to buy again. My bullish targets remain around $5,000 and $6,000, and I’ll share timely updates as the setup develops.

BMNR HIGH PROBABILITY SETUP SOON!!!🚨 BMNR HIGH PROBABILITY BUY SETUP 🚨
* Here We Can See Clearly The Next Potential Move For BMNR Coming Hours/Days.
* Keep Your Eyes Close On Your Trading Positions.
* Happy PIP Hunting Traders.
FXKILLA.
