ETH Bullish 24-Hour Forecast ☀️ $2,500 Coming?A bullish sun ☀️ continues to dominate the skies over the global crypto market in the next 24 hours, indicating further upside potential for Bitcoin, Ether, and many altcoins. These bullish conditions will persist over a one-week horizon, according to ATTMO.
Exceptions are Avalanche, Binance Coin, and Uniswap which will face bearish clouds ☁️ and downside risk in the next 24 hours, as well as Ripple’s XRP and Uniswap over the coming week.
Folow us for more crypto weather reports!
Ethusdanalysis

Ethereum big trap for allPrepare for nice bull trap with further bear trap.
Not a trading idea, just my opinion.

ETH - SHORT TERM | MID TERM OUTLOOKETH
As we can see here we are in a bearish consolidation pattern which is not speaking with the rest of the market - Is ETH wrong or is ETH the leading indicator?
Being unbiased looking at the data i will have to make the assumption we are going to have a pull back - Rising wedge and rejecting off of our top trend line for the third time sitting alongside a strong resistance\support zone - i am expecting a break down of this wedge at some point if we are able to break above then the markets really turn bullish and we can look for the highlighted box for eth MID term target zone - Altcoins will follow ETHs moves exponentially

Celebrating Ether's Breakthrough! Let's Ride the Bullish WaveEther (ETH) has just broken through its prior resistance levels and is now eyeing its next target of $3000! 🚀🎉
The recent surge in Ether's price has been nothing short of remarkable. With each passing day, it becomes increasingly evident that the Ethereum network and its native token, Ether, are gaining tremendous momentum and support from institutional and retail investors alike. As traders, this is an opportunity we cannot afford to miss!
So, why should you consider long positions on Ether? Allow me to present you with some compelling reasons:
1. **Technical Breakthrough**: Ether's successful breach of prior resistance levels indicates a significant shift in market sentiment. With an ever-growing ecosystem of innovative projects and smart contracts, Ethereum's potential for further growth and adoption is immense. By longing Ether, you're positioning yourself at the forefront of this exciting revolution.
3. **Institutional Support**: Major institutions are increasingly recognizing the value and potential of Ether. With companies like Tesla, Square, and PayPal embracing cryptocurrencies, we can expect more institutional investors to follow suit. By entering long positions now, you'll be aligning yourself with the big players in the market.
Now, it's time for action! Seize this opportunity and join me in long positions on Ether. Let's maximize this bullish trend and ride it to new heights together. Here's what you can do to get started:
1. **Evaluate Your Strategy**: Take a moment to review your trading strategy and consider incorporating long positions on Ether. Assess your risk tolerance and set appropriate stop-loss levels to protect your capital.
2. **Choose a Reliable Exchange**: Ensure you're using a reputable and secure cryptocurrency exchange that supports Ether trading. Look for platforms with robust trading features, competitive fees, and reliable customer support.
3. **Stay Informed**: Keep a close eye on market trends, news, and technical analysis to make informed trading decisions. Stay connected with reliable sources and engage with fellow traders to gain valuable insights.
Remember, trading involves risks, and you must conduct your due diligence before making any investment decisions. However, with Ether's current momentum and potential, now might be the perfect time to jump on board and ride the wave of success.
Let's celebrate Ether's breakthrough together and make profitable trades! If you have any questions or need further assistance, feel free to reach out via commenting below. I'm here to support you on this exciting journey.

ETHUSD Payback time :))CRYPTOCAP:ETH Still in stong bearish from the effect of small dump at BTC (previous analysis),
sadly my stoploss hit T_T
Right now ETH hit fibonacci support inside an ascending triangle pattern. This is bullish continuation pattern, target from this fibonacci are at $2216.66, but my target only at resistance pattern $2137
My plan are simple, buy with 2% risk at $2009.04 (fibonacci) and rebuy with 2% risk at support around $1973.36
with target 75% close at target 1 and close all at target 2.
If I got more support at this analysis, i will update more frequently in every key level.
click here if you wanna check my previous analysis

BTC dominanceBTC dominance plays a very important role in deciding the future of the crypto market. BTC dominance is making HH HL but we have mentioned a point where you can see the bearish move and this can give you a good chance to earn in #ALTS

Analyzing ETH's Future: A Cautious Approach to Long Positions
While some voices in the market are calling for ETH to reach all-time highs, it is crucial to approach these predictions with a cautious mindset. As traders, we understand the importance of thoroughly analyzing various factors before making any investment decisions. Let's take a moment to consider the current situation and its potential implications.
ETH has undoubtedly been on an impressive upward trend, showcasing remarkable resilience and growth. However, as we approach new price levels, it becomes increasingly important to exercise caution. History has taught us that markets are rarely linear, and corrections are an inherent part of any asset's journey toward new heights.
In light of this, I encourage you to consider adopting a cautious long-term strategy when it comes to ETH. While it is true that the overall sentiment is positive, it is equally important to remain aware of potential bearish signals that may emerge. By taking a measured approach, we can mitigate risks and make well-informed decisions.
To assist you in your trading journey, I recommend keeping a close eye on key indicators such as trading volume, market sentiment, and price action. These factors can provide valuable insights into the market's sentiment and potential shifts in trends. Additionally, it is crucial to stay informed about any upcoming events or news that may impact ETH's performance.
As we navigate this dynamic market, it is essential to remember that successful trading requires discipline, patience, and a constant reassessment of our strategies. By approaching ETH with caution, we can better position ourselves to capitalize on potential opportunities while managing risks effectively.
In conclusion, while some predict ETH's ascent to new all-time highs, I urge you to adopt a cautious approach. Stay vigilant, analyze the market objectively, and be prepared for potential corrections along the way. By doing so, we can make informed decisions and navigate this exciting market with confidence.

ETHEREUM Pair : ETHUSD ( Ethereum / U.S Dollar )
Description :
Completed Impulsive Waves " 123 " at the Daily Resistance Level creating Corrective Pattern " Triple Top " in Short Time Frame. We have Rising Wedge as an Corrective Pattern in Short Time Frame with " ABCD " Corrective Waves
Entry Precautions :
Wait until it Rejects / Breaks from Resistance Level

ETH Quick dropWhat do i see on ETH:
1) Strong divergence on H1 TF
2) Divergence happened on strong resistance (2067)
3) Quick drop and accumulation (rectangle)
4) Expecting a drop till trendline (Circle)
This is a very good setup, let's see what happen!

"Ethereum Price Targets a 5% Increase, Testing $2,141 High"The price of Ethereum (ETH) is poised for a 5% increase, aiming to test the highest level within the $2,141 range before a potential correction. The trend-breaking tool continues to play a supportive role as a key level, with immediate support standing at $2,029, maintaining its position above the ETH peaks. Similar to Bitcoin, the RSI indicator is on the verge of crossing above the signal line, indicating the potential for an upward move.
However, if sellers take control, Ethereum's price could fall into the supply zone, acting as a trend-breaking tool, confirming a continuation of the southward movement by breaking and closing below the midpoint of this order block at $1,935.
The downturn may extrapolate, causing Ethereum's price to bring the trend-breaking tool back into the supply zone below the support level of $1,864.

ETH Looks Bearish; ☁️ Hovering Over - 24 DowntrendBearish clouds ☁️ linger over the global crypto market in the next 24 hours, signaling a downward trend for Bitcoin, Ether, and altcoins. Only Dogecoin sees a slightly bullish ☀️ break, hinting at upside potential, per ATTMO.
Over a one-week horizon, the ☀️ will return, shining over much of the crypto universe. Altcoins like Avalanche, Ripple’s XRP, Polkadot, and Polygon face lingering bearish clouds. ☁️
Follow us for more crypto weather reports!

ETH Ethereum Price Target If you haven`t bought the dip on ETH:
Then you need to know that Binance, along with its CEO 'CZ,' has confessed to federal charges and committed to settling fines amounting to $4.3 billion.
The crypto exchange “admits it engaged in anti-money laundering, unlicensed money transmitting and sanctions violations"!
The question arises: from where will these substantial funds be derived?
One possible source is Binance's Proof-Of-Reserves, which reportedly exceeds 100%.
Among the tokens impacted is ETH Ethereum.
I've set a short-term price target for ETH Ethereum at $1950.
Looking forward to read your opinion about it!

Ethereum ($ETH) Market Situation
The overall market situation for Ethereum remains consistent. The asset is still trading on an upward trend, closely mirroring Bitcoin's movements.
Presently, ETH is hovering around the resistance zone of $2,090-$2,142. If this resistance is broken, it could enable buyers to quickly elevate the ETH price to new highs, possibly reaching the $2,200-$2,300 range.
On the flip side, if Bitcoin undergoes a correction, it's likely to similarly impact Ethereum's price, potentially driving it down to support levels around $1,852-$1,915, $1,791, $1,705, and even $1,630-$1,672.


Ethereum Price Struggles to Maintain $1,935 Support LevelThe price of Ethereum (ETH) is at risk of losing a crucial support level at $1,935, marking the midpoint of the supply zone that has become a breaking point for the extended bullish trend ranging from $1,864 to $2,004. If the $1,935 level fails to hold firm, it could spell disaster for token holders, with ETH potentially sliding down to the psychological level of $1,800 or, in severe cases, rendering the bullish argument ineffective below $1,753.
Both the RSI and AO indicators support this outlook, trending southward as momentum continues to weaken. On the flip side, increasing buying pressure is substantial enough to demonstrate Ethereum's ability to overcome the supply barrier mentioned above at $2,009, fostering optimism and potentially propelling ETH back onto the upward trend. This could result in a price increase to $2,136, representing a 10% gain from the current level.

Ethereum Price Signals Potential 60% Surge Ethereum is showing signs of a significant breakout, forming an ascending triangle pattern with three higher lows and three nearly equal highs since June 2022. A decisive weekly close above the $2,000 horizontal resistance could trigger a 43% surge to $2,943.
Currently, Ethereum is holding above the support of the Momentum Reversal Indicator (MRI) at $1,936, indicating potential strength. If Bitcoin's price remains stable, Ethereum is expected to rally towards $2,943, facing resistance at $2,539.
While the target is theoretically $2,943, Ethereum could surpass this and reach $3,186, implying a 60% increase. Conversely, a failure to maintain support above $1,936 may lead to a correction towards $1,795. A weekly close below $1,547 would invalidate the bullish scenario, potentially pushing Ethereum down to $1,309.

ETHUSDT Ascending Triangle Pattern!!ETHUSDT (1h Chart) Technical analysis
ETHUSDT (1h Chart) Currently trading at $1973
Buy level: Above $1970
Stop loss: Below $1941
TP1: $1990
TP2: $2030
TP3: $2075
TP4: $2140
Max Leverage 10x
Always keep Stop loss
Follow Our Tradingview Account for More Technical Analysis Updates, | Like, Share and Comment Your thoughts

"Ethereum Maintains Strong Position Above $1,935 Support Level" Ethereum's price maintains its position above the crucial $1,935 support level, which could spell doom for ETH if breached. With the RSI tilting upwards and AO staying in the positive zone, ETH may extend its upward trajectory, recovering above the $2,029 support to follow the upward trend. This could propel the second-largest cryptocurrency by market capitalization to reach its highest point at $2,136. However, in the face of increased selling pressure, Ethereum's price might dip below the $1,935 support. A decisive move below this level would confirm a downtrend, with ETH potentially testing the 25-day or 50-day EMA at $1,892 and $1,806, respectively.
In a more bearish scenario, Ethereum's price could target the 100-day EMA at $1,763, and breaking and closing below this level would invalidate the bullish argument below the $1,753 support.
Read also: Ethereum Price Prediction: Ascending Triangle Pattern Evaluates $4,000 Target for ETH in 18 Months.

ETH trade setup for 15th Nov 2023My setup yesterday was bullish, I only caught a 1:2rr. I didn't see other factors telling me to go bearish.
I was bent on being bullish, so I know and believe, setups can change. So learning to be dynamic is key and not holding to one belief of how the trade should pane out. However, it was a good day.
Today being, 15th Nov 2023, I'll be expecting a bearish scenario as outline on the chart. So I'll be expecting price to enter into the areas highlighted above and also the rectangle above for a reason to go short at specific time.
This is not a trade advice, please dyor

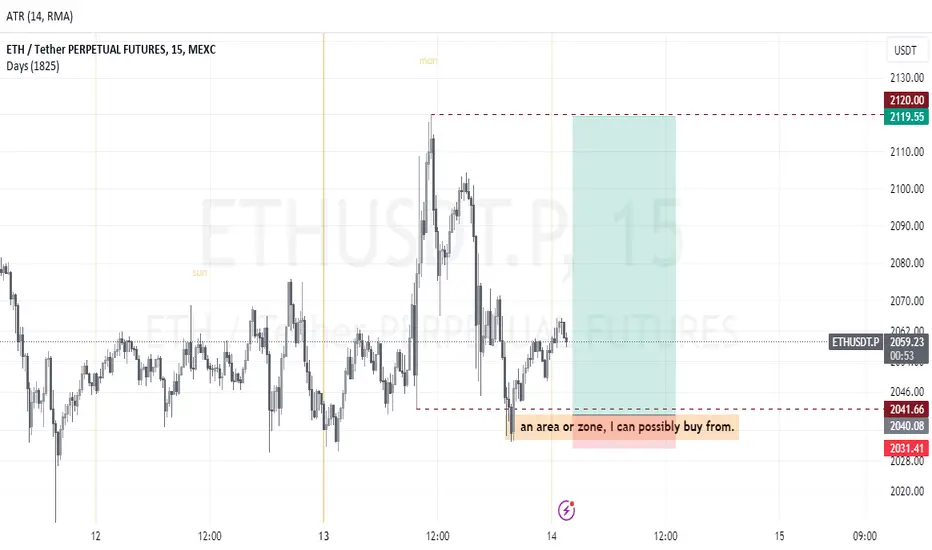
ETH Trade setup for 14th Nov 2023Eth has been bullish compared to BTC, so for me to trade this pair because it refused to make lower low but it also still took out some lows as an inducement to go short however, that's not the actually direction. It's direction is bullish to offset short traders. My possible scenario is for the market to trade into my zone at about 9:30am NY time today, then I can see what price is doing. If there be reasons to go long or short.
ETH: Potential Consolidation Before Targeting $2000ETH might be gearing up for a brief period of consolidation before setting its sights on the $20,000 price mark. This strategic pause can be seen as a part of the natural price journey for Ethereum, allowing it to gather momentum and prepare for the next potential bullish move.

#ETH - thoughts out loud#9Good evening from Ukraine!
Dear colleagues, I am glad to welcome you!
Work plan.
Thank you all for your attention, I wish you success.
Sometimes you win/sometimes you learn.
- thoughts out loud
- thoughts out loud
- thoughts out loud
P.S.
...Think positive

Ethereum's Potential to Reach $2000 TargetEthereum has potential to reach the $2000 target. While it is important to approach such predictions with caution, there are several factors that suggest this milestone could be within reach. This idea aims to provide you with an overview of these factors and encourage you to consider a long position on Ethereum.
1. Market Momentum: Over the past few months, Ethereum has displayed remarkable resilience and has consistently demonstrated an upward trend. Despite occasional volatility, the overall market sentiment towards Ethereum remains positive. This consistent growth is a promising sign for traders who are looking to capitalize on potential long-term gains.
2. Institutional Adoption: Ethereum has gained significant traction among institutional investors, with major financial players showing a growing interest in this digital asset. The increased institutional adoption not only adds credibility to Ethereum but also paves the way for further growth and stability. This trend indicates that Ethereum's potential is being recognized by established financial institutions, which could potentially drive up its value.
3. DeFi and Smart Contracts: Ethereum's blockchain serves as the foundation for a multitude of decentralized applications (dApps) and smart contracts. The explosive growth of the decentralized finance (DeFi) sector has significantly increased the demand for Ethereum, as it remains the preferred platform for most DeFi protocols. As the DeFi space continues to expand and mature, Ethereum is likely to experience increased utility and demand, potentially driving its value higher.
Considering these factors, it is crucial to approach this potential opportunity with a cautious mindset. While Ethereum's growth has been impressive, the cryptocurrency market is inherently volatile, and past performance does not guarantee future results. It is essential to conduct thorough research, assess your risk tolerance, and consider consulting with a financial advisor before making any investment decisions.
If you are interested in exploring a long position on Ethereum, I encourage you to carefully analyze the market, monitor the latest news and developments, and consider setting stop-loss orders to mitigate potential risks. Additionally, staying updated with market trends and being prepared to adapt your strategy accordingly will be key to maximizing your chances of success.
As always, please remember that this idea is not financial advice, and you should conduct your own due diligence before making any investment decisions.
