ETHUSD Buy SetupHi everyone.
As the price has touch the 4H OB, Now I'm waiting for a candle close above the swing high in the 15min TF to confirm a CHoCH in lower TF and then I'll set an order to buy.
Let's see what happens next...
Dear traders, please support my ideas with your likes and comments to motivate me to publish more signals and analysis for you.
Best Regards
Navid Nazarian
ETHUSDT

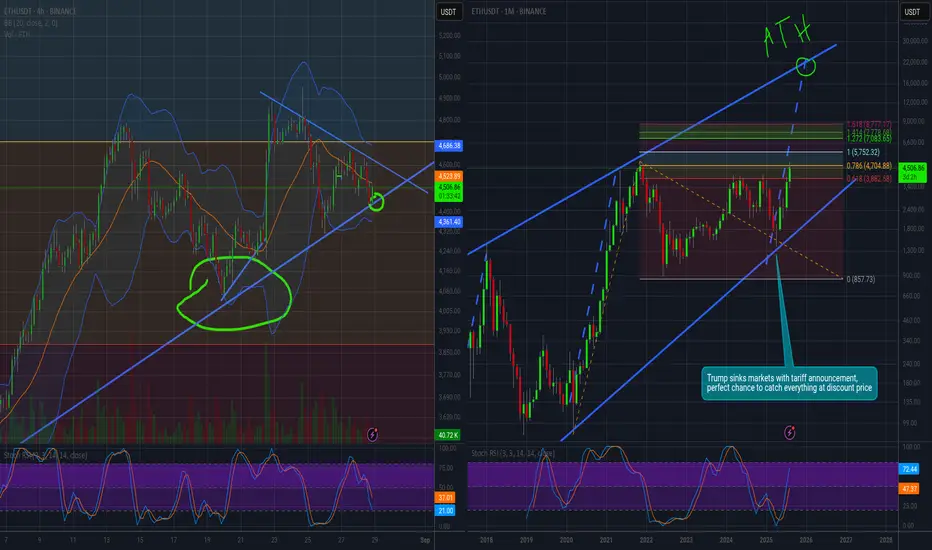
Middle East Tensions, Upcoming Iran War, Crypto FearThe crypto market is more influenced by collective emotions than any other market. The Fear and Greed Index is a clear example of this reality. Under normal conditions, it can indicate whether traders are overly greedy or fearful. However, when regional crises, such as a potential war in the Middle East, emerge, this index alone is not enough, and sudden panic can disrupt all calculations.
Hello✌️
Spend 2 minutes ⏰ reading this educational material.
🎯 Analytical Insight on Ethereum:
Ethereum remains within a very strong bullish channel 📈, yet a potential pullback of at least 14% is possible, with the key support level around $3,800. Breaking this area could signal a shift in the short- to mid-term trend. Traders should watch volume and momentum closely to anticipate potential entries or exits ⚡.
Now , let's dive into the educational section,
War and Its Impact on Market Psychology ⚔️
According to political and logistical analyses, the region is on the verge of a potential conflict involving Iran that could be larger in scale than the previous twelve-day war. Historically, global markets, especially crypto, react sharply to such situations. In the initial days of this type of crisis, strong bearish candles and rapid declines are almost inevitable, as investor fear peaks and liquidity quickly shifts to safe assets. However, historical market data shows that such declines are often temporary, and price recovery can happen relatively quickly, especially as whales and large investors use the opportunity to accumulate assets at lower prices. This scenario is not a certainty but a probable outcome that traders should incorporate into their risk management strategies.
Whales Hunting Fear 🐋
Whales, or large market players, use moments of mass fear to their advantage. By executing sudden buys or sells, they amplify the emotions of retail traders and usually capture the main profits from nervous hands. This is why many beginners sell exactly at market lows.
Retail Trader Psychology 😨
Beginners often react to collective sentiment rather than analyzing the data. When they see everyone selling, they panic and sell too. In reality, whales are often buying exactly at these moments. This cycle repeats frequently in the market.
Safe Havens During Crisis 🛡
When negative news and political uncertainty dominate, markets tend to move toward safe assets. In crypto, Bitcoin and stablecoins play this role. The higher the fear, the stronger the flow into these assets.
Practical TradingView Tools 📊
To avoid reacting emotionally, using TradingView tools is essential. One of the most important indicators is Volume Profile , which shows the price levels with the highest traded volume. When you see a significant spike in a specific range, it can indicate whale activity.
On-Balance Volume (OBV) helps determine whether price movements are driven by smart money or pure hype.
Relative Strength Index (RSI) is another key tool. When RSI approaches oversold levels during collective panic, it often signals an attractive entry point for whales.
Combining these tools provides practical insights. For example, when RSI is low and Volume Profile shows high activity, the probability of whales exploiting fear spikes is high. Professional traders use these tools not just for price analysis but to assess market sentiment.
TradingView tools allow you to make data-driven decisions instead of emotional reactions. This makes your analysis more valuable to site editors, as it offers both psychological insight and actionable methods.
5 Trading Tips 🔑
never let news of war or political crises force impulsive decisions, as emotional reactions during fear peaks are often the costliest mistakes.
always keep a portion of your capital in stablecoins or safe assets so you can take advantage of buying opportunities during sharp market drops.
instead of focusing on rumors, rely on TradingView tools and data to gain a clear view of money flow and real market positions.
reduce trading volume and focus on risk management during crises, as the market can move against expectations within minutes.
understand that steep drops caused by collective fear are often short-lived, and those who patiently
✨ Need a little love!
We pour love into every post your support keeps us inspired! 💛 Don’t be shy, we’d love to hear from you on comments. Big thanks, Mad Whale 🐋
📜Please make sure to do your own research before investing, and review the disclaimer provided at the end of each post.

Bull Pennant Almost OverHere's hoping the trend line holds.
If the trend continues we could hit a new price target of 5752 according to trend-based fibonacci extension with 2020's covid impulse dip as the starting point.
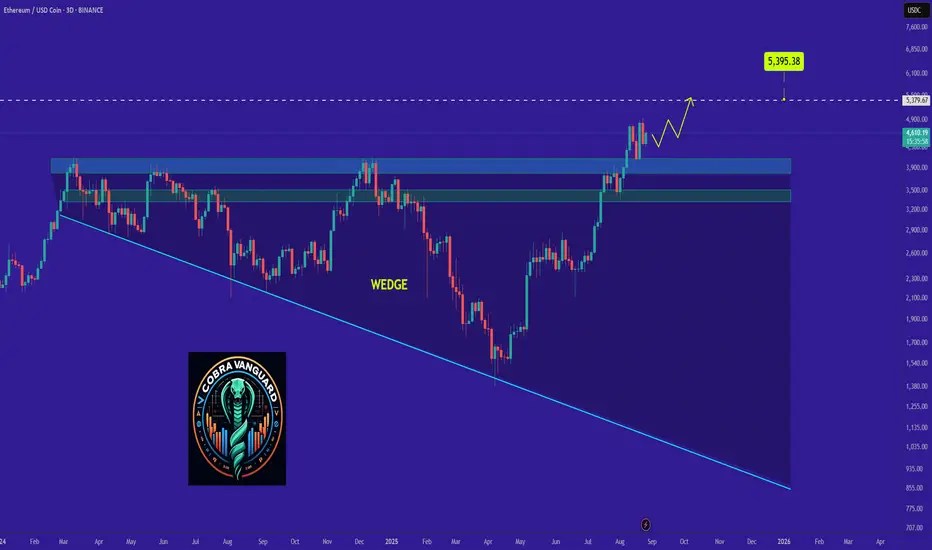
Why ETH Remains Bullish and Its Next Potential Move !As discussed in the previous analysis, the price has finally broken the wedge, and now, with a slight pullback, it could reach above $5k.
PREVIOUS ANALYSIS
Why ETH Ethereum Could Surpass BTC Bitcoin’s Market CapIf you haven`t sold the previous top on ETH:
Now why Ethereum Could Surpass Bitcoin’s Market Cap:
1. Ethereum’s Network Upgrades Drive Value
Ethereum has undergone significant upgrades, most notably the Merge, transitioning the network from Proof-of-Work (PoW) to Proof-of-Stake (PoS). This dramatically reduced ETH’s issuance rate and energy consumption, positioning Ethereum as a more sustainable and “deflationary” asset. With upcoming upgrades like Sharding, Ethereum is set to become faster, cheaper, and more scalable—critical factors for adoption in decentralized finance (DeFi) and Web3 applications.
2. DeFi and Smart Contract Dominance
Ethereum hosts the majority of DeFi protocols, NFT marketplaces, and decentralized applications (dApps). The network effect is strong: developers and users are deeply entrenched in Ethereum, creating high demand for ETH for transaction fees (gas) and staking. As DeFi continues to grow, ETH’s utility and demand could rise exponentially, putting upward pressure on price.
3. Institutional Interest and Adoption
Institutional interest in Ethereum has increased substantially. Products like ETH ETFs and staking services are attracting large-scale capital inflows. Unlike Bitcoin, which is often treated as digital gold, Ethereum has a dual narrative: store of value and programmable money. This unique proposition makes it appealing not only to investors but also to corporations exploring blockchain solutions.
4. Scarcity and Deflationary Pressure
Post-Merge, Ethereum implemented EIP-1559, which burns a portion of transaction fees, effectively reducing ETH supply over time. During periods of high network activity, ETH becomes increasingly deflationary. This contrasts with Bitcoin, whose fixed supply doesn’t adjust dynamically to network usage, giving Ethereum a potential advantage in a high-demand scenario.
5. Macro Trends and Crypto Evolution
As crypto matures, utility and adoption increasingly dictate valuation. Ethereum’s ecosystem—spanning DeFi, NFTs, DAOs, and enterprise solutions—is far more versatile than Bitcoin’s. This could make ETH the go-to platform for digital finance, giving it an edge in both market capitalization and long-term relevance.
ETH 1H Analysis – Key Triggers Ahead | Day 4💀 Hey , how's it going ? Come over here — Satoshi got something for you !
⏰ We’re analyzing ETH on the 1-hour timeframe timeframe .
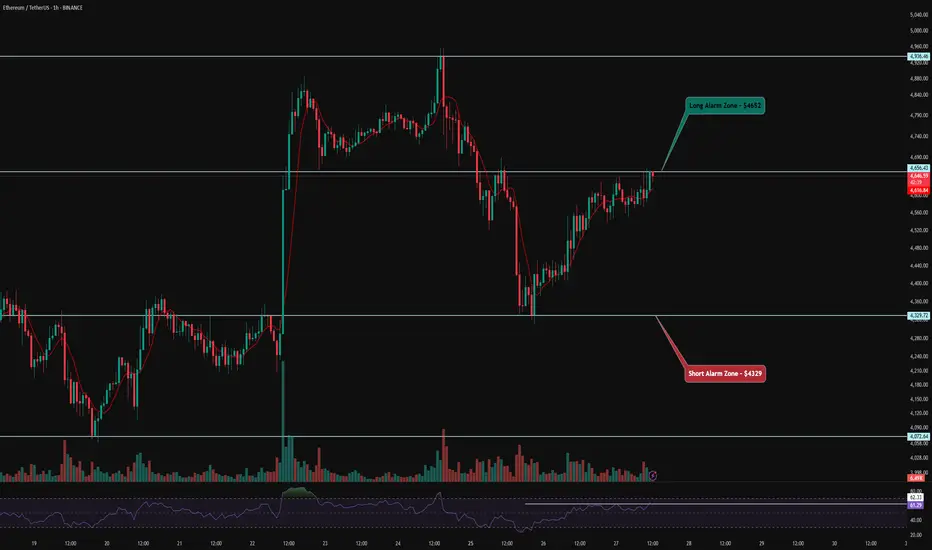
👀 On the 1H timeframe for Ethereum, we can observe that ETH is currently moving inside a V-pattern. If the price breaks out and consolidates above the neckline of this pattern, we could see a strong bullish continuation. Checking ETF flow data also shows heavy accumulation of Ethereum, which supports the bullish bias.
⚙️ The key RSI level for ETH sits around 62. Once the RSI crosses above this threshold, Ethereum has the potential to break the neckline of the V-pattern and push into the overbought zone, signaling further upside momentum.
🕯 Additionally, the volume, candle size, and number of green candles are increasing as ETH approaches this resistance. With rising trading volume, ETH could target higher price levels and potentially confirm a new all-time high.
🪙 On the 1H BINANCE:ETHBTC chart , we see a significant resistance level around 0.04274. A breakout above this zone with strong volume and volatility would provide an additional confirmation for a long position in Ethereum.
🔔 Our long setup alert zone is placed around $4652, while the short setup alert zone is positioned near $4329.
❤️ Disclaimer : This analysis is purely based on my personal opinion and I only trade if the stated triggers are activated .
Ethereum Eyes $5K Breakout — Is a New ATH Coming?Ethereum is approaching its major resistance zone near $5,000, showing strong bullish momentum after bouncing off the supportive trendline. The recent candle confirms a macro bullish reversal.
If CRYPTOCAP:ETH breaks and closes above the resistance zone, it could open the path toward new all-time highs. As long as it holds above $2,900–$3,000, the structure remains bullish.
DYOR, NFA

Ethereum · Crash or Higher?I see Ethereum and I look at Ethereum and all I see is rising prices. I can see the potential for a retrace and the bearish signals short-term but still, all I see is rising prices and a rising trend, it will continue.
Here we have a very strong rising trend and it seems Ether is peaking. There was a high 10 days ago and now we are seeing a double-top. Yesterday was a new all-time high and the candle ended with a small real body and large upper wick. This can be read as bearish but also as resistance being challenged.
Trading volume is standard for a continuation. All general signals are bullish. The trend is bullish. The market tendencies are bullish. The sentiment is bullish, etc.
Between May and July we had a period of sideways action, two months. Something similar can happen but instead of two months, two weeks or four weeks. I believe this one will be shorter than the last.
Prices can drop just to recover the next day. Prices can continue rising without a drop. It is hard to predict the very short-term.
Ethereum is bullish on all timeframes and no signals point to a top being present.
The day with high bearish volume 14-August was matched by a day of high bullish volume 22-August. So the market remains positive on the upside. The market bias continues bullish.
Ethereum is bullish long-term, and we expect to continue rising as long as the action is happening above $4,100. If it moves below, we will rethink.
Thank you for reading.
Namaste.

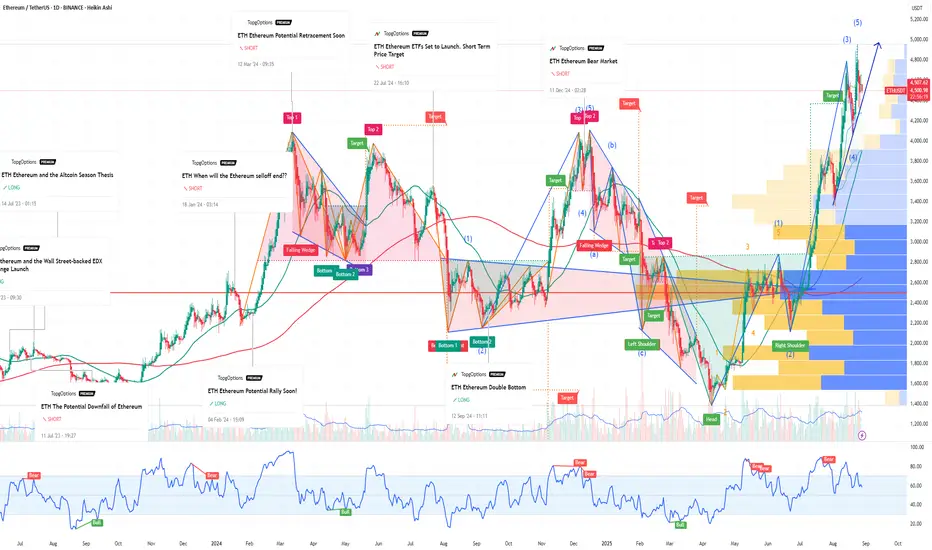
Zoom out Ethereum $ETHEthereum seems to be repeating the process that started the 2016-2017 mega run.

#ETH/USDT#ETH
The price is moving within a descending channel on the 1-hour frame and is expected to break and continue upward.
We have a trend to stabilize above the 100 moving average once again.
We have a downtrend on the RSI indicator that supports the upward move with a breakout.
We have a support area at the lower boundary of the channel at 4300, acting as strong support from which the price can rebound.
We have a major support area in green that pushed the price upward at 4330.
Entry price: 4544.
First target: 4646.
Second target: 4830.
Third target: 4995.
To manage risk, don't forget stop loss and capital management.
When you reach the first target, save some profits and then change your stop order to an entry order.
For inquiries, please comment.
Thank you.

ETH 4H Analysis – Key Triggers Ahead | Day 3💀 Hey , how's it going ? Come over here — Satoshi got something for you !
⏰ We’re analyzing ETH on the 4-hour timeframe timeframe .
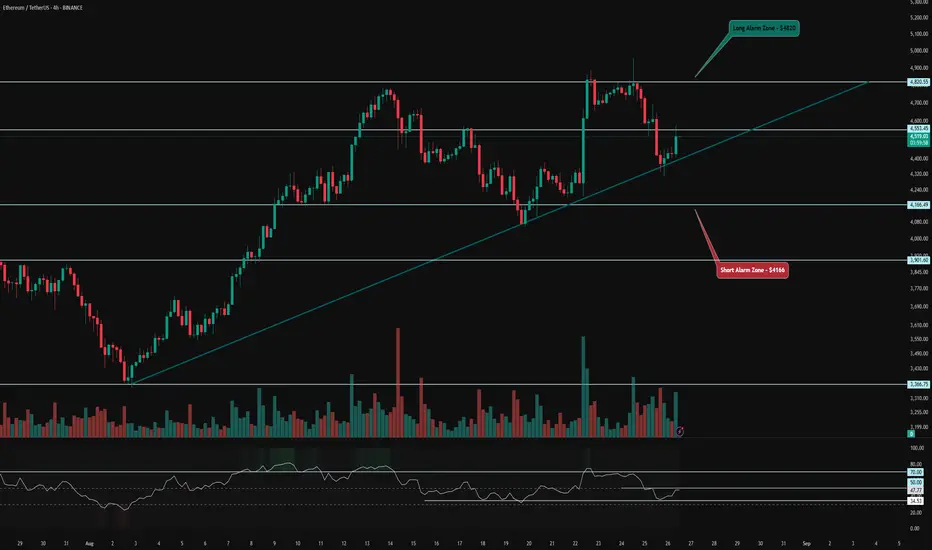
👀 We’re observing the 4-hour Ethereum chart, and ETH is trading within a 4-hour box. The ceiling of this box is at the $4,820 level, and the floor is at $4,166. The floor was once faked out, showing a reaction toward the ceiling but got rejected from this area. Buyer makers have kept the price near the midline of the box. A trendline has been drawn from the box’s lower level, and each time ETH hits this trendline, it has shown an upward reversal. Breaking and holding above the midline of the box could push ETH toward the ceiling, with the midline acting as an early trigger .
⚙️ Key RSI levels are at 50 and 70. With increased volatility, long trades on Ethereum could drive it upward, and crossing the 50 level could push ETH’s price into the upper part of the box, giving it another chance to test breaking the 70 level and setting a new high. If rejected and this scenario fails, ETH could experience a deep correction, as it hasn’t entered oversold territory or seen a deep correction for several days .
🕯 The size and volume of green candles have increased compared to red candles, which prevents a deep correction in ETH. However, yesterday in ETFs, people bought a significant amount of Ethereum, and this weakness in the corrective trend suggests that ETH has a stronger tendency to rise and climb .
🪙 We’re observing the 4-hour ETH/BTC index chart, and ETH has a strong support level against Bitcoin at 0.03972, where increased volume triggered a reversal. There’s also a resistance level at 0.04275, and breaking this level with increased volume and RSI entering overbought territory could confirm a long trade for ETH .
🔔 Our trading alarm zones for ETH positions are at $4,820, where breaking this level could signal a long position. An early trigger for a long trade could be at $4,553, where breaking this level increases the likelihood of breaking the ceiling of the 4-hour box. The short trade alarm zone is at $4,166, where breaking this level could initiate a deep correction for ETH .
❤️ Disclaimer : This analysis is purely based on my personal opinion and I only trade if the stated triggers are activated .
ETHUSDT ETHEthereum has shown bullish strength in recent weeks and has formed several positive patterns. I believe it will target the $8,500 level after breaking the top at $4,900.

ETHUSDT: Trade 15 min Next TradeContinuing the previous trade we had in Ethereum, we are now trading this currency downwards. May you be profitable and successful.

ETHUSD🔎 Chart Setup
ETH/USD 1H → Bearish flag = continuation pattern AB=CD
ETH Dominance (D) → Also breaking flag = confirms weakness in ETH vs other alts/majors
📊 Trade Plan
⚠️ Manage risk strictly (crypto volatility is brutal):
Entry: On breakdown retest of the flag support line 🟥
Stop Loss (SL): Just above flag resistance
rofit (TP):
🎯 TP1 (1:1 RR) → Secure partial profits (50% book)
🎯 TP2 (1:2 RR) → Let rest run, trail SL
💡 Risk Management
Max 1%–2% account risk per trade ⚖️
Always use hard stop, don’t widen 🚫
Partial booking keeps you safe + confident 🛡️

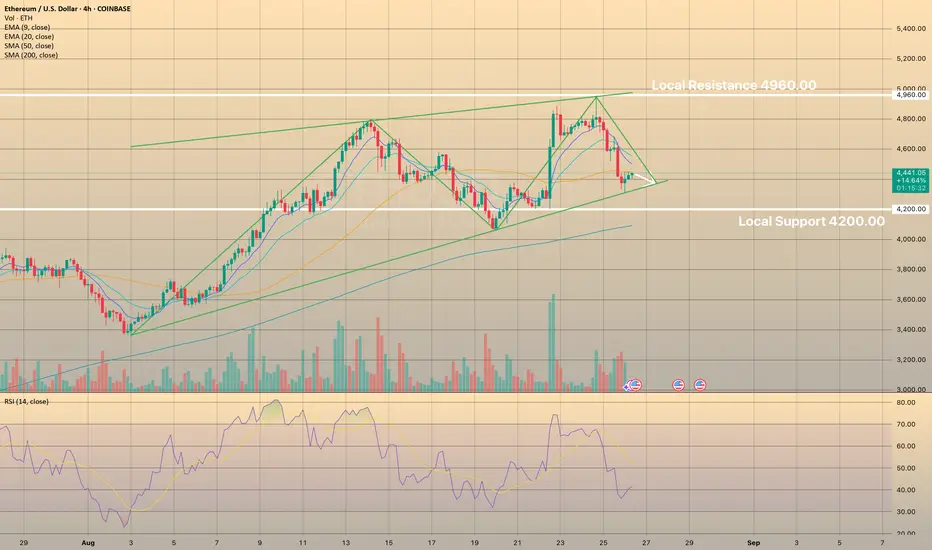
Quick Update: EthereumEthereum is stuck between the trendline and the 200-hour moving average. These two levels will likely guide short-term moves ahead of the GDP and PCE data. Watch for a breakout in either direction to set the intraday trend.

ETH slides post-ATH, Network fundamentals stay strongETH Slides Post-ATH, Network Fundamentals Stay Strong
Altcoins slid as Bitcoin and Ethereum retreated, with ETH dropping 7% to $4,313 despite recent highs and strong inflows. Market cap fell by $200B.
BitMine Immersion Technologies seized the dip, buying 4,871 ETH for $21.3M, boosting its holdings to 1.72M ETH (~$7.5B), about 40% of all corporate ETH reserves. Its crypto assets rose by $2.2B in a week, with NAV per share hitting $39.84, reinforcing its lead in ETH treasuries.
Ethereum surged 200% since April lows, but network activity tells the bigger story. On-chain metrics show strong fundamentals: 75% of revenue from priority fees and MEV, $156B in stablecoins (+14% since July), and ~$6B daily L1 settlements. L2 adoption is also accelerating, led by Coinbase’s Base.
Despite structural growth, volatility persists: ETH plunged $550 after a new ATH, liquidating $110M in leveraged positions. Currently at $4,445 (-5.5% daily, +5.3% weekly), ETH still outperforms the broader market.
The Ethereum Foundation is pushing its Trillion Dollar Security initiative to enhance wallet and contract safety, aiming for long-term sustainability.
ETHUSDT: Trade 15 min FractalsThe Ethereum chart is growing up to the specified point and a small long trade can be taken, after which the downward trend will continue until the observed area, of course, it remains to be seen how it will close in that area.

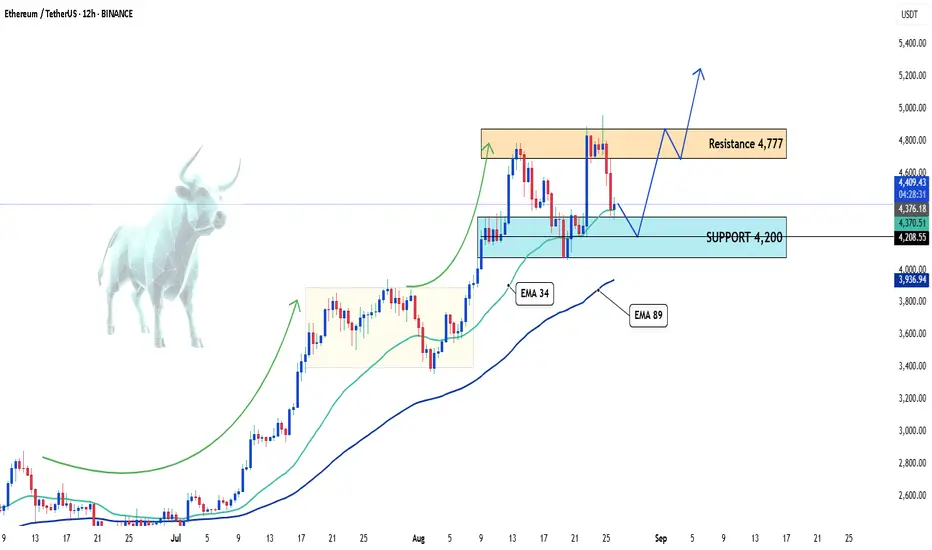
Latest Update on ETHUSDTHello, my wonderful friends! What are your thoughts on BINANCE:ETHUSDT ?
Recently, ETHUSDT has shown a strong correction after reaching a high of nearly 4,777 USD. From this point, ETH has slowed down and pulled back, but the key support level at 4,200 USD is holding up, helping the price bounce back in the short term.
We are seeing ETH trading above the EMA 34, with both EMA 34 and 89 acting as crucial dynamic support zones. If the price maintains stability above this support, the chance to push towards the 4,777 resistance level could open again.
My view is bullish. What about you? Do you think ETHUSDT will continue to break above 4,777, or will it struggle at this level? Feel free to share your thoughts!
Ethereum New Analaysis (4H)Now, Ethereum may face a serious correction after making one more high. So pay close attention to the $4900–$5000 zone.
For this bearish scenario to play out, the SWAP zone on the 12H or daily timeframe must be broken and price must hold below it.
A daily candle closing above the invalidation level would nullify this analysis.
For risk management, please don't forget stop loss and capital management
When we reach the first target, save some profit and then change the stop to entry
Comment if you have any questions
Thank You

AltcoinPioneers | Etherium Daily Analysis Day1BINANCE:ETHUSDT
AltcoinPioneers | Etherium Daily Analysis Day1
👋 Welcome to Altcoin Pioneers Group TRADING ™!
Let’s analyze Etherium. Let’s explore the reason behind it and what Bitcoin’s next move might be.
It features a bearish pennant pattern 🔻, marked with red lines ❌, indicating a potential downward trend 📉.
The price rose initially ⬆️, forming higher highs and lower lows, before a sharp decline ⬇️.
A target price 🎯 is indicated around 4,458.85 USDT 💰, suggesting a possible continuation of the downward movement after the breakout 🚪.
The current price is near this target level 📍.

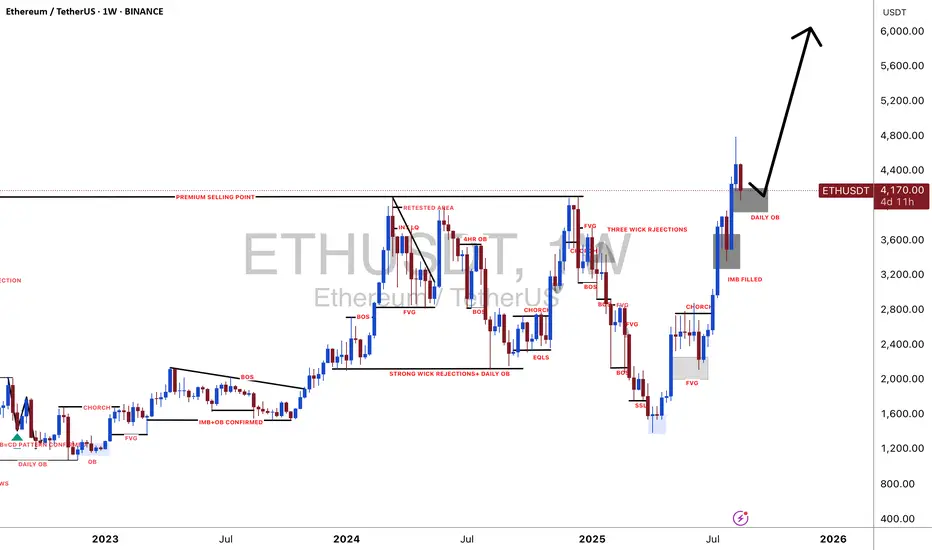
#ETHUSDT: $6000 Is The Next Target!!As we have been predicting since last one year or so, the ETH has reached almost $5000, now we can expect price to continue rising since it already made the correction. Target is $6000 this is swing target. Good luck and trade safe.
Team Setupsfx
ETH 1H Analysis – Key Triggers Ahead | Day 2💀 Hey , how's it going ? Come over here — Satoshi got something for you !
⏰ We’re analyzing BTC on the 4-hour timeframe timeframe .
👀 On the 1-hour Ethereum chart, after last night’s rally, ETH hit a new all-time high but was rejected and is now moving downward while maintaining its uptrend.
⚙️ Key RSI levels are 50 and 30. Breaking these levels with high volatility could trigger ETH’s next move in either direction.
🎮 Fibonacci drawn from the Jackson Hole event to ETH’s all-time high shows the 0.61 level as a key zone. Losing this could lead to a deeper correction. The 0 Fib level at $4,852 acts as a breakout zone for long trades.
🕯 Red candles are relatively large, but ETH’s pullback is milder than Bitcoin’s. It’s currently at a decision-making zone with a new structure forming.
🪙 ETHBTC pair shows whales are undecided after last night’s drop. The alarm zone for the ETH/BTC pair is at 0.04218; a break above could spark a new bullish leg for ETH.
🔔 ETH’s alarm zone for longs is at $4,852.52. A breakout here with increased volatility and volume could push ETH to higher highs.
❤️ Disclaimer : This analysis is purely based on my personal opinion and I only trade if the stated triggers are activated .

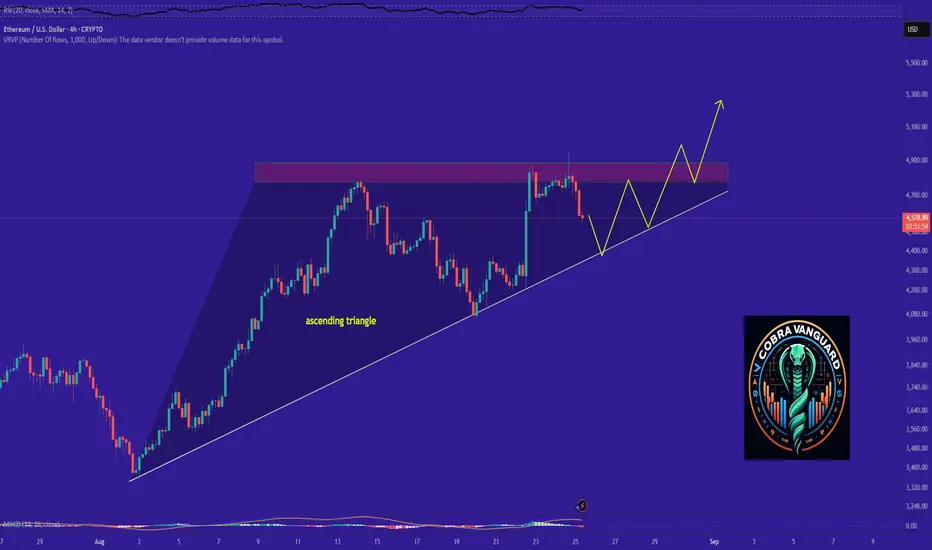
ETH is bullish now and many Traders don't see it !!The price on the 4h timeframe is within an ascending triangle, which can be promising. If the price breaks this pattern with bullish candles, it could easily rise by the distance of AB=CD .
Best regards CobraVanguard.💚