ETH - ATH when?Looks likely but shall move on the moves on the chart anticipated! As shown! Lets see how it moves out!
ETHUSDT
ETHUSDT - IdeaPrice consolidating within this channel since ETH made ATH, could it be possible that we see a new high next week?
The speculators would like to think we're going to 10k but realistically, what is everyone's EOY target for ETH?
Do keep in mind September has been a bad month for ETH since inception, can it be different this time around?
"ETH's price history reveals a persistent and often brutal September pattern. Since 2016, ETH gains in August are regularly wiped out in September. In 2017, ETH rallied 92% in August, then dropped -21.65% in September, after China announced a ban on ICOs."

ETH 1H Analysis – Key Triggers Ahead | Day 1💀 Hey , how's it going ? Come over here — Satoshi got something for you !
⏰ We’re analyzing BTC on the 4-hour timeframe timeframe .
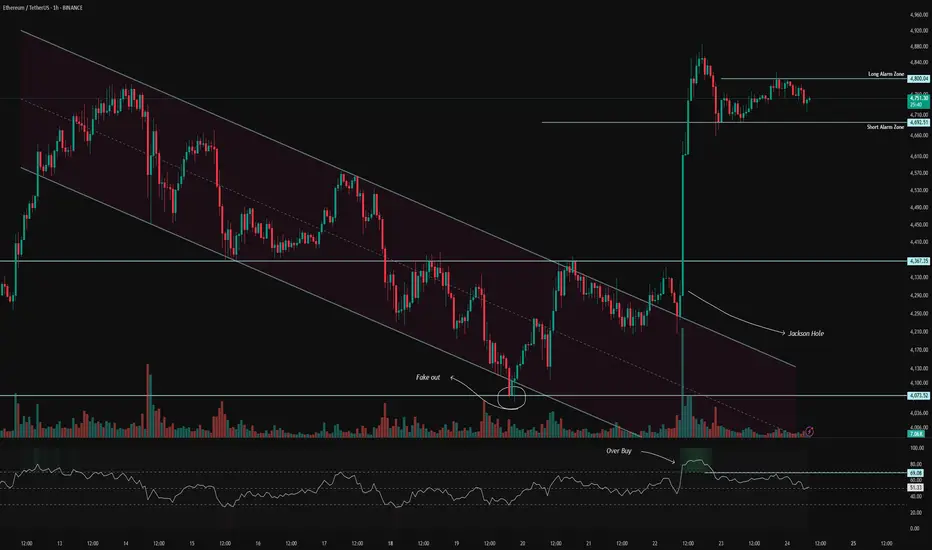
👀 On the 1-hour timeframe of Ethereum, we can see that it had a descending channel. It faked out once at the bottom of the channel and then ranged at the top of the channel. Before the Jackson Hole event, it broke out of the channel, and with the Jackson Hole event, it pumped. The price jump Ethereum experienced was remarkable. That’s why we couldn’t open a position on Ethereum .
⚙️ The key zone at 70 can be a good volatility level for long trades, and the key zone at 50 can be a volatility level for short trades .
🕯 Looking at the candle sizes, during the Jackson Hole event the green candles became bigger, and excellent volume entered Ethereum during this event .
🪙 Ethereum to Bitcoin pair , we can see that with breaking the marked zone, Ethereum compared to Bitcoin can gain more value and move upwards again .
🔔 Ethereum alarm zone for long positions is $4800. For short positions, it’s better not to set an alarm because the trend is bullish. The pair against Bitcoin is also bullish, and Tether dominance has faced a heavy rejection from its top .
❤️ Disclaimer : This analysis is purely based on my personal opinion and I only trade if the stated triggers are activated .
Ethereum Remains Technically Solid Bullish Background ConfirmedOverall Market Sentiment
Looking at TipRanks data, ETH is receiving Strong Buy signals on the daily, weekly and monthly timeframes, with a strong dominance of "Buy" on the moving averages (12 Buy) and moderately positive dynamics on the oscillators
Price indicators (EMA20, EMA50, EMA100, EMA200) are significantly below the current price, which confirms a stable uptrend.
Key support and resistance levels
Support:
around $4,030-4,100, where an important foundation has been built in case of a reverse movement.
Resistance:
The previous zone of $4,300-4,350, where the price has repeatedly encountered difficulties.
A confident breakout is a possible path to $4,576 (the maximum of the 24-hour range) and further up.
Technical indicators and signals
Daily and weekly timeframes — "Strong Buy".
RSI ~55–56 (Buy), MACD — Buy. Other oscillators give a neutral signal.
Trade Plan from Binance (ETH/USDT):
Current price is around $4,336, below EMA7 ($4,398), but above EMA25 ($4,044) — confirms the medium-term bullish trend.
Possible rebound from support $4,278–4,300, targets — $4,398, $4,576 and then $4,781 upon breakout. Risk — fall to $4,043 upon breakout of EMA25.

#ETH/USDT Breaks Below Recent Triangle Structure !#ETH
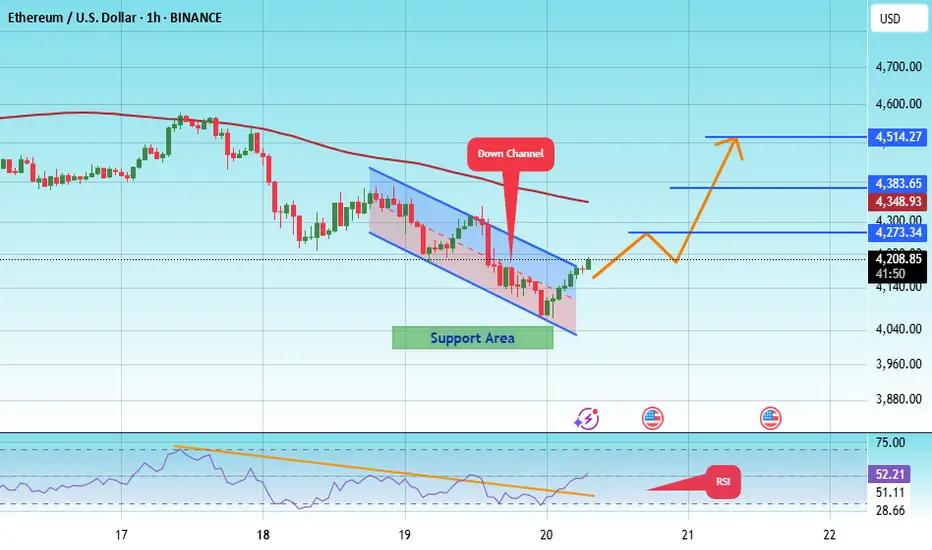
The price is moving within an ascending channel on the 1-hour frame, adhering well to it, and is on track to break it strongly upwards and retest it.
We have support from the lower boundary of the ascending channel, at 4040.
We have a downtrend on the RSI indicator that is about to break and retest, supporting the upside.
There is a major support area in green at 4000, which represents a strong basis for the upside.
Don't forget a simple thing: ease and capital.
When you reach the first target, save some money and then change your stop-loss order to an entry order.
For inquiries, please leave a comment.
We have a trend to hold above the 100 Moving Average.
Entry price: 4203.
First target: 4273.
Second target: 4383.
Third target: 4514.
Don't forget a simple thing: ease and capital.
When you reach the first target, save some money and then change your stop-loss order to an entry order.
For inquiries, please leave a comment.
Thank you.
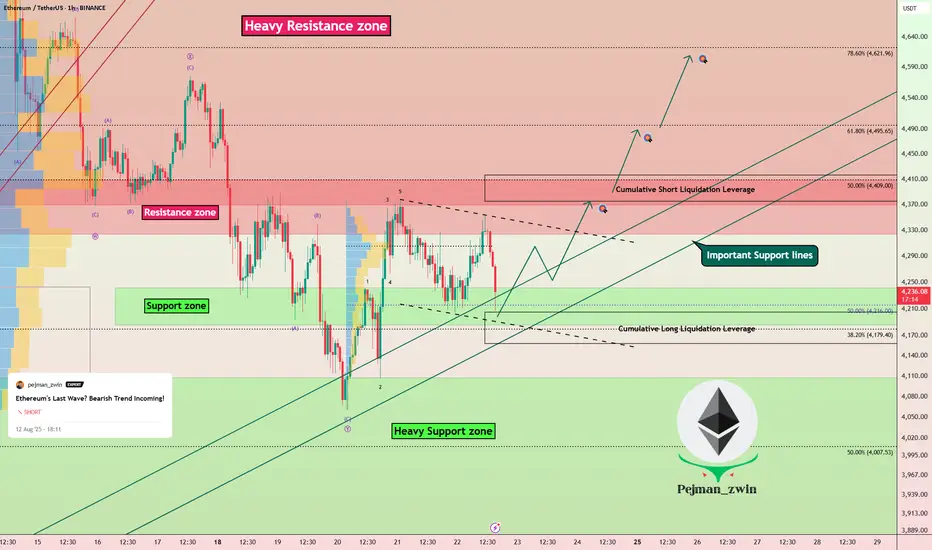
Ethereum Correction Ending? Next Bullish Wave Loading!In the previous idea , I was able to find the Ethereum price top at $4,788 . The question is, has the Ethereum correction begun, or is there still hope for the creation of a new All-Time High(ATH)?
Ethereum ( BINANCE:ETHUSDT ) is currently trading near the Support zone($4,240-$4,186) , Cumulative Long Liquidation Leverage($4,205-$4,158) , and important Support lines .
In terms of Elliott Wave theory , it seems that Ethereum has completed a corrective wave . The corrective wave has a Double Three Correction structure(WXY) . If the Resistance zone($4,410-$4,324) and Cumulative Short Liquidation Leverage($4,416-$4,375) are broken, we can confirm the end of the corrective wave .
I expect Ethereum to start rising from important support lines and rise to at least $4,373 .
Second Target: $4,484
Third Target: $4,607
Stop Loss: $4,097
Note: Today's Fed Chair Powell Speaks can create excitement in financial markets, especially crypto.
Please respect each other's ideas and express them politely if you agree or disagree.
Ethereum Analyze (ETHUSDT), 1-hour time frame.
Be sure to follow the updated ideas.
Do not forget to put a Stop loss for your positions (For every position you want to open).
Please follow your strategy and updates; this is just my Idea, and I will gladly see your ideas in this post.
Please do not forget the ✅' like '✅ button 🙏😊 & Share it with your friends; thanks, and Trade safe.
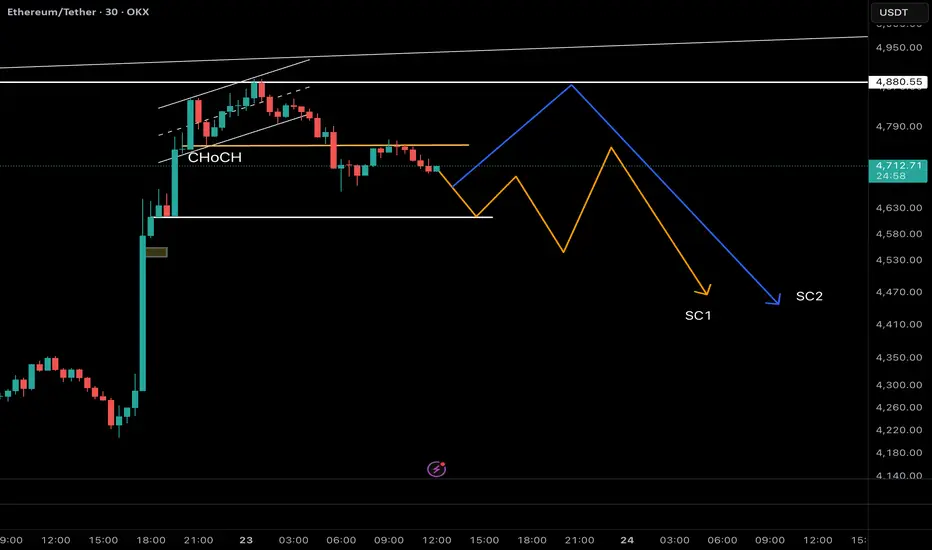
Ethereum Update: CHoCH Confirmed – Waiting for BOS & Wave C! As mentioned in my previous Ethereum analysis, ETH has completed its 5-wave impulsive rally and is currently inside wave B of a corrective ABC structure. Wave B often breaks above the wave ⑤ top to trap liquidity before a sharp wave C sell-off.
📊 Latest Price Action (30m TF):
• ETH has already shown a CHoCH by breaking the first key support at $4,753 and retesting it.
• The next crucial support lies at $4,613. If this level also breaks, it would confirm a BOS (Break of Structure) and strengthen the bearish case.
🔀 Two Possible Scenarios from Here:
1. Price retests the broken $4,753 level as resistance → then resumes the downtrend.
2. A deeper pullback toward $4,845 (acting as a left shoulder liquidity zone) → before the real wave C decline begins.
🎯 Trading Strategy:
• Wait for confirmation of BOS at $4,613.
• Once confirmed, look for bearish entry triggers (CHoCH / MSB) on lower timeframes.
• First targets: $4,100 → $3,800.
• Stop-loss invalidation above the swing high at $4,845 to maintain strict risk control.
⚠️ Remember: patience is key. Don’t get trapped in wave B’s fake breakouts — let the structure confirm wave C.
👉 Like & Follow to stay updated as we track ETH’s potential wave C move step by step!
Check for support near 4302.41-4372.72
Hello, traders!
Follow us to get the latest updates quickly.
Have a great day!
-------------------------------------
(BTC.D 1M chart)
For an altcoin bull market to begin, the price must either fall below 55.01 and hold or continue its downward trend.
(USDT.D 1M chart)
I believe that USDT dominance must remain below 4.91 or continue its downward trend for the coin market to continue its upward trend.
The maximum decline in 2025 is expected to be around 2.84-3.42.
After that, the coin market is expected to enter a bear market with an upward trend.
------------------------------------
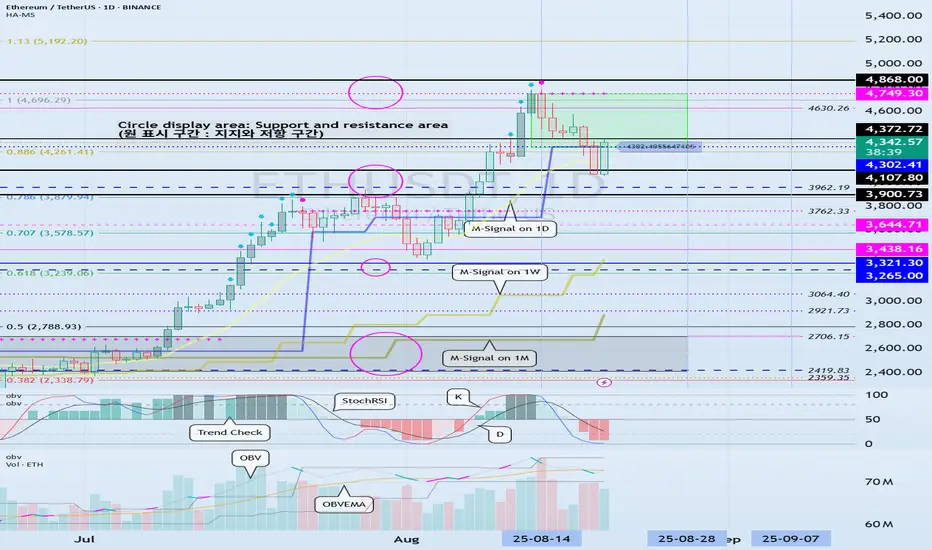
(ETHUSDT 1D chart)
It touched the previous all-time high (ATH) range of 3900.73-4107.80 and is showing an upward trend above 4302.41.
Therefore, we need to check whether it can find support around 4302.41-4372.72.
To continue the step-up trend, it's expected to rise above 4749.30.
-
When a new candlestick is formed, a low trend line is expected to form, consolidating the trend line as shown below.
Therefore, the key question is whether the price can rise along the rising channel after the volatility period around August 28 (August 27-29).
-
The 4302.41-4749.30 range represents a high-boundary zone, requiring a short and quick response when trading.
Therefore, if the price finds support near 4302.41 and rises, it would be wise to develop a trading strategy based on the assumption that the first sell-off will occur around 4749.30.
For the uptrend to continue, rising above 4749.30,
- the StochRSI indicator must remain upward with K > D,
- the OBV must rise above the High Line and remain upward,
- the TC (Trend Check) indicator must remain upward. (Preferably, it should show an upward trend above 0.)
If the above conditions are met, I believe the uptrend is likely to continue.
-
If the price falls below 4302.41,
1st: 3900.73-4107.80
2nd: M-Signal on the 1W chart
We need to check for support near the 1st and 2nd levels above.
-
The basic trading strategy is to buy in the HA-Low ~ DOM (-60) range and sell in the HA-High ~ DOM (60) range.
However, if the price rises from the HA-High to DOM(60) range, it is likely to exhibit a step-like upward trend, while if it falls from the HA-Low to DOM(-60) range, it is likely to exhibit a step-like downward trend.
Therefore, the basic trading strategy should be a segmented trading strategy.
If you purchase a new position because the price appears to be supporting the HA-High to DOM(60) range, you should execute the trade quickly and with short-term responses.
Otherwise, if the price falls below the HA-High indicator, it is likely to decline until it meets the HA-Low or DOM(-60) indicator.
-
Thank you for reading to the end.
I wish you successful trading.
--------------------------------------------------
- This is an explanation of the big picture.
(3-year bull market, 1-year bear market pattern)
I will explain in more detail when the bear market begins.
------------------------------------------------------
Ethereum Elliott Wave Analysis: The Bull Trap Before Wave C!As mentioned in my previous two analyses, Ethereum rejected the $4,740 high and dropped to the $4,050 support zone, where it bounced exactly as projected.
From an Elliott Wave perspective, ETH has already completed a 5-wave impulsive structure and is now inside a corrective ABC phase. At the moment, price action is developing within wave B. Historically, wave B has the tendency to break above the top of wave ⑤, creating a bull trap and sweeping liquidity before the real wave C sell-off begins.
📉 What does this mean for traders?
Wave C is usually sharp, aggressive, and offers great risk-to-reward opportunities on the short side. But instead of rushing into shorts, the smart play is to wait for confirmation.
🎯 Trading Strategy:
1. Allow wave B to complete – watch for a liquidity grab above the $4,840–$4,800 zone.
2. Look for a CHoCH (Change of Character) / market structure break on lower timeframes (4H / 1H) as your entry trigger.
3. Enter short after confirmation, targeting the $4,100 → $3,800 zones first, with potential extension lower depending on momentum of wave C.
4. Place invalidation above the recent swing high to keep risk controlled.
⚡ This is a high-probability short setup forming, but patience and timing are crucial — don’t get trapped in wave B’s fake breakout.
👉 Follow for updates as we track the confirmation of wave C and refine the short targets!

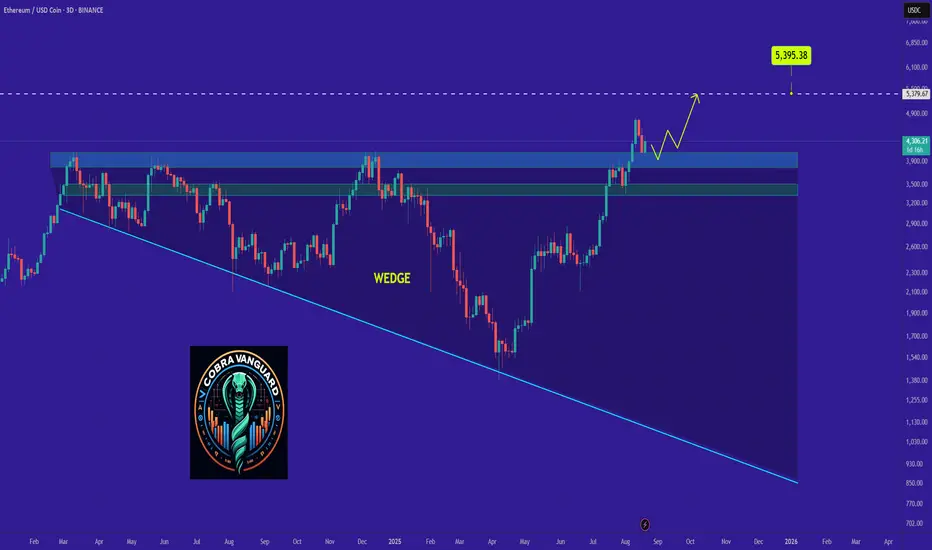
Its Ethereum season \ Dont sleep on $ETHIts Ethereum season \ Dont sleep on CRYPTOCAP:ETH
The major resistance line that has remained unbroken for more than 3.5 years is now functioning as a support line.
Corrective waves that form in a short period of time will now only serve as fuel for another parabolic run.

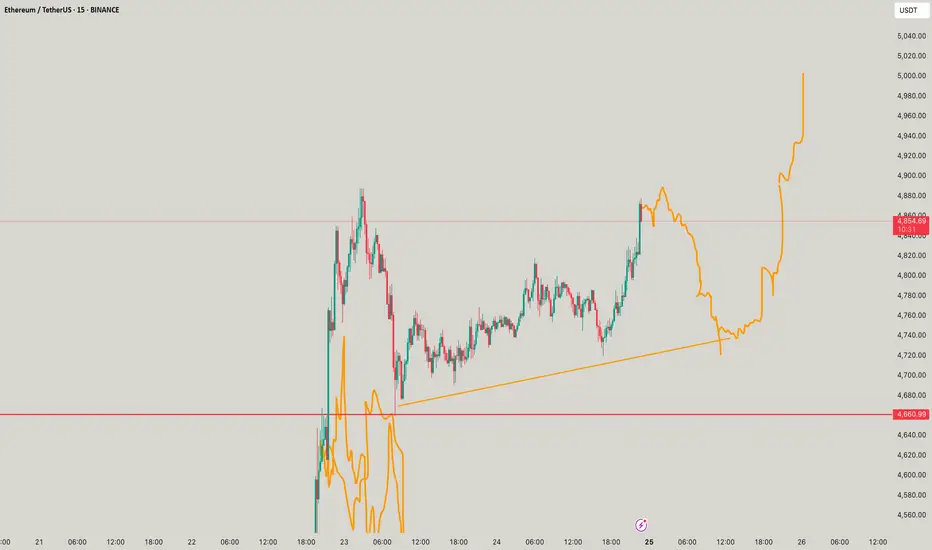
Ethereum Hits a New All-Time High · $5790 Next Followed by $8513Ether is now on a path to a new all-time high and this week is hyper-bullish, as bullish as it gets.
Notice the lower wick on the current session; the week started negative and as it reaches its end, it turns positive. The action is happening at the top of the candle and this means we will see green Saturday, Sunday and for months to come.
The lack of bearish strength on the last retrace shows that sellers are simply not present.
The strong advance today and marketwide bullish action reveals a huge demand for crypto, so strong, that prices can only grow.
Ethereum (ETHUSDT) is now set to hit a new all-time high but that's not all. As I explained in a previous publication, the all-time high is not a major resistance level, it will break easily. This means that Ether will continue growing with the first target being $5,790 on the current move. $8,513 is also a high probability target later this year. We might go even higher.
The bullish bias is now fully confirmed. Ether is going up.
The cryptocurrency market will continue growing. The altcoins market will continue to heat up. This is only the start.
Namaste.

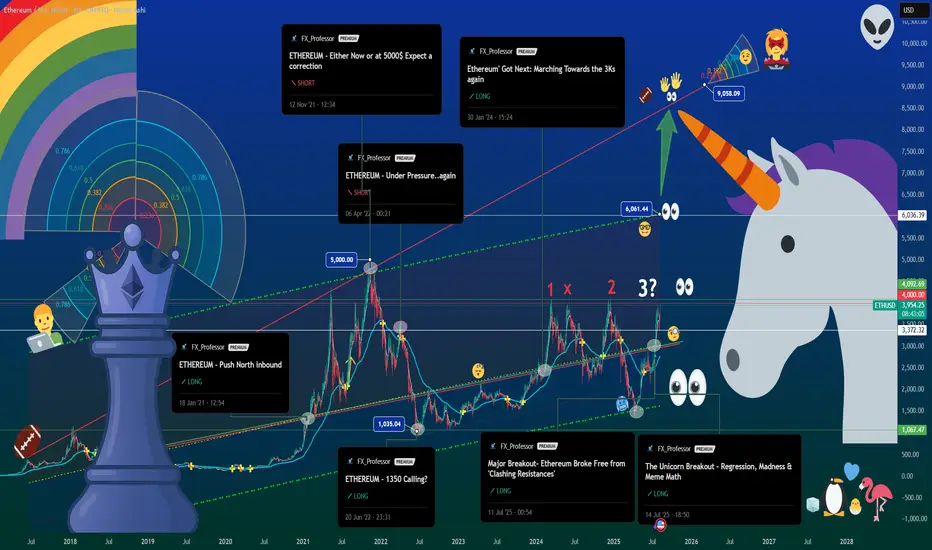
The Unicorn Breakout Part II – Ethereum at $4K, Queen of Crypto🦄👑 The Unicorn Breakout Part II – Ethereum at $4K, Queen of Crypto 📈♟
I’ve had a lot of conversations these past months.
Some friends told me ETH had no power, no influence.
One even called it the “bitch coin.”
Others insisted it lacked dynamics, that it was doomed to trail behind Bitcoin forever.
But the chart… the chart said otherwise.
That’s why, as a trader, so often I close my ears and follow the chart.
📜 The Recap
From “Push North” in 2021, to the “1-2-X” setup, and the July Unicorn prophecy, ETH has kept its dance inside the quadratic regression channel for over 7 years.
In Part I, we called $4,000 the first milestone. Now, it’s reality.
♟ Bitcoin is King, Ethereum is Queen
With recent leadership changes bringing renewed energy and sharper marketing, plus the Petra upgrade quietly powering under the hood, ETH is stepping into the place it deserves. The queen is the most powerful piece on the chessboard — and in this market, Ethereum is moving exactly like one.
📊 What’s Different This Time
-Network activity is pushing toward record levels.
-Transaction counts are surging, signaling deeper engagement.
-The ETH vs BTC conversation is back, and capital rotation is happening in real time.
🛠 Levels I’m Watching:
$4,092 – Current resistance zone.
$6,034 – Mid-regression line, the next battleground.
$8,674 – Unicorn Zone. Euphoric breakout territory.
$3,372 – Short-term support. Below here, $2,912 is on deck.
💙 The Human Note
This run is proof: conviction matters. Sometimes the crowd is wrong, the noise is deafening, and the chart is the only friend that tells the truth.
Trade with discipline, but live with intention. Spend time with those you love. Build things worth remembering. And when you play the game, know when to move your queen.
The Unicorn has hit $4K. The Queen has entered the center.
Next move? Checkmate at $6K? We’ll see.
One Love ,
The FX PROFESSOR 💙
Disclosure: I am happy to be part of the Trade Nation's Influencer program and receive a monthly fee for using their TradingView charts in my analysis. Awesome broker, where the trader really comes first! 🌟🤝📈
ETH Shatters Downtrend with Explosive Breakout | Bulls Take FulChart: ETHUSDT, 1H
Bias: Bullish
Analysis:
Hello, traders! We are witnessing a dramatic and powerful shift in the ETHUSDT market structure that warrants immediate attention.
The Previous Bearish Context:
For several days, Ethereum has been trading within a well-defined bearish channel. This downtrend was characterized by:
A clear descending trendline that has been respected with multiple touches, acting as dynamic resistance.
A series of confirmed lower lows and lower highs, with multiple breaks of structure to the downside (indicated by the "Strong" lows being broken).
Overall seller dominance, pushing the price down from the $4,788 high to a low of around $4,042.
The Bullish Takeover (The Main Event):
The narrative has completely changed in the last few hours. A massive wave of buying pressure has resulted in an explosive move to the upside. The key developments are:
Decisive Trendline Break: A very strong, high-momentum bullish candle has completely shattered the long-standing descending trendline. This is the most significant bullish signal on this chart, indicating the previous downtrend is now invalidated.
Break of Market Structure: This upward thrust has also broken through several previous resistance levels, including the swing high around $4,400. This constitutes a major Change of Character (CHoCH) and confirms a shift in control from sellers to buyers.
Potential Scenarios & Key Levels:
Bullish Continuation (Primary Scenario): With such strong momentum, the path of least resistance is now to the upside. Traders might look for long opportunities.
Potential Entry: A textbook entry would be on a successful retest of the broken trendline or the recently broken resistance level around $4,400, which should now act as support.
TP 1: The previous major high at $4,788 (the '1' on the Fibonacci scale).
TP 2: The next major area of resistance, identified by the indicator as the "Perfect Sell Zone 1", starting around $4,880.
Invalidation Scenario: While the breakout looks powerful, traders must always manage risk. The bullish thesis would be invalidated if the price were to reverse, fall back below the broken trendline, and close decisively below the $4,300 support area. This would suggest the breakout was a bull trap.
Conclusion:
The evidence on the chart is overwhelmingly bullish in the short to medium term. The break of the multi-day trendline is a significant technical event that cannot be ignored. The immediate bias has shifted firmly in favor of the bulls. The key will be to watch for a potential pullback for entry opportunities and to see how the price reacts as it approaches the next major supply zone around $4,900.
Disclaimer: This is not financial advice. This is for educational purposes only. Always do your own research (DYOR) before entering any trade.

ETH New Analysis (4H)After the weekly trigger line was broken and a key supply was cleared, most of the major market participants have been accumulating Ethereum. Considering the momentum and power of the previous bullish trend, we expect nearby supports to hold well and a large distribution phase to form.
In this phase, in order to fill the orders of big players and create a strong bullish outlook before a major correction, the price is expected to revisit the previous bullish wave or even hunt Ethereum’s all-time high.
As long as the green zone holds, we anticipate a price pump for Ethereum in the coming days.
For risk management, please don't forget stop loss and capital management
Comment if you have any questions
Thank You

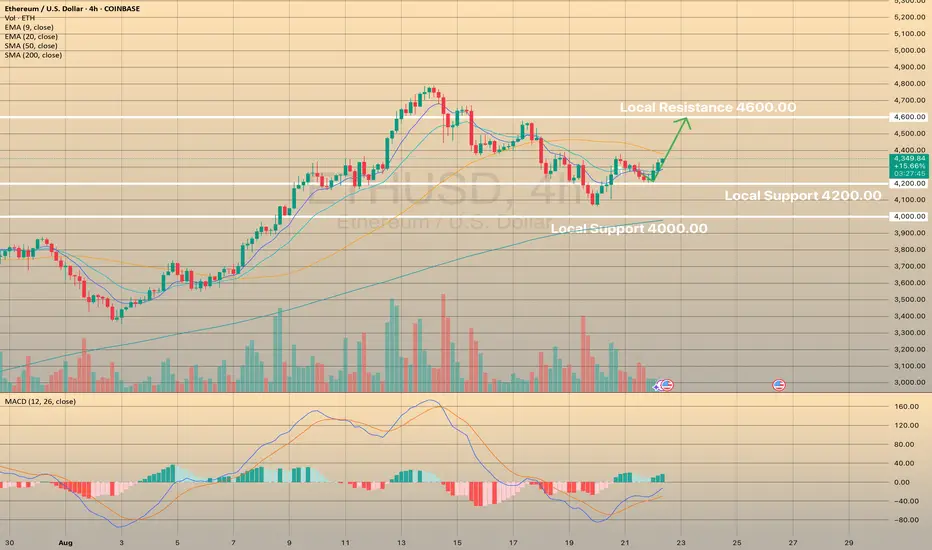
ETHUSD develops new bullish impulseETHUSD develops new bullish impulse
Ethereum is surpassing Bitcoin due to the anticipated approval by the SEC for spot ETFs, the increased adoption by companies, and the positive stance of the SEC regarding liquid staking tokens, which has sparked institutional interest.
Recently the asset managed to hold above the 4,200.00 level. Right now, ethereum is developing a new bullish momentum heading towards 4,600.00 local resistance. MACD has crossed and is in the green zone currently on 4-hour timeframe.
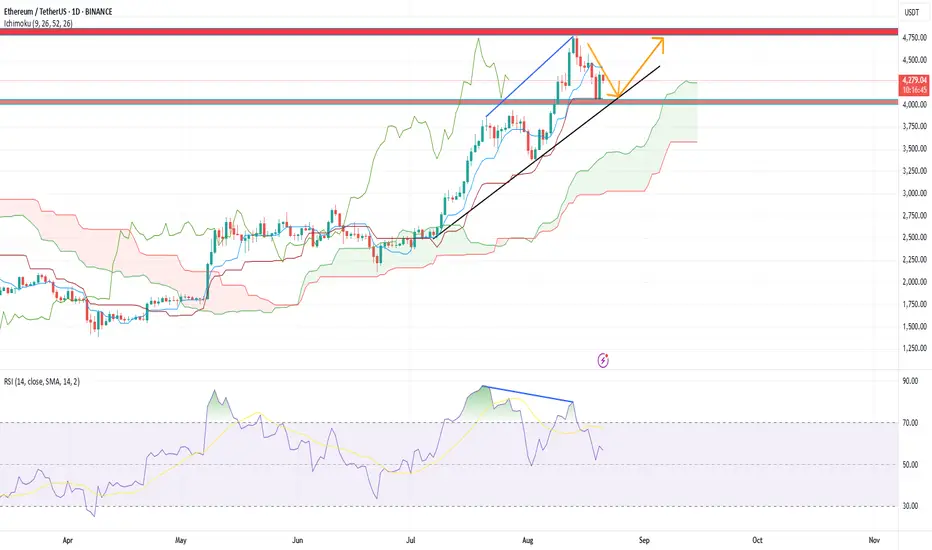
ETHUSDT analysis – 1D OB & Market Structure Scenarios/ AltseasonOn the daily chart, Ethereum is consolidating below the ATH resistance (4859) after a strong rally.
We currently have two major Daily OB demand zones:
First Daily OB around 3200–3600
Second Daily OB around 2400–2800
From here, I see three possible scenarios:
1️⃣ Continuation without deep retracement → Price holds above 4100 and breaks ATH (4859).
2️⃣ Shallow pullback → Price dips into the 3200–3600 OB, then rallies back above ATH.
3️⃣ Deep correction → Price retraces into the 2400–2800 OB before starting a new bullish leg.
⚡ Key point: If any of these three bullish scenarios play out alongside a drop in BTC dominance and a rise in ETH dominance, it could be the real start of an Altseason, with ETH leading the market and altcoins following strongly.
📊 ProfitaminFX | Gold, BTC & EUR/USD
📚 Daily setups & educational trades

Ethereum 7 Days Later · Retrace Or Correction?More information is available now that Ethereum has been retracing for seven days, we can start to make some predictions by analyzing how the token is currently behaving, for example; there isn't much on this chart other than high volume the day that ETHUSDT peaked, the other bearish signals are weak.
The drop is not strong. ETHUSDT is trading safely above EMA55. This move resembles what happened 11-June. A retrace.
On 11-June ETHUSDT peaked at $2,879 and started to retrace. 11 days later, 22-June, ETHUSDT bottomed at $2,111 and that's it, that was the retrace. The entire move was a 26.65% drop, I think we can see something similar.
28-July ETHUSDT peaked again but only briefly, there was a six days long retrace totaling -14.89%. The drop happened from $3,941 to $3,354 but then Ethereum just kept on growing as if nothing happened like before; it is possible to see something similar.
The strength of the current drop, after seven days of bearish action, seems weak. It can intensify in a flash and we see a market crash, but the same dynamics that are present with Bitcoin are also present here. A major crash or flush would only result in a prolonged recovery followed by higher prices.
Ether is likely to move lower but not much lower. Ether is likely to consolidate just to move higher. Ether is growing. Keep it simple.
Namaste.

Ethereum price correction will continue to around $4,000.After Ethereum hit the 4800 resistance level, we are witnessing a price correction. I think Ethereum can goes up again when it hit the Support level at around 4000$.
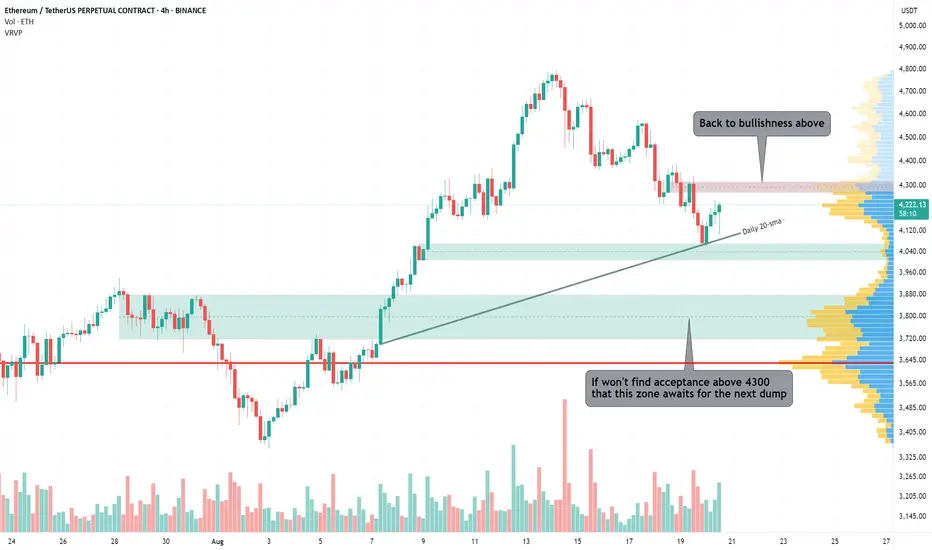
Important level here for ETH🎯 Key Levels to Watch:
• Above: 4240 / 4340 / 4470
• Below: 4090 / 4010 / 3940
🔥 ETH Liquidation Heatmap:
• Above: 4229 / 4275 / 4316
• Below: 4082 / 4040 / 3972
Ethereum just touched Daily 20sma at price ~4066
I bought some there, but frankly, I expected it to fall lower and most of my orders are still there. Unless ETH grows above 4300 and start trading there, chances for another dip to 3940-4010 stay valid.
Why ETH Remains Bullish and Its Next Potential Move !It appears that the pullback is nearing its end, which could potentially lead to a price increase of up to $5000.
PREVIOUS ANALYSIS
ETHEREUM GETTING BULLISH AGAINOn the daily chart, Ethereum holds above the trendline and 20 MA; yesterday's candle is a bullish engulfing. Sub-4k was tested as expected, and Ethereum is ready to take off again to break its all-time high at 4800.

ETH ~ Is this the right buy for 4950?Likely? not likely if you can see or likely? LEts see whats it upto, though as said, it shall blow the pumpkin of everyone

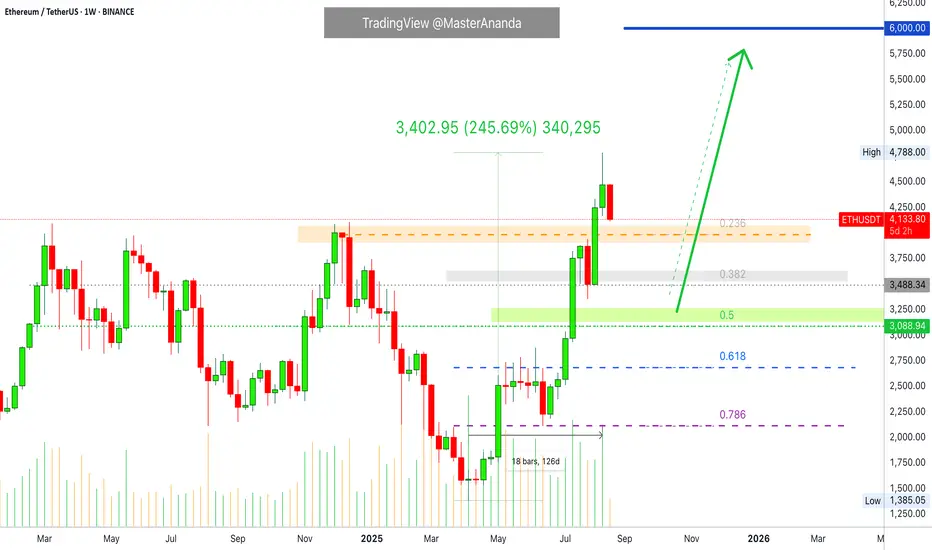
Ethereum: What About Support? $3,000 Next? Watch!Ethereum grew a massive 245% from its 7-April 2025 low and market bottom. The last low pre-2025 bull market. And we are here and this chart is awesome because there is no doubt where we are in this market cycle. We know the market is experiencing growth, Ether is growing, and we know this is only the start.
After strong growth, there is always a correction.
The market tends to seek balance.
ETHUSDT growing straight up for 126 days, four months. 245% total rise.
Where are the support levels?
A strong rise within a bull market is followed by: a mild correction or a strong correction? A long-term multiple months long correction or a two weeks long correction?
Let me help you answer those questions.
Four months will never allow for a correction lasting 3-4 months. This is out of the question. Normally a correction deletes only a portion of the previous move and it tends to last a portion of the previous move.
The equivalent to 0.618 and 0.786 was already consolidated back in May and June. This means that this level does not need to be tested or if it is tested, in an extreme case, then it is likely to hold. Why? Because Ether stopped at this point for more than a month creating a baseline.
The 0.236 Fib. retracement, around $3,900, was not consolidated so this level goes bust as support, on the first try. There wasn't any action around this level on the way up, there won't be any on the way down. So we know Ether to move lower on this drop.
The next level is 0.382 Fib. and this is a strong level. Retraces and corrections within a bull market can easily end here. This is a price of $3,485. There is support around this level as it was consolidated for two weeks before the last high. This level has potential to hold because Ethereum is very strong right now and this zone is below the March, May and December 2024 peaks.
The last level is the 0.5 Fib. retracement. This is another strong support and it tends to stop corrections on its track on a strong bull market. This level can be easily tested. If it is tested, the action isn't likely to last long at these low pries. We are talking about $3,100.
Again, the range between $2,100 and $2,700 is the 0.786-0.618 Fib. retracement and this is a dream buy zone right now and very unlikely that such an opportunity will open up. If it does open, this time, will you buy? Buy when prices are low. Sell at resistance, buy at support.
Ethereum is going down. It is still too early to say how long this correction will go for. Just keep in mind that a retrace can last 1-3 weeks while a correction can last 1-3 months. Both scenarios are possible. Regardless of what the market decides, the bull market is not over, we will see additional growth.
Ethereum will continue growing to hit a new all-time high and beyond.
Namaste.