The altcoin season begins with Ethereum ┆ HolderStat🔁 Wallet 0xc005…5f7 rotated via Binance: sent 851k USDT to the exchange, then withdrew 116.68 ETH (~$515k) back day later. DefiLlama shows ETH/L2 net inflows outpacing stable hoarding today—classic risk-on rotation. Expect on-chain deployment into majors or high-liquidity blue-chip alts next.
🔝 Score: 21 | Balance: ~$500k | Results: $49.3k→$756.5k (+1,535%, 16 trades; avg buy $830 / sell 3,613; age 67m; rating 136).
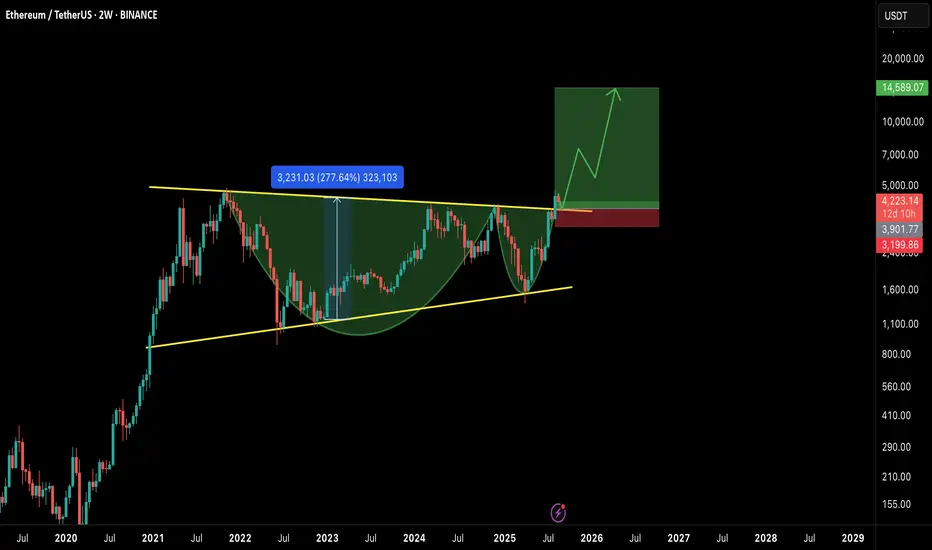
ETHUSDT

ETH/USDT – Mega Breakout on Higher Timeframe!Ethereum has confirmed a massive breakout on the 2W timeframe, breaking through a multi-year cup & handle and also ascending triangle formation. This is one of the strongest bullish continuation patterns and could fuel ETH into a new long-term rally. 🚀
📊 Chart Analysis
Pattern: Cup & Handle on the 2W chart.
Breakout Zone: Around $4,000–$4,300, now acting as support.
Measured Move Target: ~$14,500 (based on cup depth).
Stop Loss Zone: ~$3,200 (below major support).
✅ Bullish Factors
Multi-Year Accumulation: ETH has spent years consolidating below $4K, and this breakout confirms strength.
High R:R Setup: Risk is limited while the potential upside is ~3x from current levels.
Market Cycle Timing: BTC dominance topping out + potential altseason rotation favors ETH’s outperformance.
Strong Structure: Break above resistance aligns with long-term moving averages flipping bullish.
⚠️ Risk Factors
Macro events (FOMC, inflation data) could cause temporary retracements.
A weekly close back below $4K would invalidate the breakout.
BTC volatility may suppress ETH in the short term before altseason kicks in.
🎯 Targets
TP1: $6,500
TP2: $9,500
TP3: $14,500 (full measured move target)
📌 Conclusion
ETH is showing one of the strongest technical breakouts in years. If $4K+ holds as support, the path to new ATHs and beyond looks wide open. This setup could define the next phase of the bull market.
Bulls are in control — it’s ETH’s time to shine. 🌟
🔔 What’s your target for ETH in this cycle? $10K or higher? Let me know in the comments
ethusdtI think the price will rise to higher levels in the coming period, and we must wait for more time and give it a chance. Continue and be patient. It is only a matter of time.

ETH.D : 5-Wave Bull Run Over –Bitcoin to Outshine EthereumeEthereum Dominance (ETH.D) has completed a textbook 5-wave impulsive rally on the weekly timeframe, signaling the end of its upward cycle and entry into a deep corrective phase. As of August , ETH.D at 13.37% is rejecting the key order block at ~14%, hinting at weakening momentum. This shift favors Bitcoin's outperformance, as capital rotates from ETH to BTC, potentially boosting BTC/ETH ratio and Bitcoin returns during the downturn.
NeoWave Wave Count (Daily Chart):
The rally from ~10.5% lows unfolded in 5 waves: Wave 1 to ~11.41%, Wave 2 correction to ~10.11%, Wave 3 extended to ~13.97% (161.8% of Wave 1), Wave 4 shallow to ~13.32%, and Wave 5 topping at 13.97% with the 1.618 Fib extension (1.141%).
Monowave count (~55-70 subwaves) validates the impulse, with alternation (Wave 2 deep/time-extended, Wave 4 shallow/short). The ascending channel (yellow) has been touched multiple times, and the recent rejection confirms exhaustion.
Weekly Chart Insight:
On the weekly TF, ETH.D has hit a major order block at ~14% (1.425%), not the channel top, coinciding with the 1.618 Fib extension from 2023 lows and historical resistance from 2018 highs (~52%). This multi-year descending channel holds firm, with price failing to break the OB—suggesting reversal to midline ~12.5% or lower (38.2%-50% Fib retrace of rally).
Why Bitcoin Outperforms From Here:
As ETH.D corrects (likely a Zigzag or Flat, targeting 11%-12%), Bitcoin gains dominance, driving better returns for BTC holders. Expect BTC/ETH ratio to climb (current ~12.5, target 14-15), with Bitcoin yielding 10-20% superior performance in risk-off environments. If ETH.D drops below 12.5%, correction accelerates to 10% (78.6% Fib), amplifying BTC's edge.
Trade Idea (Bearish ETH.D / Bullish BTC):
Entry: Short ETH.D (or long BTC/ETH pair) below 13.32% on BOS confirmation in weekly.
Targets: TP1 at 12.5% (channel midline), TP2 at 11% (50% Fib).
Stop Loss: Above 14.25% (OB high, R:R ~1:3).
Sizing: 1-2% capital; trail stops on midline breaks. Watch dominance flips—crypto rotations can spark quick BTC pumps.
ETH bulls, pivot to BTC now! #ETHDominance #NeoWave #BitcoinOutperformance #CryptoAnalysis


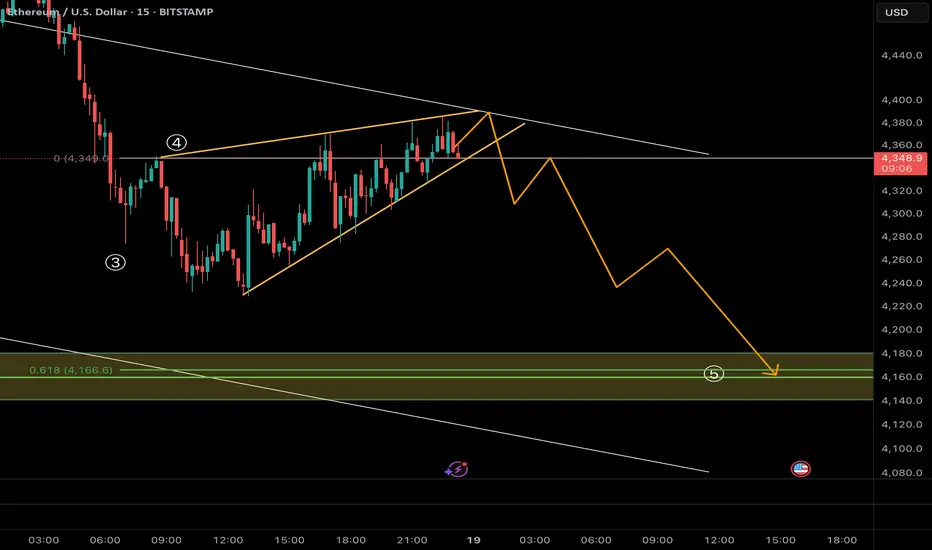
Close view of ETH Short Description : the possible next Move of ETH Shown in graph. ETH can drop to 4100 as 5th wave of correction pattern
Ethereum's Bullish Market Conditions Intact —$11,111 NextNothing changes here. I am looking at the weekly timeframe and it seems Ether is ultra-bullish, it is literally growing above resistance.
The very insistent and annoying resistance from March 2024 was broken just last week. And as ETHUSDT trades above this level, it started to grow. This week is the first week above resistance and the chart looks great.
Things can change. But things can change. We can see multiple red candles show up and lower prices but this isn't what we have on the chart today. Right now we have strong bullish action, strong bullish candles, strong momentum, the break of resistance, the highest prices in four years and accumulating bullish volume. The chart doesn't point down rather it is saying "additional growth."
Ethereum will continue growing. Just think about it: One day ETHUSDT is trading at $1,500 and starts to go up. Four months later, ETH is trading at $5,000.
Thanks a lot for your continued support.
The next target is $6,000 to stop blank at $7,330 to continue rising until we go beyond $10,000, a price tag of $11,111 for this 2025/26 bull run. There is enough time in 2025 for ETH to produce a full bullish cycle. This chart doesn't need 2026. If it extends, better.
Namaste.

$ETH Topping Without All Time High?Has the most anticipated all time high of the year been cancelled? The crowd does not get what it wants! Everyone from CNBC to my grandmas goldfish have been bullish on ETH for the past few months so what a fitting psychological mess it would be if we significantly pulled back here!
Firstly it may just be a temporary set back to the High Volume Node support at $3900 before a move to all time high. Even then I am expecting a deeper pullback to set us up for all time high in Q4. Losing this support bring up the ascending daily 200EMA right at the Fibonacci golden pocket, which you can see is the wave 3 high!
The next target, which is my next buy level, is the larger degree Fibonacci golden pocket, major support High Volume Node and wave 4 bottom at $2100. This would be a capitulation area for many!
RSI has printed confirmed bearish divergence with plenty of room to fall.
Safe trading

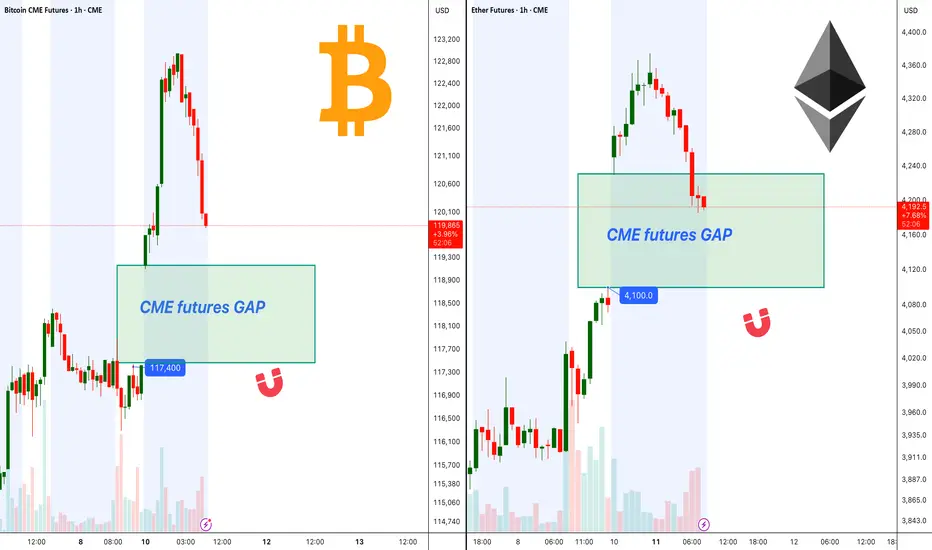
BTC, ETH CME Gaps Could Fill Before Bullish Continuation!Ethereum CME futures currently show a visible gap around $4,100 . Price is approaching this level, and based on historical behavior, CME gaps often act as magnets, drawing price in to fill them before a continuation in trend.
Bitcoin CME futures also have a gap sitting near $117,400. The recent rally has brought BTC close to this zone, increasing the probability of a short-term retracement to fill the gap before any significant breakout attempts.
Both gaps are key areas to watch, as a clean fill followed by strong buying pressure could set the stage for the next bullish wave in BTC and ETH.
Cheers
Hexa
ETHETH make ATH and gave us a breakout and now retesting the breakout and also giving respect to the SR level which was the previous high.
What i see it hunt the long side liquidity and now gonna make a new ATH soon

ETH ANALYSIS (4H)Ethereum has broken a weekly blind trigger and has now reached a higher-timeframe supply zone, which corresponds to the weekly timeframe.
Given the strength of the supply zone and the strong bullish momentum, there are currently two possible scenarios:
**Scenario 1:** It may have a pullback from this supply to demand before making an attack toward the all-time high.
**Scenario 2:** It may consolidate on the supply and go straight toward the all-time high.
In both scenarios, it is expected that after hunting the all-time high or moving slightly above it, the price will drop sharply toward lower levels.
For risk management, please don't forget stop loss and capital management
When we reach the first target, save some profit and then change the stop to entry
Comment if you have any questions
Thank You

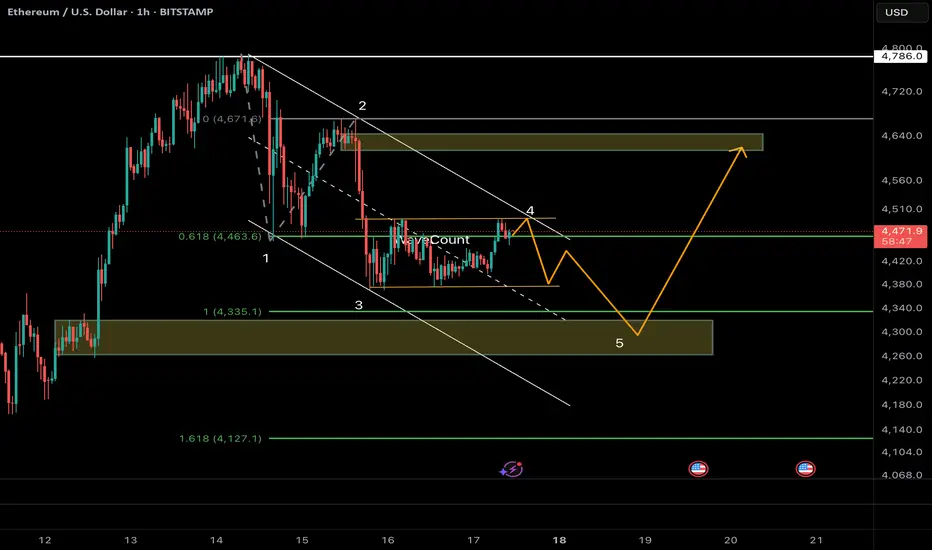
ETH/USDT :Wave 5 Drop to 4300–Rebound Rally to 4600 Before Crashthereum has likely completed a 5-wave impulsive rally from 1380 → 4780, with the channel break confirming a larger correction in progress.
Currently, price is unfolding Wave A of an ABC NeoWave structure, subdividing into 5 smaller waves.
⸻
🔹 Wave Count Breakdown
• Wave 1: Sharp drop to ~4335
• Wave 2: 61.8% rebound to 4463
• Wave 3: Extended selloff (161.8% of W1) → 4335
• Wave 4: Shallow retrace (~38.2% W3) → 4463
• Wave 5 (in progress): Targeting 4300–4270 (1.618 Fib + channel floor)
👉 Monowave count (~45–55) sits perfectly inside NeoWave’s 34–89 range → confirming impulsive character of this Wave A.
⸻
🔹 Next Path Scenarios
1. Wave A completion → Short-term bottom around 4300 (confluence of Fib + channel).
2. Wave B rebound → Relief rally toward 4460–4600 (38.2–50% retrace of A). Likely a sharp ABC bounce that traps late shorts.
3. Wave C decline → Resumption of downtrend toward 3800–4000, with risk of an extended drop to 3500 if momentum accelerates.
⸻
🔹 Technical Clues
• Fib structure: Textbook alternation (W2 deep / W4 shallow).
• RSI divergence at lows → exhaustion signals.
• Dominance context: USDT.D rebounding + BTC.D >60% → capital rotation suggests ETH downside risk remains elevated.
⸻
🔹 Trade Setup (Bias: Short with rebound play)
• Entry (short): Below 4400 on BOS confirmation (break of 4335).
• Targets: TP1 = 4300 (end of A), TP2 = 3800 (post-B wave).
• Rebound long: Consider 4300 → 4600 scalp if Wave A completes.
• Stops: Above 4463 (W4 high) for shorts / below 4300 for longs.
• Risk mgmt: 1–2% position size; trail stops along channel midline.
⸻
⚠️ Volatility remains extreme. Manage risk strictly—crypto psychology flips fast.
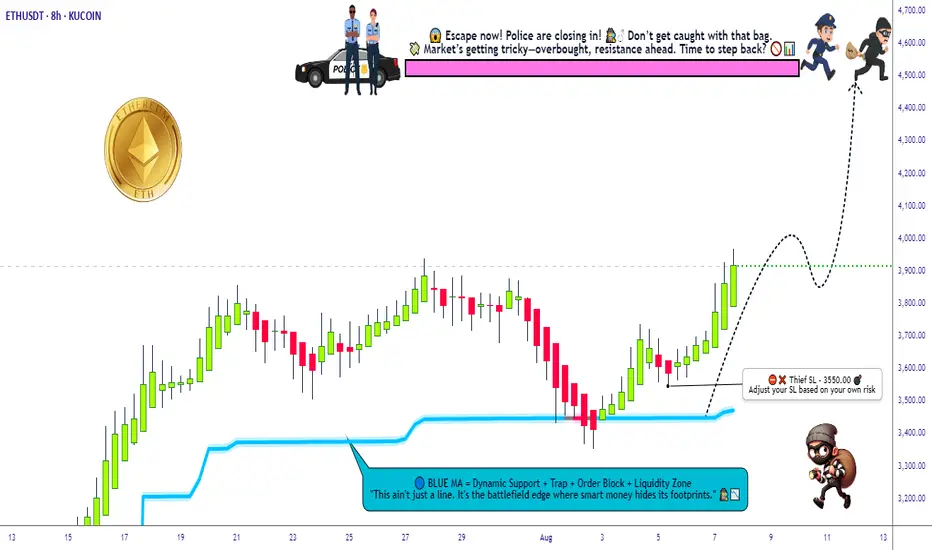
ETH/USDT Grid Plan » Bullish Loadout » Stealing the Top🚨ETH/USDT Crypto Heist Plan 🔓💰
Asset: ETH/USDT "Ethereum vs Tether"
Plan: 🟢 Bullish – Multi-Layered Entry Grid
Strategy: Thief-style limit orders (GRID / DCA stacking)
Entry: Any Dip is a Heist Opportunity 💸
Stop Loss: 🔻 3550.00
Target: 🎯 4500.00
👋 Hey Thieves & Money Makers!
Get your gear ready – it's time to loot the Ethereum Vault 💎🚀
🔥Thief Trader's ETH/USDT Master Robbery Blueprint🔥
This ain’t your average plan — we break in with layered entries, lock in on breakout volatility, and ride the bullish train to the moon 🌕.
💼 Entry Strategy:
No need to overthink. Any dip = loot zone!
Stack multiple limit orders like a pro (15M–1H level).
We're playing the grid game. The more dips, the bigger the stash! 🧱🪙
🚨 Stop Loss:
Set SL at 🔻3550 or under recent swing lows.
Adjust by risk appetite and how many entries you stack.
Thieves don’t chase – they calculate risk.
🎯 Target Zone:
We're eyeing the 4500 mark. But remember – exit before the vault shuts if momentum slows. 🏃♂️💨💰
🔁 Scalpers Alert:
Only long. Only bullish. Only profit. 🧲💥
Stack it, trail it, and let it run with a sniper's precision. 🎯🧠
📊 Market Context:
ETH bulls gaining control post-accumulation.
Strong on-chain metrics, solid macro tailwinds.
Bears trapped in the shadows – we move in daylight. 🐂🆚🐻
📰 Warning – News Bombs Ahead!
💣 Avoid fresh positions during high-impact events.
🎯 Use Trailing SLs to protect your loot.
Smart robbers never get caught unguarded.
💥BOOST This Idea if you're part of the robbery crew 🔐💰
Every boost powers our next move.
Let's rob the crypto market together – one breakout at a time! 🏴☠️📈🤑
Thief Trader™ – Locking Targets. Looting Charts.
💎🕵️♂️📊 #CryptoHeist #ThiefStyle #ETHBreakout #GridGang #BullMode
ETH - short to 4k, then 20k by ChristmasETH bollinger meridian band lining up with recent upward trend.
With institutional investors pigging out on Ethereum for the past few months, and the historical pattern of ETH all time highs, I expect a short term downtrend to 4000 and then shooting up towards 20k by Christmas.
Happy trading!
ETH will bounce to All Time HighEthereum is entering a Buy zone at $4,300, and it's ready for a bounce to an all-time high.
Opening a leveraged Long position with TP at $4,850
ATH FOR Ethereum!!!Hello friends🙌
As you know, Ethereum has been on an upward trend these days and we can say that buyers have entered, but not completely...👀
🔊Now, considering the resistance that Ethereum is facing, namely the number 3900 to 4100, we need to see what reaction the price will see this time when the price reaches this resistance for the 4th time?
✔We will most likely make a small correction and this time this major resistance will be broken again and we will witness a higher ceiling.
✔Otherwise, I have an important and key support that we have identified for you and if the price drops, this support is a good area to buy again.
And finally, observe risk and capital management⚠
🔥Follow us for more signals🔥
*Trade safely with us*

ETH/USDT | 1H Analysis & Key TargetsOverview:
Ethereum is currently showing a corrective pattern after hitting recent highs near $4,880. Price action indicates a potential bearish continuation within a descending channel. The chart highlights a possible ABCD harmonic formation that may lead to further downside movement.
Key Observations:
Current Price: $4,445
Pattern: ABCD correction (potential reversal at D)
Resistance Zones: $4,600 – $4,700
Support Zones / Targets:
Target 1: $4,200
Target 2: $3,900
Target 3: $3,700
Target 4: $3,200
Notes:
Price may attempt a short-term pullback towards the D point before continuing downward.
Watch for confirmation at the descending channel’s upper trendline for potential short entries.
Target levels are based on previous support zones and Fibonacci projections.
Risk management is crucial—set stop-loss above the $4,600–$4,700 resistance area.
Trading Plan:
Consider scaling into short positions on rejection at resistance or after confirming the bearish continuation.
Partial profit-taking at each target zone to manage risk and lock in gains.
Summary:
ETH/USDT is showing early signs of a wave 4 correction in a bearish sequence. Keep an eye on the descending channel and ABCD completion for optimal entry and exit points.

ETH's next volatility period: around August 28th
Hello, traders!
Follow us to get the latest information quickly.
Have a great day!
-------------------------------------
(ETHUSDT 1D chart)
This volatility period for ETH is expected to last until August 15th.
Therefore, caution is advised when trading.
The key question is whether the price can rise above the previous all-time high (ATH) of 4868.0.
Currently, the key support and resistance levels are 3900.73-4107.80.
Therefore, even if there is a further decline, if the price remains within the 3900.73-4107.80 range or higher, the upward trend is expected to continue.
Currently, the HA-High indicator is formed at 3708.87, so it's important to check whether a new HA-High indicator is formed if a further decline occurs.
The formation of the HA-High indicator indicates a decline from the high, so determining whether support is found near that level is crucial.
While ETH's volatility period is around August 28th, BTC's volatility period is around August 24th. Therefore, it's important to monitor how the price moves during this period.
-
Thank you for reading.
We wish you successful trading.
--------------------------------------------------
- Here's an explanation of the big picture.
(3-year bull market, 1-year bear market pattern)
I'll explain more in detail when the bear market begins.
------------------------------------------------------

ETH Long Idea - Daily Recap - 14.08.2025📊 Market Sentiment
Overall sentiment remains bullish, supported by expectations of a 0.25% rate cut in the upcoming FOMC meeting. A weakening USD and increasing global risk appetite are creating favorable conditions for further upside in crypto assets.
Ethereum is approaching all-time highs, fueled by a $1B single-day ETF inflow. Additionally, rumors of potential SEC approval for Ethereum staking policy could directly boost ETH’s utility — strengthening the long bias.
📈 Technical Analysis
Price has pulled back to the daily fair value gap. HTF fair value gaps are historically strong zones for potential bounces.
📌 Game Plan
I expect possible expansion toward all-time highs here, as we have broken the LTF market structure.
📋 Trade Management
Entry: 4602$
SL: 4455$
TP: All-time highs at 4867$
💬 Like, follow, and comment if you find this setup valuable!
Disclaimer: This content is for informational and educational purposes only and does not constitute financial, investment, or trading advice. Always do your own research before making any financial decisions.

ETH/USDT 4H chart review1. Trend
• Direction: a downward trend, confirmed by a series of lower peaks and lower holes.
• The black line is a downward trendline - a course from a few candles reflects it down.
• The increase in volume in declines suggests that the seller is still dominating.
⸻
2. Key levels
• Resistance:
• 4 634 USDT - the last strong resistance from which the price has reflected.
• 4,527 USDT - local resistance, coincides with Trendline.
• Support:
• 4,415 USDT - the current level of support tested, the price consolidates here.
• 4,300 USDT - another strong level of support; Breaking can accelerate the inheritance.
⸻
3. Current situation
• The price has fallen below 4,527 and is currently supporting 4 415.
• The candle formation on support is mixed - small green candles after a large red impulse suggest a temporary pause or a correction attempt.
• The volume on inheritance candles is higher than on growth → Seller still stronger.
⸻
4. Scenarios
🔴 Negative (more likely if the sales volume persists)
• If 4,415 is pierced with an increased volume, the purpose of the inheritance is 4,300 USDT, and in case of further pressure even 4,200.
• The downward trend is maintained.
🟢 positive (less likely at the moment)
• If the course reflects from 4 415 and breaks Trendline + Level 4 527, then possible movement in the direction of 4 630.
• This requires an increased volume of buyers.

ETH/USDTCurrently holding a local bullish structure. Within the corrective move, two key zones are marked where a potential reaction may occur.
Positions to be taken only after clear confirmation.

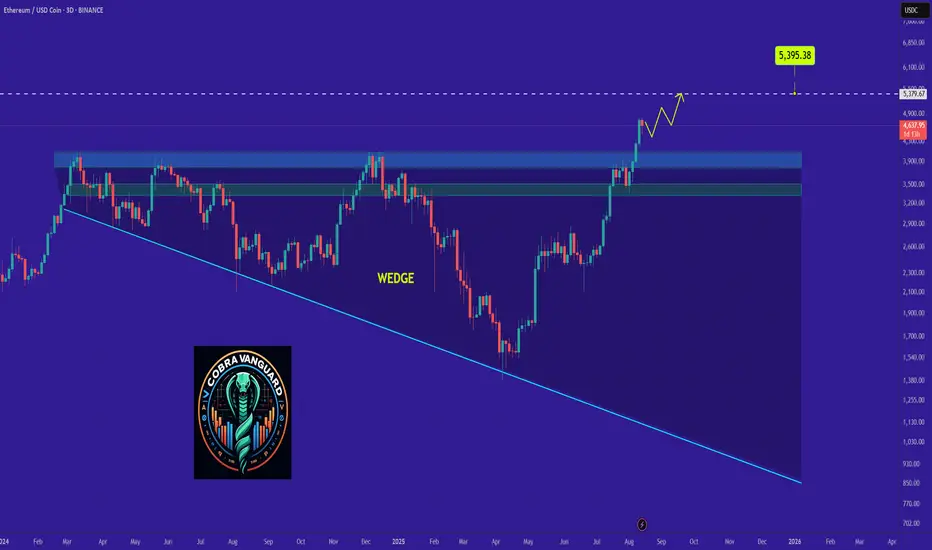
Why ETH Remains Bullish and Its Next Potential Move !As discussed in the previous analysis, the price has finally broken the wedge, and now, with a slight pullback, it could reach above $5k.
previous analysis
ETHEREUM bearish-divergenceA bearish divergence exists on Ethereum's daily RSI, but since $4,000 is broken, it should hold above that price.
