ETH ROAD TO 20K+ plan BAs far as we are getting closer to the final accumulation stage on ETH we can see a potential shape of huge channel in log scale but even bigger I posted previous time due to price action and ETH going better I thought.
Still after forming median of the channel I would like to see a big and fast correction from here towards 2900 support which must hold imo.
Top of that channel depends on timing so the later the better I guess.
ETHUSDT

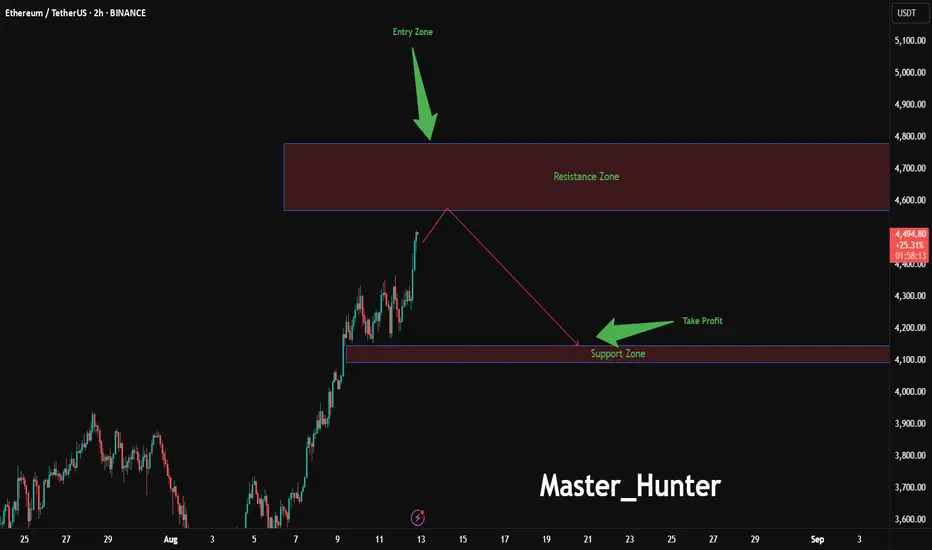
Ethereum Drop Zone Approaching?BINANCE:ETHUSDT is flashing warning signs on the 2-hour chart, with an entry zone between 4570-4780 near a critical resistance level that has capped recent rallies.
This setup suggests a potential reversal , targeting a profit zone between 4145-4093 where strong support and the 200-day EMA converge. Set a stop loss at 4780 on a close above to protect against a false breakout, keeping risk tightly controlled. A break below 4550 with increasing volume could confirm the downward move, especially if Bitcoin leads the market lower.
Keep an eye on Ethereum network upgrades and overall crypto market sentiment, as these could act as key catalysts. This trade offers a strategic opportunity for those ready to navigate the volatility—share your insights below!
#ETHUSDT #EthereumTrading #CryptoSignals #TechnicalAnalysis #TradingView #DayTrading #MarketAnalysis
$BTC Macrolast idea remains intact—we are still bullish. Alts have held strong while BTC plunged. (I don’t own any BTC, and neither should you above $100K.)
I predicted the exact $15.5K bottom on X, as well as the August 5th crash and bottom. Unfortunately, I wasn’t on the charts in December and missed the biggest, clearest signal on USDT.D for a potential local top, which otherwise would have 2x'd my current portfolio but mistakes were made)
BTC taking the hits while alts hold steady is a strong sign that whales are taking profits from Bitcoin and preparing for "rotation".
Most traders believe the cycle is over—and there are valid reasons for that (some of them are):
- A monthly bearish engulfing candle
- A structure resembling the 2021 top, suggesting one last rally before the bear market
- Worst of all, double bearish divergence on the monthly, which worries me too
However, there are strong counterarguments.
The biggest? The cycle has never topped with BTC.D this weak. That’s why I’m still leaning toward a bullish scenario until proven otherwise.
Update on the above chart:
The parabola is intact with a beautiful reaction. That doesn’t mean we can’t still visit the red box—there’s only air between them—but I’m holding, and that remains my primary scenario.
Alts can make new lows, but RR isn’t worth it. As I’ve said before, the time to sell spot bags has passed. You don’t sell in between unless invalidation occurs.
Timing is everything. We failed to time this market, assuming it would mimic past cycles—but everyone was wrong. Traders won this cycle, while investors (except BTC holders) struggled... until now, at least.
ONLY DIFFERENCE BETWEEN BOTH SCENARIOS (MENTIONED ON CHART) FOR ALTS?
You have to wait way longer on the second scenario but both would take us to our goal.
Worst case? We break and HTF close on USDT.D - last hope, officially ending bull market!

Ethereum Breaks 504 Days Long Resistance · The 2025 Bull MarketEther just broke a 504 days long resistance. The next one is the 2021 all-time high which happened a massive 1,372 days ago. Early November 2021.
Ethereum is breaking all resistance. One is already gone and the next one will be gone very soon, just this week is the first time that ETHUSDT is moving freely after breaking the high from March and December 2024. This was a price level around $4,100 and this was a tough barrier.
First in March 2024 Ethereum started to decline from this price to a low of $2,111. The second time happened with a $1,385 bottom. This time, ETHUSDT is already trading at $4,725 so there is no resistance left.
The last all-time high is not a resistance level of relevance. It does have some psychological effects because people track it but the market isn't likely to stop there for any meaningful amount of time. The action is headed straight up.
You know we are open and aiming for $11,000 but right now $6,000 followed by $7,300 is an easy goal. Go higher.
Do you think Ethereum was expensive when it traded around $2,400?
Remember, "trading at bottom prices"? Not anymore.
Ethereum is ultra-bullish now and there is no going back, a new all-time high is upon us and once Ether hits a new all-time high, all bets are off. Everything will speed up and all the smaller altcoins will start to follow.
The high increase in trading volume that tends to happen on the third wave of a bullish impulse is not present here. In fact, there is no significant rise in trading volume since July 2022. The weekly session in April produced high volume but not higher.
This is good. This means that the best is yet to come. We haven't seen much yet. We still have to experience the bullish force, strong momentum, the completion of the third wave and then finally the fifth wave.
Whatever you do, keep holding long-term.
Ethereum is going up.
Namaste.

Ethereum's Hits New All-Time High · Next Target $7,332Ether (ETH) is approaching its 2021 all-time high and wow!, this is awesome, think about it. One day we are witnessing a correction, Ethereum crashing for years lower below $2,000 and then even lower, below $1,500 and then what? After just several months Ethereum is already trading way high above $4,500 and ready to hit a new all-time high, catching up to Bitcoin and XRP; the rest of the altcoins market will follow.
Yes, a new all-time high but that was never the goal. The previous peak is only a resistance point, a reference point which we use to know how good we are doing, how far advanced we are in the current cycle but it is never the end. The all-time high is meant to be broken in each cycle and this is exactly what we are seeing today.
As soon as ~$4,900 breaks, ETHUSDT is likely to continue to straight up to face resistance right around $6,000. Stops should be just like the past. A few days red or sideways then back green. Always up with maximum force, the entire move.
The main resistance for this current advance is $7,332 but for the current cycle, new and updated numbers based on current market action and fresh data suggests that $11,318 is a possible target based on standard cryptocurrency bull market action. That is, we don't even need an extraordinary bull market to make Ethereum worth $11,111 per Ether token.
Ok. Market conditions look great. It's been a long ride... We've been tracking Ethereum for so many years now and this entire bullish recovery, cycle and wave. Let's continue to ride the market together... Let's trade!
Namaste.

ETH at resistance!Ok, finally ETH is making happy all his estimators but I jsut want to point out that it's close to ATH so maybe wait to see what happens before buying it. I'd wait for some short setup unless there's a stronk breakout!
I expect something like what I drawn there. I don't own a lot of ETH but remember that after ETH money will flows in big caps alts and that will make us happy.
Good luck!

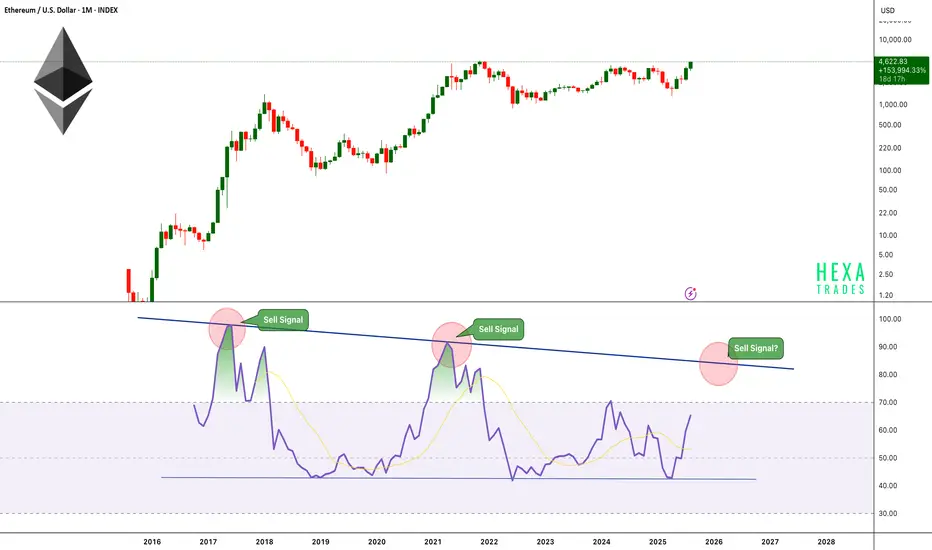
ETH Monthly RSI Approaches Cycle Top? Ethereum is showing strong momentum on the monthly timeframe, pushing toward levels not seen since its previous all-time highs. However, a critical technical indicator, the Monthly RSI is currently at 65 and steadily approaching its historically reliable sell zone between 83–85.
Key Observations:
-The monthly RSI has been capped by a descending trendline resistance since 2017.
-Each time RSI touched this resistance — in 2017 and 2021 — ETH reached a cycle peak, followed by a significant multi-month correction.
-Price is rallying strongly, but RSI still has room to rise before hitting the critical 83–85 zone.
Historical Pattern:
-2017: RSI rejection led to a ~90% decline.
-2021: RSI rejection triggered a ~75% drawdown.
-Now (2025): RSI is climbing toward this zone for the third time, potentially signaling a major profit-taking window once reached.
When the RSI reaches the trend resistance level of 83–85, the price could potentially touch the $7,500–$9,000 range.
Cheers
Hexa
ETHUSDT, Is it time for the biggest Altcoin?Hi fellow traders, ETHUSDT will be ready to make a move higher from the blue box after it completes the flag correction in ABC formation. Target will be 3429.75. Good luck and trade safe!


ETH Analysis (1W)Here I am, presenting the asset I personally dislike the most — ETH.
But the chart doesn’t care about feelings. ETH looks ultra bullish, but only if it breaks above the $4,125 level.
Why this level?
The $3,800–$4,100 range has historically acted as a major distribution zone — a place where market participants have consistently taken profit for years.
If this resistance is finally broken, we could see ETH rally toward $6,900 as a minimum target.
This level is based on the breakout projection of the long-standing macro structure.
Honestly, the target looks even better than the asset itself :)
Good Luck.

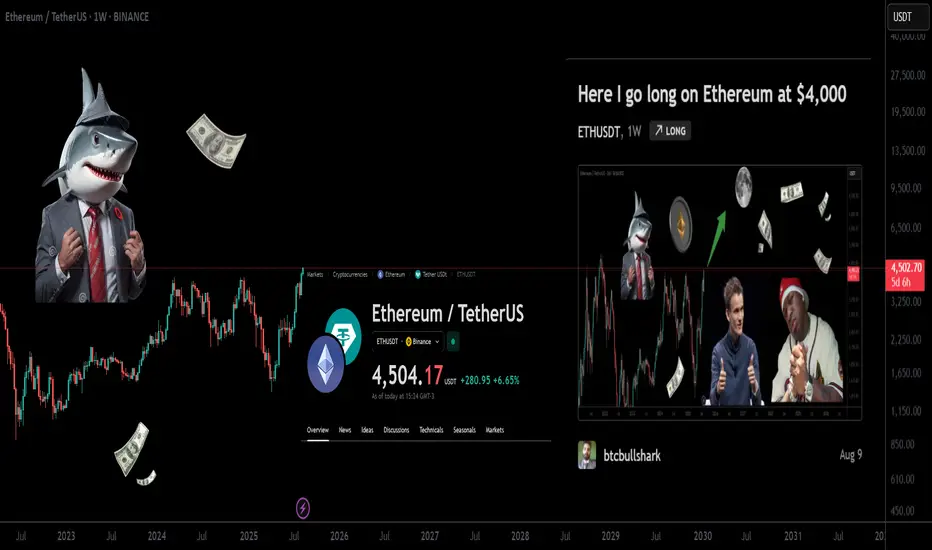
How is our Ethereum long going?TSUNAMI TSUNAMI
sardines get lost
whales get liquidated
nobady undestands whats happening
it's the market acting
We are making ethereum great again (MEGA)
mega people owe me that
you've been warned
I was TRIGGERING THE MAJOR ETHEREUM SUPPLY SHOCK
MAJOR
sardines traumatized by my bitcoin long in november (still open)
will be traumatized now by my ethereum long
my new business
CASH MONEY HEROES
i look up to the sky and now the world is MINE
Ive known it aaaaaall my life
I MADE IT, I MADE IT
i used to dream about the life Im living now
i know that theres no doubt
I made it I MADE IIIIIIIIIIIIIIIT
knooooown from the city where no one believed in me
but I never give up the fiiiiiiiight
yeah, but now on TOP
i told you to let it ROCK
now moneys fallin from the SKY-Y-Y-Y-Y-Y
birdman sharkman
swagged out, 100
rooftop hella choppa burning SMOKE
louie bag stay strapped with a priceless GLOBE
high life flippin and get some MORE
paradise the luxury marble FLOOR
when I hit, nig** hit me full of that caaaaaaaash
more money than i seen in a garbage caaaaan
stunna island money and the POWER
thats how we do it make it rain make it SHOWER
Latest BTCUSDT Update TodayBitcoin surged to an incredible $122,056 by the close of trading on August 11, once again challenging the key resistance level of the world’s leading cryptocurrency. But this isn’t just any number—this is the Fibonacci 1.618% extension, known as the "golden ratio" in technical analysis.
The golden ratio originates from two major market bottoms: the 2018 bear market low and the 2022 bear market low. For those who have tracked Bitcoin through various cycles, these timeframes mark the darkest periods in the history of the cryptocurrency market.
In my view, Bitcoin surpassing new highs is just a matter of time after a month of accumulation. I’ve witnessed strong ETF inflows, more companies buying Bitcoin, and positive remarks from the White House.
While Bitcoin struggles with resistance, Ethereum is on a completely different trajectory. According to TradingView data, ETH has tripled from $1,435 in April to its current price of $4,315.
Bitcoin’s volatility is still near all-time lows, while Ethereum has seen a significant increase. Just a month ago, the market predicted a 5% chance for Ethereum to reach $4,500 in August, but now everything has changed.
Many traders are betting on ETH revisiting its all-time high.
The simultaneous price surge of Bitcoin and Ethereum has pushed the total cryptocurrency market cap to a new record high of $4.14 trillion. This number reflects the strong recovery of the entire blockchain industry after a challenging phase.
With the strong rally this weekend, we expect Bitcoin and Ethereum prices to continue rising, unless there are any tariff shocks.
Will Bitcoin break through and challenge its all-time high? Stay tuned!

#ETH #ETHUSDT #ETHEREUM #LONG #SWING #Analysis #Setup #Eddy#ETH #ETHUSDT #ETHEREUM #LONG #SWING #Analysis #Setup #Eddy
ETHUSDT.P Swing Long Analysis & Setup
Important area of the upper time frame for swing are identified and named.
This setup is based on a combination of different styles, including the volume style with the ict style.
Based on your strategy and style, get the necessary confirmations for this Swing Setup to enter the trade.
Don't forget risk and capital management.
The entry point, take profit point, and stop loss point are indicated on the chart along with their amounts.
The responsibility for the transaction is yours and I have no responsibility for not observing your risk and capital management.
🗒 Note: The price can go much higher than the second target, and there is a possibility of a 500% pump on this currency. By observing risk and capital management, obtaining the necessary approvals, and saving profits in the targets, you can keep it for the pump.
⚠️ Warning : The stop loss is dramatic and large. Place the stop loss based on your strategy and after getting entry and confirmation on the entry point behind the last shadow that will be created. (( This is just my opinion and is not meant to be 100% correct, so be careful with your capital. ))
Spot Investing : ((long 'buy' position)) :
🟢 Entry 1 : 1800
🟢 Entry 2 : 1500
First entry point calculations :
⚪️ SL : 1370 ((23.89%))
⚫️ TP1 : 4500 ((150%))
⚫️ TP2 : 5000 ((177.78%))
⚫️ TP3 : 8000 ((344.44%))
⚫️ TP4 : 10000 ((455.56%))
‼️ Futures Trading Suggested Leverages : 3-5-7
The World Let it be Remembered...
Dr. #Eddy Sunshine
4/4/2025
Be successful and profitable.
Do you remember my first Ethereum swing long signal?
My first swing long signal was provided on Ethereum, which was spot pumped by more than 100% and was profitable :

$ETH Weekly Analysis – ATH soon?ETH is testing the upper boundary of the green zone (~4340–4350), which is acting as key resistance, very close to its ATH.
Scenarios for this trading week:
Bullish : a confirmed breakout and close above 4350 opens the door to the 4,600–4650 target zone, with strong resistance ahead at 4860 (previous all time high zone). If buyers show strength, we can see new All-time High (~4900-5000).
Sideways/Correction : price could move in the 4000–4200 range for consolidation.
Bearish : а drop below 4000 could push ETH down to 3500–3650, even toward the key support around 3300 if the selling pressure grows.
Daily RSI is at 74, that means it's deeply overbought, so be cautious about your long positions.
Disclaimer: The author’s opinion may not align with yours.
BYBIT:ETHUSDT

ETH ROAD TO 20K+I think we are getting closer to the final accumulation stage on ETH.
We can see a potential shape of huge channel in log scale.
After forming median of the channel I would like to see a big and fast correction near 30% from here towards 2900 support which must hold imo.
After that test of smthg around 3600 rgion and double bottom would be the best option just before few months of consolidation before breaking up and starting blow off top part.
Top of that channel depends on timing so the later the better I guess.

Ethereum ETH price analysis📉 Three possible scenarios for #Ethereum CRYPTOCAP:ETH :
🟢 Bullish:
Minor correction to $3950–$4000, followed by a breakout to new all-time highs (ATH).
🟡 Neutral:
Drop to $3400, bounce to $3950 — and then the decision point: breakout or breakdown?
🔴 Bearish:
Deeper correction to $2650 — possibly the last great buying opportunity before the next major rally.
👉 Which scenario for OKX:ETHUSDT resonates most with you?
Let us know in the comments!

ETH NEXT BULLISH MOVE.🟢 ETHUSDT | 1H Bullish Setup
✅ Price broke structure and is in bullish order flow.
✅ Clear POI (Point of Interest) zone at 4,060 – 4,080.
🔍 Price is retracing from highs, yet to tap into POI.
📌 Trade Idea: Wait for price to retrace into POI zone and look for bullish confirmation before entry.
🎯 Potential bounce toward 4,350+ after liquidity sweep and POI mitigation.

ETH | NEW ATH or DUMP ?Ethereum recently peaked at $3900. And allthough this is not a new ATH (close by a few hundred dollars), it is a local high for the year.
My last update was on an inverse Head and Shoulders pattern on ETH, which has since increased over 50%:
(The original idea here:)
The question now, is what's next for ETH - further increase, or are the increases over for the near term and is a correction more likely?
I'm going to say that the increases for ETH are over for now. This is because we correction is most definitely due after such a large increase in a fairly short timeframe. I'm not saying we're heading into a full out bearish cycle, but a 20-25% correction would be most normal at this point.
Additionally, XRP has also made it's peak and lost the high, now trading just under $3. This is a strong sign that the alts have likely already rallied, since XRP used to be the last to increase (if it increased at all, historically. (Thanks Jedd).
I was very lucky to call that top here:
Either way, buyers may use this correction to scoop up on smaller alts over the next few weeks. This ultimately depends on whether the market has ONE MORE pump, and if the correction will bounce back from a 20-25% pullback.
_________________
BINANCE:ETHUSDT

ETHUSD - Technical picture The long-term trend remains bullish: Technical picture
The long-term trend remains bullish: The price is confidently holding above the 20-, 50-, 100- and 200-day moving averages, which indicates a stable uptrend.
TipRanks indicators:
Almost all key MAs (5-200 days) are showing a “Buy” signal, with the exception of MA20 (Sell).
The current price of Ethereum (~$4,188) is significantly above all MAs, which confirms growth.
RSI (14) — 58.75 (neutral), MACD — Buy, ADX — neutral, ROC — Buy.
Result — “Strong Buy”.
TipRanks
Price levels
ETH previously relied on EMA50 (support zone), and demonstrates a continuation of the uptrend on short-term timeframes.
Economies.com
Support and resistance levels
Resistance: Near the psychological mark of $4,000 — an important barrier, the breakout of which can trigger another growth round.
Support: The standard of the ongoing bullish trend is the EMA50, as well as the levels of $3,700–$3,800, where ETH demonstrated stability.
Result
The trend remains positive: ETH is confidently above all key MAs, MACD and other signals confirm the strength of the bulls.
The key level is $4,000: breaking it can return ETH to the growth zone.
RSI at 58.8 and MACD in the Buy zone confirm the potential. However, given the overbought conditions, a small correction or consolidation is possible.
Recommendation: long positions on a rebound from support with a target of $4,000+, or entry upon a confident breakout of the resistance level.

ETHUSDT analysis - 1H FVG and OB SetupsETH has recently rejected from the 4,370 area, showing signs of short-term exhaustion.
On the 1H chart, a clear FVG is located around 4,100, which could act as a liquidity target if selling pressure continues.
Below that, we have a strong Bullish OB around 3,900, aligning with previous demand and potential reversal interest.
If price retraces into the FVG zone (4,100) and shows bullish reaction in lower timeframes, short-term buys could be considered targeting 4,300 – 4,370.
A deeper move into the OB at 3,900 would be a high-probability long setup for swing traders, with upside potential toward 4,500.
For now, structure remains bullish on higher timeframes, but short-term correction is possible before continuation.
📊 ProfitaminFX | Gold, BTC & EUR/USD & Crypto
📚 Daily setups & educational trades

ETHUSDT 4H Breakout: Symmetrical Triangle Targets AheadMEXC:ETHUSDT
Key Elements:
Pattern: The chart shows a symmetrical triangle pattern formed by two converging trendlines connecting the highs (resistance) and lows (support). The breakout appears to have occurred upward from point D, with a measured move of 1.683 times the height of the triangle (from 0.619 to 4.49).
Price Levels:
Entry/Breakout Point (D): Approximately 4.49.
Stop Loss: Set at 4,333.59, just below the upper trendline and recent high.
Targets:Target 1: 4,047.34.
Target 2: 3,963.67.
Target 3: 3,651.82.
The price range spans from around 3,250 to 4,500 USDT.
Indicators:The triangle's height (0.619) and the breakout move (4.49) suggest a calculated target projection.
Green and red candlesticks indicate bullish and bearish periods, respectively.
Analysis:The upward breakout from the triangle suggests bullish momentum, with the price potentially aiming for the listed targets.
The stop loss at 4,333.59 is strategically placed to limit downside risk if the breakout fails.
The targets decrease incrementally, indicating a possible profit-taking strategy as the price progresses.

ETH update 9.06.2025Hello everyone, many of you asked me to publish my vision for ETH.
Here you go!
I believe that the previous impulse movement was only the first upward movement, and now we are in a sideways correction movement — call it what you will, but the fact is that the exit from this flat will be upward.
1. End of the year
2. ETH is accumulating on the Onchain
3. Liquidity overflow from BTC can be seen on the ETHBTC chart, and the overflow began at the very bottom
4. What else can large conservative players accumulate?
5. We are going after liquidity from above and should break 4100 by September
Best Regards EXCAVO

