eth taps athgm,
i'll keep this post short and sweet, straight to the point.
eth came down in 3 waves from the recent highs,
we swept the all time highs to catch all the short stops
and we shook out all the bulls after.
we've been consolidating beneath last cycles high for many years now,
and i believe we are getting ready to break out finally.
my upside target is pretty fluid, not attached to any particular number,
more interested in the wave structure itself.
somewhere around 8-10k is fair value,
maybe as high as 20k if we ignite some true momentum.
---
ps. if this post gets 5 likes, i will share my macro bull case on eth.
ETHUSDT

ETH Chart doesn't look prettyI see Ethereum’s chart not looking pretty for long nor hold positions at these prices.
Price Action
ETH continues to make lower highs and lower lows inside a descending wedge.
Price is moving toward two major demand zones, and the momentum is really weak. Just minor price hiccups.
I'm expecting some choppy or even consolidation movements before a possible test of the lower demand blocks.
OBV is such an underrated indicator!
Look at OBV, this is where the things gets interesting..
OBV is breaking its trendline downward, even while price hasn’t fully broken structure yet.
This is a classic sign of volume distribution. Smart money is exiting positions quietly.
When OBV breaks direction before price, it often predicts the next major move.
At the moment, ETHUSD is looking heavily bearish. Given the fact that BTC is also giving early signs of a bearish trend, I don't think buying ETH is a good idea here. I'll wait for a deeper correction.
Good Luck!

ETH/USDT (4H Timeframe)The chart shows Ethereum’s price action on the 4-hour timeframe with key supply–demand zones, structure levels, and an active long setup.
1. Market Structure
ETH has been in a downtrend, forming lower highs and lower lows, but recently it created a short-term bullish reversal from the demand zone near $2,880–$2,950.
Price broke a small internal structure high (marked “XX-Liquidity”), indicating potential short-term bullish strength.
2. Key Zones
Major Supply Zone (Upper Blue Box):
Around $3,360–$3,414 — a strong resistance area where price previously dropped heavily.
Major Demand Zone (Lower Blue Box):
Around $2,888–$2,949 — where price had a strong bullish reaction.
3. Order Block (OB+)
A bullish order block is marked just below the current price (~$3,000).
Price is pulling back into this OB, suggesting possible bullish continuation if it holds.
4. Current Position Setup
There is a highlighted long trade zone from the OB, targeting the $3,257–$3,257+ region.
Entry appears near $3,000, SL below the OB, and TP at the previous major structure high.
5. Price Reaction
ETH is hovering around $3,003, testing the order block for liquidity.
If OB holds, price may push toward the target zone. If broken, price may revisit the demand zone at $2,880–$2,940.

$ETH - Ping-Pong ZoneCRYPTOCAP:ETH is sitting under this diagonal resistance. Could see a technical bounce around 2.9k (ltf support) , but if we can’t clear 3.1k, we could see it retesting 2.8k to 2.7k
Bottoms don’t form overnight, so Ethereum will probably keep ping-ponging in this 2.6k–3.1k range for a bit before the next move.

ETHUSDT — Bearish Flow Targeting 2,956ETH is still trading below the key intraday resistance at 3032–3045, keeping the bearish structure intact.
As long as price fails to break and hold above this zone, downside pressure is expected to continue.
The current Fibonacci sequence supports a continuation lower, with price showing repeated rejections around the 0.333 / 0.236 levels.
This keeps the market biased toward the next liquidity pocket.
📉 Main bearish target: 2,956
This level aligns with the Fib 1.0 extension, making it the next high-probability destination if bearish momentum persists.
A break above 3045 would invalidate this scenario; otherwise, ETH remains on track toward 2,956.

ETH 4H – Trendline Rejecting, But Does Price Sweep $2,629?ETH tapped into the 0.5–0.786 Fib retracement zone, directly under the macro downtrend line, creating a strong cluster of resistance. Price rejected both the 50 EMA (yellow) and 100 EMA (purple) on the retest, confirming continuation of the 4H downtrend.
The key downside target is the $2,629 liquidity level, where previous wicks, volume clusters, and demand reactions formed. With Stoch RSI fully overbought and rolling over, momentum supports a move lower unless ETH can reclaim the 50/100 EMAs with a strong impulsive candle.
A break above the trendline would invalidate the short-term bearish structure and reopen targets toward $3,140 – $3,260 (0.5 and 0.618 retraces).
Until then, the path of least resistance remains toward liquidity below.

ETH/USDT | Ethereum Breaks 3000 and Momentum Still Points HigherCRYPTOCAP:ETH pushed all the way to 3000 and the bullish view is still fully intact. From the 2600 rebound to here the move has delivered more than 17 percent already and the structure still supports continuation. As long as ETH holds above the 2500 to 2700 demand zone the upside targets remain 3200, 3500, and 4000 in the next major leg. On the supply side the important zones sit at 3200 to 3300 and then 3500 to 3600 where price may slow down before the next breakout. For now momentum belongs to buyers.
Please support me with your likes and comments to motivate me to share more analysis with you and share your opinion about the possible trend of this chart with me !
Best Regards , Arman Shaban

Ethereum Faces Death Cross After 9 Months After $4 Billion SellEthereum is currently priced at $2,921, sitting just under the crucial $3,000 resistance level. Losing this psychological threshold triggered the wave of $4 billion in selling and reinforced bearish sentiment.
In the near term, ETH will likely consolidate under $3,000 and attempt to hold above support at $2,814 or $2,681. If market conditions worsen or investors continue to sell, Ethereum could break below $2,681 and slide toward $2,606 or lower.
If broader conditions stabilize, ETH could regain bullish momentum. A decisive reclaim of $3,000 would open the path toward $3,131 and potentially $3,287. This would helping Ethereum invalidate the bearish thesis and rebuild confidence among holders.

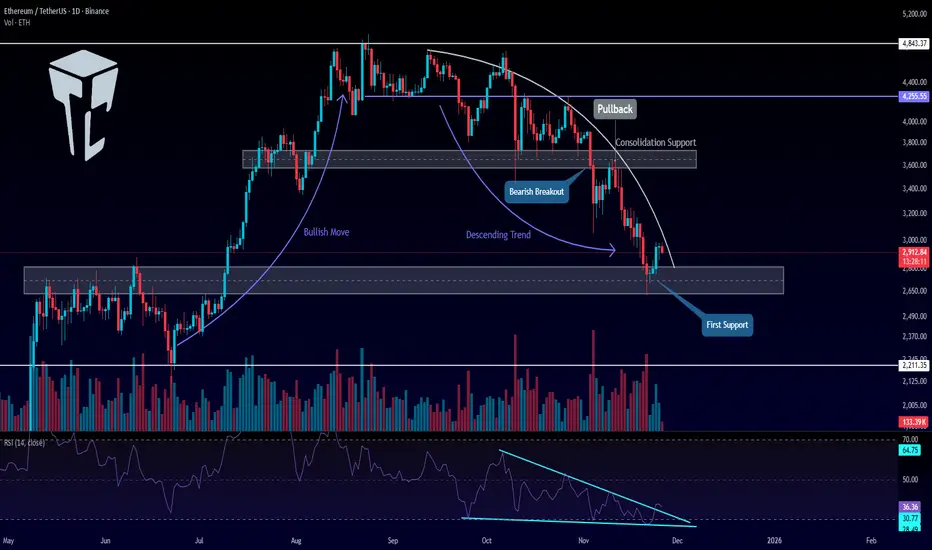
TradeCityPro | Ethereum Eyes Key Levels for Trend Reversal👋 Welcome to TradeCityPro!
Let’s dive into the Ethereum analysis, the queen of the market, ranked 2nd on CoinMarketCap with a $351 billion market cap, right after Bitcoin.
📅 Daily Timeframe
On the daily timeframe, after the upward movement Ethereum made, it reached the 4,843 resistance zone and then entered a consolidation phase.
✅ The bottom of this range was at 3,700, and the middle of the box was at 4,255, which the price reacted to.
🔔 After breaking the lower boundary of the box, the bullish trend Ethereum had came to an end, and a bearish trend with a curved trendline began.
⚖️ After a pullback to the 3,700 zone, a downward move took place, reaching the next support zone at 2,700, and now the price is reacting to the 2,700 zone.
💥 The RSI oscillator formed a descending triangle during this move, which contributed to the increasing bearish momentum in the market.
💡 Now, with the price reaching 2,700, the triangle has broken to the upside, and the bearish momentum has slowed down for now.
🎲 The confirmation of the new bullish momentum will come after breaking the curved trendline and forming a higher high and higher low above the 2,700 level.
📈 The main trigger for Ethereum's bullish trend will be stabilization above 3,700.
⚡️ If the 2,700 level breaks, the next support zone will be at 2,211.
💫 Personally, I’ll try to open a short position on Ethereum if the 2,700 level breaks.
🔼 For a long position, triggers can be found on lower timeframes, but for the main positions, we should wait for the price to form a higher high and higher low.
📝 Final Thoughts
Stay calm, trade wisely, and let's capture the market's best opportunities!
This analysis reflects our opinions and is not financial advice.
Share your thoughts in the comments, and don’t forget to share this analysis with your friends! ❤️
FireHoseReel | TOTAL2 Facing Major 4H Resistance🔥 Welcome to FireHoseReel !
Let's dive into total2 market structure.
👀 TOTAL2 4H Analysis
TOTAL2 has reached its four-hour resistance around the one point two four level and is currently showing a clear reaction and rejection from this zone. This resistance can act as a key barrier for Ethereum and ETH-based altcoins, and a breakout above it could activate their long triggers. A descending trendline has already been broken, and then TOTAL2 hit this resistance with a strong whale-sized bullish candle, which clearly highlights the importance of this level.
RSI Osilator📊
Now focus on the RSI oscillator: it is currently sitting near its local top, and the four-hour overbought level has reached the same area as the resistance. This creates a strong overlap between momentum and price resistance. If the RSI pushes beyond this momentum limit together with a clean breakout of the resistance zone, the market could see a much stronger acceleration.
Triggers Zone 🎯
The short trigger for TOTAL2 is located lower at the support zone. A breakdown below this area could push TOTAL2 lower and lead to a deeper market correction. On the upside, a clean break of the resistance zone would confirm bullish continuation for ETH and related altcoins.
🛞 Risk Management & Disclaimer
Please remember to always use proper risk management and position sizing. Nothing in this analysis is financial advice. The market can change quickly, so always trade based on your own strategy, research, and risk tolerance. You are fully responsible for your own trades.

ETHUSD 8H–EMA Trend Flip Retest, Will Supply Zone Reject Again?Ethereum is rallying into a major confluence zone following a confirmed bearish EMA trend flip, shown when the 50 EMA (yellow) crossed below the 100 EMA (purple). This crossover happened at the exact lower-high region inside the circled area, aligning with the break of structure that kicked off the broader downtrend.
Price is now rebounding from local lows and heading directly into the 3,200–3,350 supply zone — a region stacked with resistance: the descending trendline, the EMA cluster above, and the mid-range Fibonacci retracement levels. Historically, each retest of this zone has triggered strong sell pressure.
With Stoch RSI entering overbought conditions, ETH is reaching this resistance while momentum is cooling, increasing the probability of a bearish reaction. A rejection from the supply zone would put the next lower-low in play. A clean breakout — above both the EMAs and the trendline — would be the first early signal that buyers are attempting to reclaim structure.
Until that breakout occurs, the EMA cross keeps the bias firmly bearish.

ETH Downtrend Strengthens as Sellers Keep Full ControlHello everyone, let’s take a closer look at ETH in the current market context.
ETH is moving in a clearly defined downtrend, where every bounce only manages to reach a Fair Value Gap before being rejected almost instantly. The Lower High – Lower Low structure remains intact, showing that sellers still maintain complete dominance over the market.
On the news side, the picture isn’t any brighter. Bitcoin is stalling at key resistance, weakening flows into altcoins. The ETH spot ETF has offered no fresh catalysts, and the Fed continues reinforcing its “higher for longer” stance. In other words, there’s nothing in the current environment that supports meaningful buying momentum.
Technically, ETH is trading below a thick, downward-sloping Ichimoku cloud. Red FVG zones continue to reject price, and the Volume Profile reveals significant liquidity resting lower — effectively “pulling” price back towards previous trading regions. Every signal is aligning in the same direction.
From my perspective, ETH is likely to slide further into the 2,720–2,740 USDT zone to fill the remaining green FVG. If selling pressure continues at the recent pace, price could even extend toward 2,650 USDT — a high-liquidity area and the nearest structural low.
What do you expect next — a deeper drop or a surprise reversal?

Ethereum - A -40% crash comes first!🪄Ethereum ( CRYPTO:ETHUSD ) will soon reverse:
🔎Analysis summary:
Over the course of the past couple of months, Ethereum failed to create a new all time high. So eventually, we will see a bearish reversal and a major move lower in the future. The bullish triangle remains valid though, so it will be a major buying opportunity then.
📝Levels to watch:
$2,000 and $4,500
SwingTraderPhil
SwingTrading.Simplified. | Investing.Simplified. | #LONGTERMVISION

#ETHUSD 2,700 Strong Support !!We can say that 2,700 has acted as a stable short-term support level. On the positive side:
- ]RSI is at 60 and above its moving average.
- Expectations for a Fed rate cut have strengthened.
- SuperTrend has flipped to a buy signal.
I think the 2,940 support level, which worked previously in July, may hold again and help drive the price higher. After that, a breakout from the descending channel could offer around a 24% upside in the short term.

ETH Approaching Lower Key Zone If Support FailsCRYPTOCAP:ETH is holding the current support zone after a sharp decline, showing its first signs of slowing down. As long as this zone holds, we could see a short-term bounce or consolidation.
But if this support breaks, price may head toward the lower key zone highlighted on the chart.
For now, this support acts as the main level to watch.
DYOR, NFA

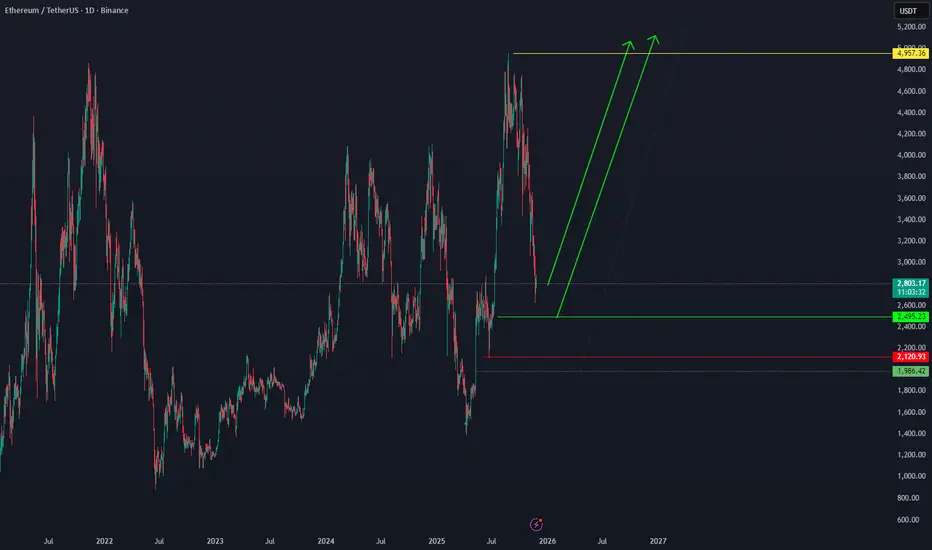
ETH is ready to reach its ATH.Ethereum can start its bullish move from the current price, as well as from 2495 — and in a more pessimistic scenario, from 1983.42 — targeting 4957 and potentially higher. BINANCE:ETHUSDT
ETH/USDTETH remains in a broad consolidation phase.
Price has now reached the lower boundary of the range, bringing the market into a potential long setup zone — but only if proper confirmation signals are present.
As always, patience and validation of conditions are key before considering any long entries.

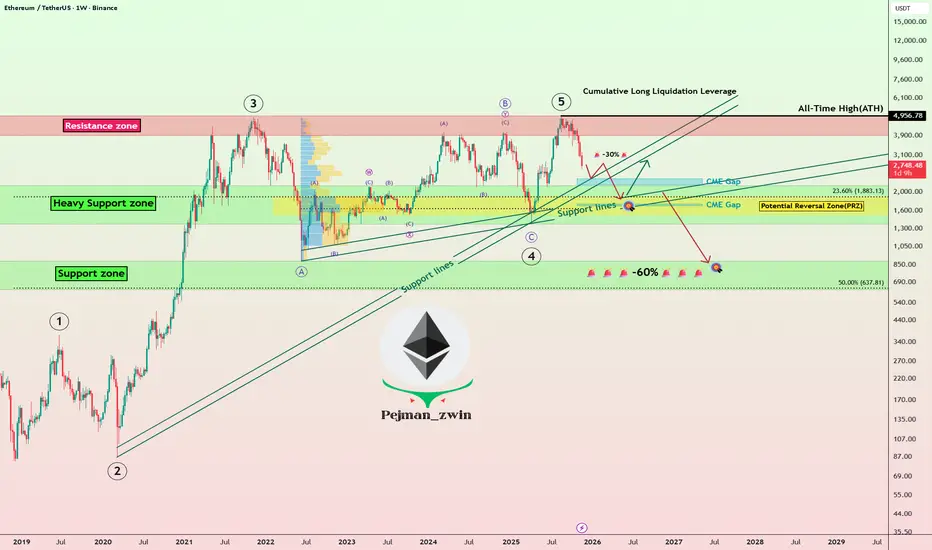
Ethereum Roadmap: Will ETH Bounce or Begin a Deeper Correction!?Today, I’d like to dive into an analysis of Ethereum ( BINANCE:ETHUSDT ). Given that over 80% of tokens in the crypto market are built on the Ethereum blockchain, Ethereum’s performance can serve as a roadmap for other tokens on the network.
So, stay tuned!
In recent times, Ethereum hasn’t been able to keep pace with Bitcoin’s growth and struggled to set a new All-Time High(ATH=$4,956). After Bitcoin’s decline, Ethereum also started to drop and is currently moving near the Heavy Support zone($2,160-$1,370), Support lines, Cumulative Long Liquidation Leverage($1,745-$1,629), and Potential Reversal Zone(PRZ) .
From an Elliott Wave perspective, it seems that Ethereum has completed its main five-wave impulsive. This suggests that we might now be entering a corrective phase. The extent of this correction will depend on multiple factors, and technical analysis alone won’t predict the exact magnitude of Ethereum’s decline in the coming days or weeks. Nonetheless, I’ll keep you updated step-by-step.
Looking at the USDT.D%( CRYPTOCAP:USDT.D ), it’s currently on an upward trend. This rising dominance can lead to further declines in Ethereum, reinforcing the bearish outlook.
Another important index is the US 10-Year Government Bond Yield ( TVC:US10 ). If the US 10-Year Government Bond Yield continues its upward movement, it can put additional pressure on risk assets like Bitcoin( BINANCE:BTCUSDT ) and Ethereum, leading to further declines.
Now, the question is: where might we see Ethereum resume its upward trajectory?
It’s likely that Ethereum will continue its downward movement(-30%), potentially filling the CME Gap($2,344-$2,186), CME Gap($1,745-$1,629) near the $2,000(Round Number). Once it stabilizes around that zone, we could look for signs of a recovery.
However, if Ethereum breaks below its Heavy Support zone($2,160-$1,370), we might face even more significant declines, potentially exceeding -60%.
Where do you think Ethereum will start to rise again? Or are more red days ahead?
💡 Please respect each other's opinions and express agreement or disagreement politely.
📌Ethereum Analyze (ETHUSDT), Weekly time frame.
🛑 Always set a Stop Loss(SL) for every position you open.
✅ This is just my idea; I’d love to see your thoughts too!
🔥 If you find it helpful, please BOOST this post and share it with your friends.
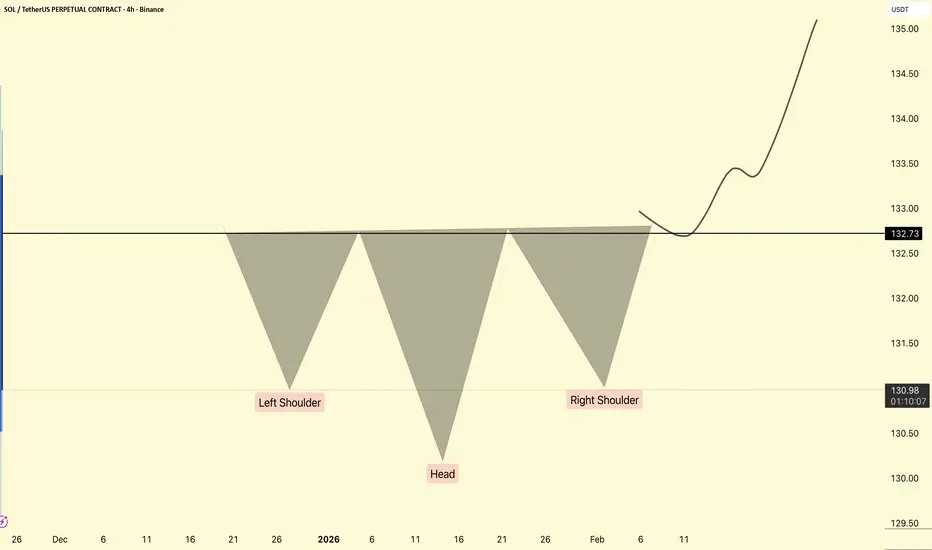
Inverse Head and Shoulders PatternThe inverse head and shoulders pattern is a technical analysis tool used to signal a potential trend reversal from a downtrend to an uptrend.
The inverse head and shoulders pattern is characterized by three consecutive troughs, with the middle trough (head) being the lowest and the two outer troughs (shoulders) being higher and nearly equal. This formation indicates that the downtrend is nearing its end, and a reversal to an uptrend may occur soon. Identifying this pattern can provide traders with a valuable signal to enter a new long position or exit a bearish trade, making it an essential part of technical analysis.
The inverse head and shoulders pattern is the opposite of the head and shoulders pattern. Technical traders widely follow both formations due to their distinct shapes and clear signals as trend reversal patterns.
ETHUSDT: Pullback to 2,900 Before the Next DropLooking at the current price action, ETH is showing the classic signs of a weak market : shallow pullbacks, weak buying pressure , and repeated rejections at key resistance zones. Everything suggests ETH is simply taking a short pause before the next leg down.
On the H4 timeframe, price remains firmly inside the descending channel drawn on the chart. Every time ETH touches the upper boundary of the channel, it gets sold off aggressively — a pattern that has repeated consistently. The 2,900 USDT area above now acts as a confluence resistance zone: it aligns with the channel’s upper boundary and a corrective structure — the perfect place for sellers to step in.
At the moment, ETH is making a minor pullback to retest the 2,900 region, but buying momentum is fading and candles are being pushed down repeatedly. This indicates that a bearish reversal is likely forming. Once rejection confirms, the nearest target is the 2,650 support zone. If bearish momentum accelerates, ETH could slide further toward 2,550.
Reference Scenario
Main Trend: Bearish
Strategy: Wait for ETH to retest 2,900 and SELL
Targets: 2,650 – 2,780 → deeper target: 2,550

The Bitcoin Cycle: A guide to time the next major entryBitcoin could be approaching a cycle low in the next 3-9 months.
Zooming in on the weekly chart, you'll see that price tends to develop a horizontally defined resistance *after* hitting a cycle low and consolidating. Once price breaks out from that resistance, it triggers a buy signal. This is the type of action I want to see to get long with size.
On the topic of cycles, I'll use a paragraph from the first book I read that got me interested in financial markets.
From CYCLES: The Mysterious Forces That Trigger Events
How can one tell, in any given instance, whether or not a
regular rhythm that one discovers is caused by a real underlying
force or merely by chance? Let's begin with some common sense
and simple logic. If a cycle has repeated enough times, with
enough regularity and with enough strength, the chances are that
it is significant. Such regularity cannot reasonably be mere accident.
Bottom line: A cycle's reliability is based on how well it repeated that cycle in the past. I will assume the cycle in this post remains in play, and will use it as my guide to help time the next major entry. The key thing is to enter based on a signal rather than buy just because price is in the cycle low range. The cycle just adds to the weight of evidence and helps with timing - it is NOT the signal.

BTC Loses 50 EMA: Can the 10 EMA Hold?#BTC/USDT has slipped below the 50 EMA, which was acting as dynamic support. However, price is now showing a small bounce around the 100 EMA. If Bitcoin manages to hold this level, we could see a healthy rebound from here.
But if it fails to maintain this support, further correction in the coming days becomes likely.
DYOR, NFA
Please hit the like button if you like it, and share your views in the comments section.

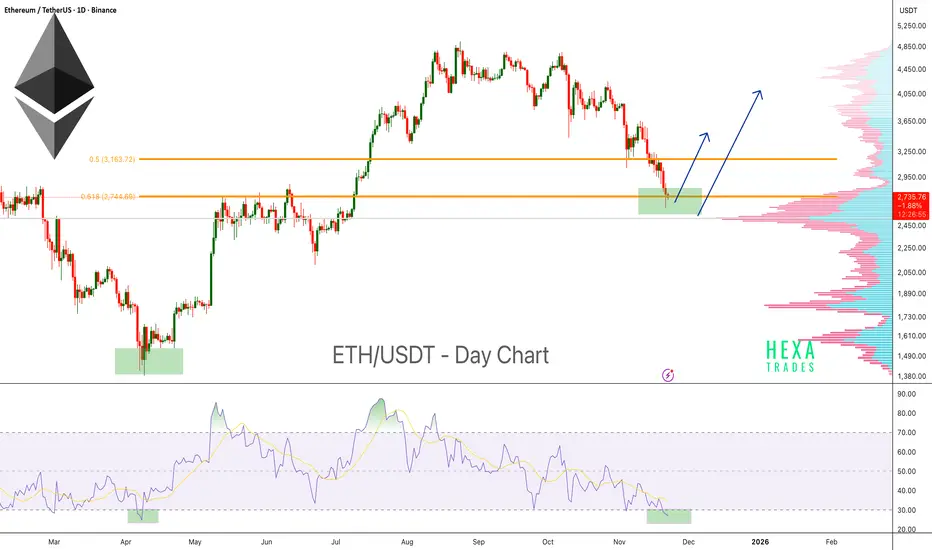
Ethereum Approaching Reversal Zone!Ethereum is currently trading at a major support zone, an area where price has historically shown strong reactions and multiple bounces. This demand zone has acted as a key reversal region several times, and ETH is once again testing it.
Price is also sitting near the 0.618 Fibonacci retracement (Golden Zone), which is commonly used to identify potential reversal points during market corrections.
The Volume Profile shows a high-volume node exactly at the current support area, indicating strong interest and previous accumulation. This increases the probability that this zone will act as a strong support.
On the momentum side, the RSI has entered oversold territory once again. Historically, whenever ETH’s daily RSI dipped below 30, it marked strong bottom areas followed by significant bounces.
Key Highlights
- ETH retesting a major historical support zone.
- Trading inside the 0.618 Fibonacci Golden Zone.
- Daily RSI oversold (<30) — historically a strong bounce region.
- Volume Profile high-volume node aligns with support, increasing the strength of the zone.
- Potential for a short-term reversal if the support continues to hold.
Cheers
Hexa