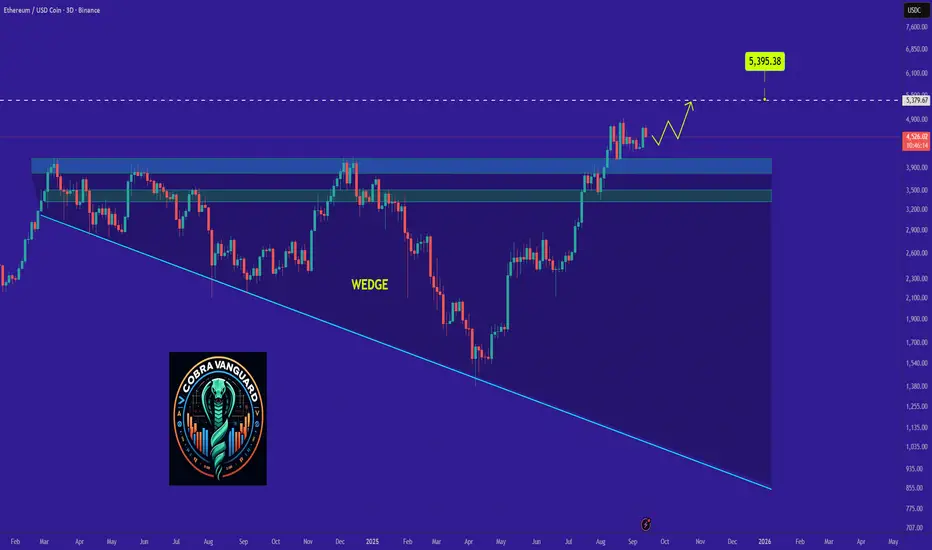
ETH's Situation, A Comprehensive Analysis !!!As discussed in the previous analysis, the price has finally broken the wedge, and now, with a slight pullback, it could reach above $5k.
PREVIOUS ANALYSIS
ETHUSDT
#ETH/USDT Testing Wedge Breakout Amid Key Support#ETH
The price is moving within a descending channel on the 1-hour frame, adhering well to it, and is heading for a strong breakout and retest.
We have a bearish trend on the RSI indicator that is about to be broken and retested, which supports the upward move.
There is a major support area in green at 4480, which represents a strong support point.
For inquiries, please leave a comment.
We are in a consolidation trend above the 100 Moving Average.
Entry price: 4524
First target: 4585
Second target: 4645
Third target: 4715
Don't forget a simple matter: capital management.
When you reach the first target, save some money and then change your stop-loss order to an entry order.
For inquiries, please leave a comment.
Thank you.

ethereum bullishThose who say Ethereum is dead with every drop will witness the demise of bears with every rise.

Long ETHUSDTHello traders!
After a succesful break above resistance, I'm looking for this scalp long.
Don’t forget to like and share your thoughts in the comments! ❤️

ETH/USDT Technical Outlook: Demand Layer Entries vs Trap Risk🚀 ETH/USDT | Ethereum vs Tether 💎
Crypto Market Money Looting Plan (Swing/Day Trade)
📌 Trade Plan (Bullish Outlook)
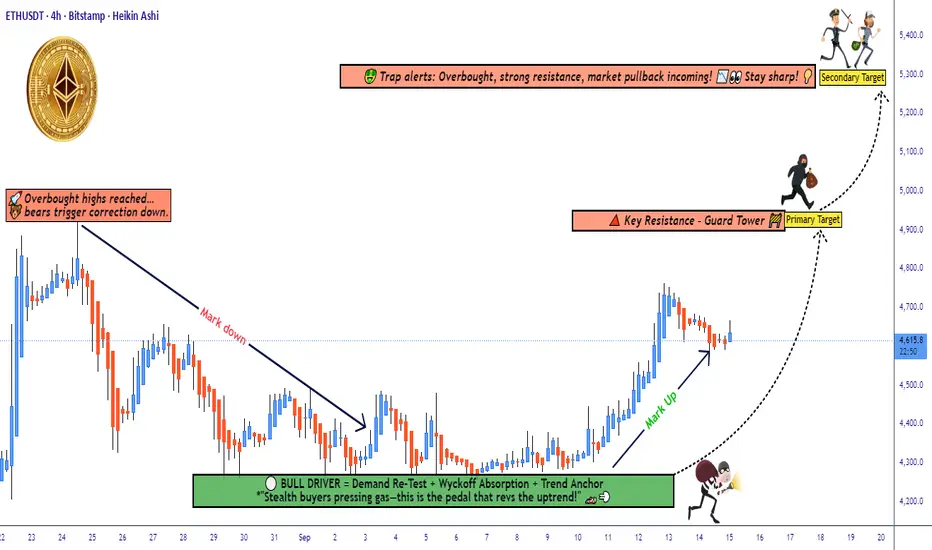
Setup: Demand Re-Test ✅ + Wyckoff Absorption 🔑 + Trend Anchor ⚓ (buyers confirmed presence)
Entry Style (Thief Layers 🪙): Using layered limit entries — examples: 4500, 4550, 4600, 4650 (you can add more layers as per your own method).
Stop-Loss (Protect the Vault 🔒): Example zone near 4400 after breakout. Adjust SL to fit your own risk appetite & personal strategy.
Target 🎯:
🎯 Primary: 4900 (local resistance)
🎯 Secondary: 5300 (major resistance / overbought zone)
🧾 Notes for Thief OG’s
This plan is not financial advice, only an idea. Always manage your own entries, SL, and TP.
Think of it as a vault strategy: take money, then protect money.
🔗 Related Pairs to Watch
BINANCE:BTCUSDT → ETH often follows BTC’s momentum. A BTC breakout/false move can affect ETH.
BINANCE:ETHBTC → Good pair to confirm ETH’s relative strength vs BTC.
BINANCE:SOLUSDT & BINANCE:BNBUSDT → Correlated majors; watch for rotation of capital in altcoins.
✨ “If you find value in my analysis, a 👍 and 🚀 boost is much appreciated — it helps me share more setups with the community!”
#ETH #Ethereum #Crypto #USDT #Altcoins #SwingTrade #DayTrading #LayerStrategy #Wyckoff #ThiefPlan #TradingView #CryptoTrading
Volatility Period: Around September 7th (September 6th-10th)
Hello, traders!
Follow us to get the latest information quickly.
Have a great day!
-------------------------------------
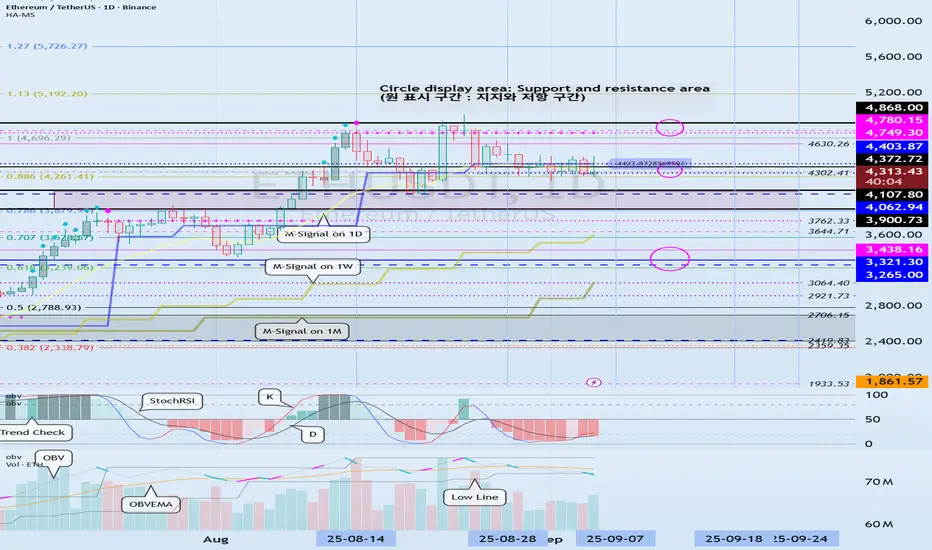
(ETHUSDT 1D Chart)
This volatility period is around September 7th (September 6th-10th).
After this period of volatility, the key question is whether the price can find support and rise above the 4403.87-4749.30 level.
-
To continue the cascading upward trend, the price must rise above 4749.30.
Therefore, we need to monitor whether the price maintains above the 4749.30-4868.0 level.
-
If resistance is encountered at 4403.87 and the price declines, it is likely to decline until it meets the HA-Low indicator.
Therefore, we need to check for support around 4302.41-4403.87.
However, there is a possibility of a rise after touching the previous all-time high (ATH) range of 3900.73-4107.80, so we need to consider a response plan.
If the price falls below 4107.80, it is expected to touch the M-Signal indicator on the 1W chart and resume the trend.
-------------------------------
The On-By-Signal (OBV) indicator is falling below the Low Line.
The TC (Trend Check) indicator is below 0.
The K value of the StochRSI indicator is showing signs of rising from the oversold zone.
If the High Line of the OBV indicator falls and forms a downward channel, it is highly likely that selling pressure will continue to dominate, so caution is advised when trading.
Therefore, the key issue this time is whether support is found around 4302.41-4403.87.
The TC (Trend Check) indicator is a comprehensive evaluation of the StochRSI, On-By-Signal (OBV), and PVT-MACD Oscillator indicators.
Therefore, if the TC indicator is below 0, selling pressure is dominant, and the price is likely to decline.
If the K value of the StochRSI indicator continues to rise, the price is likely to rise after this period of volatility.
However, for the uptrend to continue, the OBV and TC indicators must show upward trends.
-
Thank you for reading to the end.
We wish you successful trading.
--------------------------------------------------
- Here's an explanation of the big picture.
(3-year bull market, 1-year bear market pattern)
I'll explain more in detail when the bear market begins.
------------------------------------------------------
ETH/USDTI’m watching for a potential correction into the 4300–4400 zone.
📈 Bullish Scenario (Preferred):
If price corrects into 4300–4400, I’ll look for confirmation signals to enter long.
Upside targets: 5000–5200.
✅ Plan: No longs without confirmation.

ETH/USDT 1D chart review🔎 Technical analysis
1. Trend
• You can see a clear growth trend line (orange). The price consistently reflected from her, which means that the buyers defend this level.
• Currently, the price is above trendline, which is a bull signal.
2. Support and resistance
• Support:
• $ 4,429
• USDT $ 4,556
• resistance:
• $ 4.687 USDT (current price fight - this is where the market is testing)
• USD 4,793 (strong resistance)
• USD 4,954 (key psychological resistance - nearly 5K)
3. Candles
• We have a long green up move - the momentum is strong.
• The last candles show a little indecisive at 4.687 (upper shadows), i.e. possible consolidation or back.
4. STOCHASTIC RSI (oscillator at the bottom of the chart)
• enters the purchase zone (> 80).
• This often heralds correction, but in strong trends the indicator can last long.
⸻
📊 Scenarios
• bull (continuation of growth):
If ETH stays above 4.687 and pierces 4.793, the next goal is 4.954 (and then psychological 5,000).
• Bear (correction):
Rejection 4.687 and descent below 4.556 can open the way to the Trendline test around 4.430.
Puncting the trend down is a reversal signal and a possible drop towards 4.200.
⸻
📌 Summary
• Main trend: upward.
• Momentum: Strong, but the indicators show buying.
• Strategy:
• Careful entrances with support (4.556 / 4.430).
• confirmed breaking 4.793 = strong signal for further increases.
• Stop loss below Trendline (~ 4,400), because it will negate the current script of the bull

Ethereum at a Critical Resistance Zone – Will $4,800 Hold or Bre📝 Analysis:
Ethereum (ETH/USDT, 4H) is testing a critical resistance zone at $4,700–$4,800, where several technical factors converge:
1. Descending Channel:
Price is touching the upper boundary of the long-term descending channel.
2. Fibonacci Extension:
The recent rally has reached the 1.618 Fibonacci extension (~$4,720), which often acts as a potential reversal zone.
3. Resistance Cluster:
The $4,700–$4,800 area combines both static resistance and the channel top, making it a high-risk region for buyers.
4. Wave Structure:
The strong rally from ~$4,050 could be part of a corrective wave (possibly Wave D). If ETH fails here, we may see a sharp pullback.
⸻
📊 Scenarios:
🔸 Bearish Case (more likely):
Rejection from $4,720–$4,800 could trigger a correction toward:
• First support: $4,580–$4,600
• Key support: $4,100–$4,200
🔸 Bullish Case (conditional):
A daily close above $4,800 would confirm a breakout from the channel, opening the door for targets at:
• $4,950–$5,000
⸻
📌 Conclusion:
ETH is at a make-or-break level. Failure to hold above $4,800 could bring a strong correction, but a confirmed breakout may fuel a run toward $5,000.

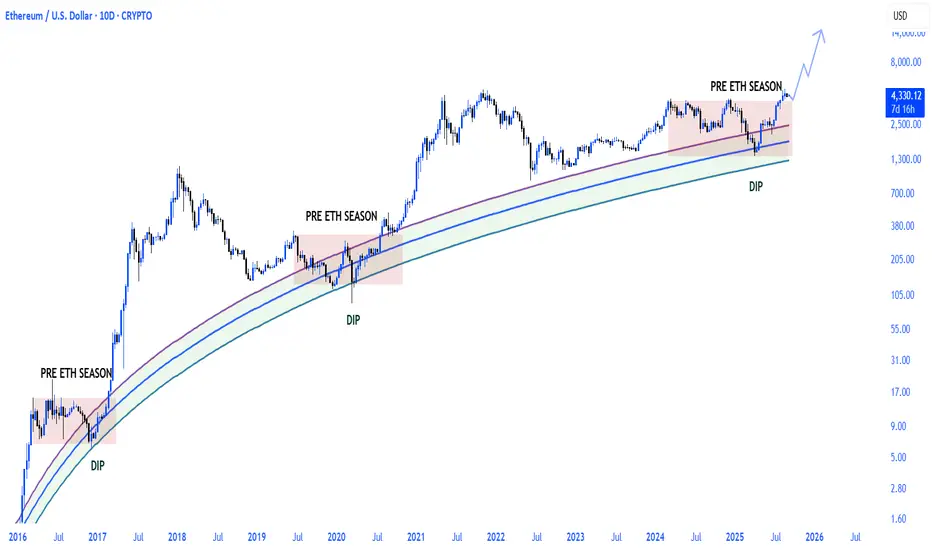
bitcoin vs. ethereum 2017\2025Bitcoin and Ethereum literally mirrored 2017.
CRYPTOCAP:BTC to $200k \ CRYPTOCAP:ETH to $10k

ETH/USD –> Falling Wedge Breakout Within Ascending ChannelHello guys!
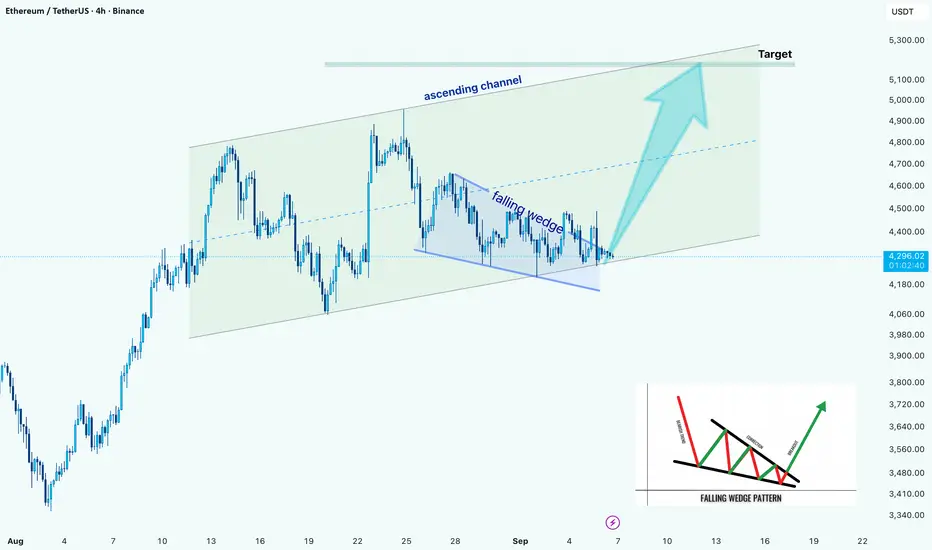
Ethereum is showing a strong technical setup on the 4H chart. Price has been respecting an ascending channel since early August, and within this structure, a falling wedge has recently formed.
Right now, ETH is testing the wedge breakout point near the bottom line of the channel. If buyers manage to hold momentum here, we could see price extending toward the channel’s upper boundary, with the next major target sitting around $5,100 – $5,300.
On the downside, failure to sustain above the wedge support may lead to a retest of the lower channel trendline around $4,100 – $4,150, which remains a critical support area for bulls to defend.
ETH/USDT: Bullish Rise to 4580? BINANCE:ETHUSDT is gearing up for a bullish move on the 4-hour chart , with an entry zone between 4200-4250 near a key support and trendline. 🎯
The target at 4580 aligns with the next resistance, signaling strong upside potential. 📈 Set a stop loss on a close below 4000 to manage risk effectively.
Be patient until the price reaches the Entry Zone . If it doesn't, don't worry. The market is always alive and always gives us good trading opportunities.💡
Ready for this lift-off? Drop your take below! 👇
📝 Trade Plan:
✅ Entry Zone: 4200 – 4250 (support + trendline confluence)
❌ Stop Loss: Close below 4000 to manage risk
🎯 Target: 4580 (next resistance level)

Ethereum Trade Setup - Sep 12th📲 NFX Trade Alert – Swing Setup
💹 Instrument: BINANCE:ETHUSD Ethereum (ETHUSD.r)
🛒 Trade Type: Swing – Buy at Market
📍 Entry: $4,540
⛔ Stop Loss: $4,450
✅ Target Profit: $4,950
📊 Trade Setup Analysis – Ethereum
Ethereum has finally broken through the $4,500 block order, which is now acting as solid support after multiple rejections on both the H1 and H4 timeframes.
With this breakout confirmed, price has no significant resistance until $4,650 (minor) and $4,850 (major). This opens the path for higher prices in the near term.
⚖️ As always, manage risk carefully — even a high-probability setup requires discipline and protection.💚

$ETH Breakout Signals 10% Upside PotentialCRYPTOCAP:ETH has broken out of its downtrend and reclaimed support around 4.5K.
If it holds, momentum could push toward 5K, nearly a 10% move.
DYOR, NFA

ETH Bulls Target $5,200 Next — Is $5,500 Around the Corner?ETH looks like it’s exiting a sideways/accumulation band and moving back into a bullish regime on the 4-hour chart. The structure recently shifted from range-bound to higher lows → higher highs, which is the first quality check for a sustainable push higher. The move is not yet a blow-off — it’s a controlled attempt to reclaim higher resistance.
On the chart I see three clean bands to treat differently:
• Near-term supply (resistance) sits just under ~$4,950 and extends to ~$5,200. Price has to clear and hold above this zone to confirm a larger breakout and give bulls runway to $5,500+.
• Immediate control / pivot is roughly the present area near $4,500–$4,550 (where buyers re-entered). This zone now acts as short-term support if price holds.
• Lower structural demand is near $4,220 (primary invalidation for this bullish thesis) and below that $3,940 is the deeper cushion where previous buyers stepped in strongly.
Price behavior to watch: a clean 4H close above $4,950 with follow-through opens the path to $5,200; failure there (rejection on heavy tails) turns the move into a “bull trap” and would require caution. Conversely, a breakdown and decisive 4H close below $4,220 invalidates the bullish plan and suggests revisiting lower structural supports.
________________________________________
Level-by-level careful analysis (why each matters)
• $4,220 (primary support / invalidation) — multiple prior reactions here: a daily/4H close below this suggests sellers regained control and the bullish case fails. Use this as your hard invalidation.
• $4,500 – $4,550 (current control / entry zone) — recent buyers defended this band; it’s where new longs are being accumulated. A hold/clean bounce here is a good risk-controlled entry region.
• $4,950 (first major resistance) — the choke point. This is where supply historically clustered; a close above with volume / hourly follow-through confirms breakout. Partial profit-taking is logical here even if continuation follows.
• $5,200 (secondary resistance / breakout confirmation) — significant supply cluster; a sustained break here targets extension to $5,500+.
• $3,940 (deep support / liquidity pool) — if price collapses through $4,220 this is the next magnet where buyers likely re-appear.
________________________________________
Numeric recap (all important numbers — copy/paste friendly)
• Current price area to watch: $4,500 – $4,550
• Hard invalidation (stop area): $4,220
• Short-term target / TP1: $4,950
• Breakout confirmation zone / TP2: $5,200
• Extended target / TP3: $5,500+
• Deeper demand if invalidated: $3,940
Estimated risk/reward (if entry ~$4,520 & SL $4,220):
• Risk = $300 (4,520 − 4,220)
• Reward to TP1 = $430 → R:R ≈ 1.43 : 1
• Reward to TP2 = $680 → R:R ≈ 2.27 : 1
• Reward to TP3 = $980 → R:R ≈ 3.27 : 1
________________________________________
📈 Trade setup (bullets only)
• Entry: buy $4,500 – $4,550 (prefer a constructive 4H bounce inside this zone)
• Stop-loss: $4,220 (clean 4H close below = invalidation)
• Take Profit 1 (TP1): $4,950 → take 30–40% off
• Take Profit 2 (TP2): $5,200 → take another 30–40%; move remaining to breakeven
• Take Profit 3 (TP3): $5,500+ → leave a small runner, trail stop under 4H higher lows
• Trailing stop plan: after TP1, trail SL to breakeven; after TP2, trail SL under each successive 4H higher low or use 1.5× ATR(20,4H) for dynamic trailing
• Risk per trade: keep at 1–2% of account equity; size position so $300 risk equals your dollar risk cap
________________________________________
Execution & risk notes (brief)
• Prefer confirmation: either a clean 4H bounce from $4,500–4,550 or a clean 4H close above $4,950 (for breakout entries).
• Expect whipsaws near $4,950; partials at TP1 reduce exposure to false breakouts.
• If macro events/US data are due, reduce size or wait for post-event clarity — ETH can gap around high-impact crypto or macro news.
• Re-evaluate if price closes below $4,220 on 4H — cut and re-plan.
________________________________________

ETHUSDT – The “BIG” Wave Is Coming ?Hello everyone, glad to see you again as we dive into BINANCE:ETHUSDT !
Today, Ethereum continues to show strong accumulation as it consolidates tightly around the 4,200 USDT support zone. This area is being strongly defended and also aligns with key retracement levels on higher timeframes, suggesting that the bulls are far from giving up.
At the moment, ETH is in a “compressed spring” state – the longer it moves sideways, the stronger the breakout potential. If the support holds, we could see a powerful bullish wave emerge, with the potential to test resistance and even break higher. Smart traders know: accumulation equals opportunity!
What about you – do you think ETH will break through or bounce back from the 4,800 USDT resistance? Share your thoughts in the comments below!

ETH 4H Analysis - Key Triggers Ahead | Day 19😃 Hey , how's it going ? Come over here — Satoshi got something for you!
⏰ We’re analyzing ETH on the 4-Hour timeframe.
🔭 ETH 4H Chart: Observing Ethereum on the 4-hour timeframe, after breaking the midline of the box, ETH closed above the box. Then, following the news, it formed a shadow that hit the lower box level, triggering a series of buy orders. Now, we’re watching to see if ETH will continue upward. The overall trend behind ETH is still bullish, and a breakout above the multi-timeframe range could push it toward the box’s top again.
⛏ Key RSI Levels: ETH’s RSI is around 70 and 50. A breach of these levels could signal the start of a move, especially following today’s inflation news impact.
💰 Candle Size & Volume: Green candle sizes and volume have increased. Yesterday, $164M of ETH was bought via ETFs, which is notable.
🪙 ETHBTC 4H Chart: Observing the ETH/BTC pair on the 4-hour timeframe, this pair tends to act slightly more precisely compared to ETH/USDT. Currently, it’s trading within a box with declining volume. News caused a reaction at the top of the box. If the box’s top breaks, a significant amount of BTC could convert into ETH, potentially pumping the ETH/USDT pair as well.
🔔 Entry & Target Zones: A potential early entry is around $4443, with the box top at $4500 — a strong resistance. If ETH breaks this level, it could aim for a new ATH. Make sure to confirm across multiple timeframes before taking a position.
❤️ Disclaimer : This analysis is purely based on my personal opinion and I only trade if the stated triggers are activated .

Trade Insight BTC, ETH & GOLD📢 NFX Market Update – BITSTAMP:BTCUSD BTC, BINANCE:ETHUSD & FX:XAUUSD
Similar to Ethereum, Bitcoin (BTCUSD.r) is facing a potential heavy block order between 114,750 – 115,000. On the H1 chart, a divergence formation is signaling the risk of a short-term retracement. Price is consolidating, and I expect a pullback toward the ascending triangle breakout zone, which now acts as support.
Given current volatility and conflicting signals, I strongly recommend staying off trading on Ethereum, Bitcoin, and Gold until the market cools off and provides a clearer direction.
Patience here is key - let the market reveal its next move before stepping in.💚

ETHUSDT in Strong Uptrend: What's Next?Hey everyone, what do you think about ETHUSDT?
ETHUSDT is currently moving in a strong upward channel, hovering around 4427 USD, with a 1.85% increase on the day. This rally is driven by strong institutional inflows, favorable monetary policies, and the continuous development of the Ethereum ecosystem. Technical indicators such as the EMA 34 and EMA 89 continue to support the uptrend, especially as ETH breaks through short-term resistance levels.
With the current momentum, ETH could aim for a target of 5400 USD in the near future, if the buying pressure remains steady. If you're watching ETH, this is an ideal time to consider potential trading opportunities.
What do you think about ETHUSDT? Is this upward trend sustainable? Feel free to share your thoughts and join the discussion on ETH's potential moving forward!

$ETH doesn’t look done pumping yetCRYPTOCAP:ETH doesn’t look done pumping yet. While it’s screaming for consolidation, past cycles suggest another leg up toward $5,200–$5,400 or even higher at $6,000 before hitting critical overbought levels.
The likely scenario, if history repeats, is a sharp correction back to the EMA 50. However, strong institutional inflows could front-run this, pushing CRYPTOCAP:ETH higher without ever revisiting $4,000.
MACD and RSI are extended, but price action remains resilient. CRYPTOCAP:ETH can stay overbought longer than expected before finally flipping bearish.
No bearish divergeance, just a nice pump.
Bottom line: CRYPTOCAP:ETH still looks bullish, with 20–50% upside from here likely. But momentum is heating up, so it may be wise to gradually secure profits before the inevitable pullback.
DYOR

ETH 4H Analysis - Key Triggers Ahead | Day 18😃 Hey , how's it going ? Come over here — Satoshi got something for you!
⏰ We’re analyzing BTC on the 1-Hour timeframe.
🔭 On the 4-hour timeframe of Ethereum we can see that ETH is clearly in a very strong consolidation, and for several days even the oscillator has been ranging around the 50 zone. This time-based range will eventually come to an end. Ethereum now has two important levels ahead with the upcoming news: the top of the box midline at $4373, where breaking this zone could trigger a strong pump, and the bottom zone, which is a maker-buyer area at $4252, considered a very strong and important support for Ethereum.
⛏ The key RSI levels for Ethereum are at 57 and 40. If the range of oscillation crosses these levels, ETH could gain more volatility and even move toward its overbought or oversold regions. Usually, this type of short-term consolidation ends with a good price move once the compression is broken.
💰 The size, volume, and number of green candles have really decreased, and multiple candles inside the range have formed, creating a decision-making phase for ETH. With today’s PPI news, it is likely that one of these zones will either be touched or broken, and after this news, candles are expected to come with stronger volume.
🪙 On the 4-hour timeframe of the ETHBTC trading pair we can see that it is in a descending continuation channel. Each time the price has reached the top or bottom of this channel, it has reacted with a reversal and then moved in the opposite direction. Currently, ETHBTC is above its midline and has shown a positive reaction to it. The volatility of this pair has significantly decreased in recent days and is now ranging under its 50 zone. A breakout above the channel top and the 0.03893 level could start a bullish move.
💡 The zones we are considering for Ethereum’s top and bottom are $4493 and $4252. Breaking either of these levels after this multi-day consolidation could start a strong trend and even a sharp directional move! Keep in mind that war and economic news have created interconnections for risky markets—trade with low risk.
❤️ Disclaimer : This analysis is purely based on my personal opinion and I only trade if the stated triggers are activated .

ETHUSDT – Sideways with Long-Term OpportunitiesCurrently, ETHUSDT is trading in a sideways range, fluctuating between key support and resistance levels. After facing resistance at 4,360 USD, the price has corrected and is now moving within the range of 4,170 USD – 4,360 USD. The market is lacking decisiveness and there are no strong signals to break these levels.
On the H4 chart, ETHUSDT remains below the downtrend line, indicating hesitation in breaking out. The price has not been able to surpass EMA34 and EMA89, reflecting uncertainty in the trend.
In this sideways market, the price could continue to fluctuate within the 4,170 USD support and 4,360 USD resistance. If a breakout occurs, ETHUSDT may target higher levels, especially if strong capital inflows continue.
Overall, the sideways trend still dominates. However, the market could change quickly if macroeconomic factors or shifts in monetary policy and major events come into play.
