ETH Game PlanETH Game Plan
📊 Market Sentiment
Market sentiment remains strongly bullish as the FED is expected to deliver a 0.25% rate cut, with speculation building for a possible 0.5% cut in September. Monetary policy shifts are being driven by both inflation trends and weakening labor market data. The latest August and September job reports were soft, signaling that the economy is cooling rapidly. This environment continues to fuel expectations for a major bullish run in the weeks ahead.
📈 Technical Analysis
Price has shown strong HTF bullish momentum, recently reaching all-time highs.
Currently, ETH appears to be in an accumulation phase, gathering liquidity and energy before the next expansion higher.
📌 Game Plan
Price should run the $4200 level, which is equal lows and likely contains significant liquidity.
I will then look for a close back above $4200 with a newly formed 4H demand zone.
🎯 Setup Trigger
4H structure break following the liquidity run.
📋 Trade Management
Stoploss: 4H swing low confirming the BOS
Targets:
TP1: $4500
TP2: $4650
TP3: $5000 (All-Time Highs)
💬 Like, follow, and comment if you find this setup valuable!
⚠️ Disclaimer: This content is for informational and educational purposes only and does not constitute financial, investment, or trading advice. Always do your own research before making any financial decisions.
ETHUSDT

ETH 1H Analysis - Key Triggers Ahead | Day 17💀 Hey , how's it going ? Come over here — Satoshi got something for you!
⏰ We’re analyzing BTC on the 1-Hour timeframe.
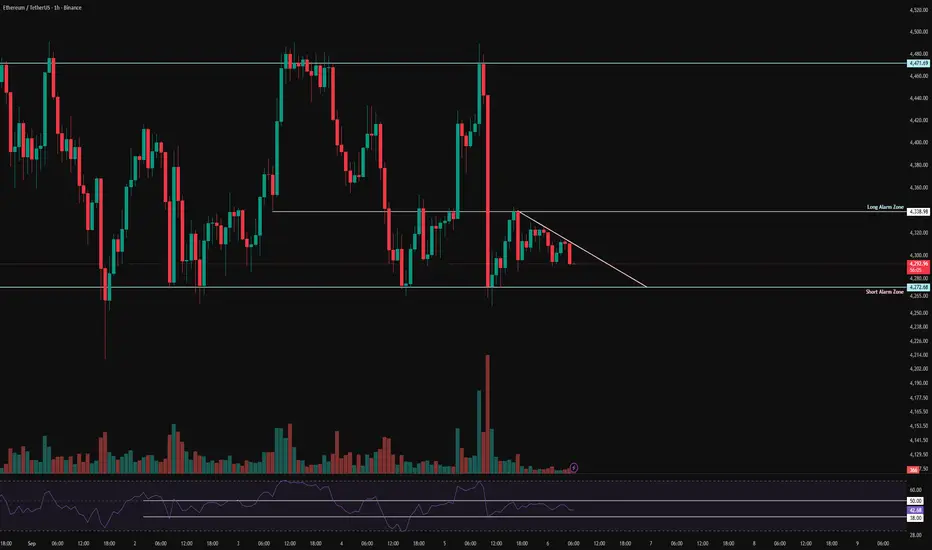
🔭 On the 1H timeframe for Ethereum (ETH), price rejected strongly from the 4336$ resistance and started moving lower. ETH is now trading close to its support zone at 4286$, having recently broken out of a consolidation range.
⛏ On the RSI, the key levels are 70 and 37. A move beyond these zones could trigger momentum toward either overbought or oversold conditions. Keep in mind that volatility is still closely tied to macroeconomic news.
💰 Candle structure shows increasing red candle size and volume, signaling stronger selling pressure. With ETH being heavily involved in both futures contracts and DeFi markets, much of this move reflects profit-taking and sell pressure at higher levels.
🪙 Looking at the ETHBTC pair on the 1H, the chart shows a steady downtrend within a compression zone. If ETH loses its current support, the pair could extend further down. The volatility index for this pair is sitting at 45.52, below the 50 zone, and with short positions picking up, ETH could face additional sell pressure.
💡 The current zone ETH is trading in looks like a maker-buy area, but likely to be broken by whale candles.
For short positions : The better setup would be to wait for a whale candle break, then enter on the pullback for higher win rate.
For long positions : A clean breakout above 4336$ would allow for an order stop-buy entry or a pullback + candlestick confirmation setup to get in long.
⚠️ Note: Today looks like a high-impact day with global shifts in play—trade with reduced risk.
❤️ Disclaimer : This analysis is purely based on my personal opinion and I only trade if the stated triggers are activated.

ETHUSDT - UniverseMetta - Analysis#ETHUSDT - UniverseMetta - Analysis
Potential trend continuation – focus on Wave 5
📆 W1 – Weekly Timeframe
🔹 Price has broken above and confirmed support at a key level
🔹 A retest of the breakout level may precede the launch of a new Wave 5 in the uptrend
🔹 Alternatively, a deeper ABC correction could develop before continuation
📉 D1 – Daily Timeframe
🔹 A symmetrical triangle has formed and price has broken above the trendline
🔹 This may mark the beginning of a new impulse within an ABC structure
🎯 Short-term upside targets for a breakout:
• $4,782
• $4,964
⏳ H4 – 4H Timeframe
🔹 A potential Wave 3 to the upside is forming
🔹 Entry confirmation comes after price breaks above the 1st wave high and holds above the trendline
🔹 Stop-loss placed below the low of Wave 1
🎯 Trade Setup:
#ETHUSDT #BUY
Entry: 4,452.98
Take Profits (TP):
• 4,782.58
• 5,098.05
• 5,428.12
• 6,183.11
Stop Loss: 4,200.47
‼️ Total risk should not exceed 1–3% of your portfolio
This signal/idea is not investment advice
Always conduct your own analysis before entering the market

ETH 1H Analysis - Key Triggers Ahead | Day 16💀 Hey , how's it going ? Come over here — Satoshi got something for you!
⏰ We’re analyzing ETH on the 1-Hour timeframe.
🔭 On the 1H timeframe for Ethereum, we can see that ETH has broken through its resistance zone at $4332. A pullback and consolidation above this level could give us strong trading opportunities. From a multi-timeframe pattern perspective, ETH is still trading inside a larger box, with significant distance remaining to the box’s upper boundary. If ETH confirms this breakout, the next resistance level sits around $4480, and a break above that could push ETH outside of its current range.
⛏ The key RSI zones are 70 and 37. If momentum crosses above 70 into Overbought territory, ETH could continue its current bullish trend.
💰 The size and volume of recent green candles on ETH have been increasing, supported by strong buying. The compressed range structure built during the weekend has now been broken with higher buying volume and the clearing of sell orders. As long as open interest remains strong, ETH has room to move higher.
🪙 Looking at the ETH/BTC pair on the 1H timeframe, it faked out below the marked support level and is now pushing upward. The key resistance here is at 0.03883, and a confirmed breakout above this level could fuel further upside for ETH against USDT.
💡 Currently, Ethereum is sitting in a crucial zone. Multi-timeframe confirmation above this level could give us a clean long setup. The immediate resistance zone is $4332, while further resistance levels can be mapped out with a Fibonacci retracement.
❤️ Disclaimer : This analysis is purely based on my personal opinion and I only trade if the stated triggers are activated .

ETHEREUM TO BREAKOUTEthereum is holding above September's pivot at $4,230, and when the yellow resistance line is broken, it may start the rally again and $4775 can be the first target

ETH 4H Analysis - Key Triggers Ahead | Day 15💀 Hey , how's it going ? Come over here — Satoshi got something for you !
⏰ We’re analyzing ETH on the 4-Hour timeframe .
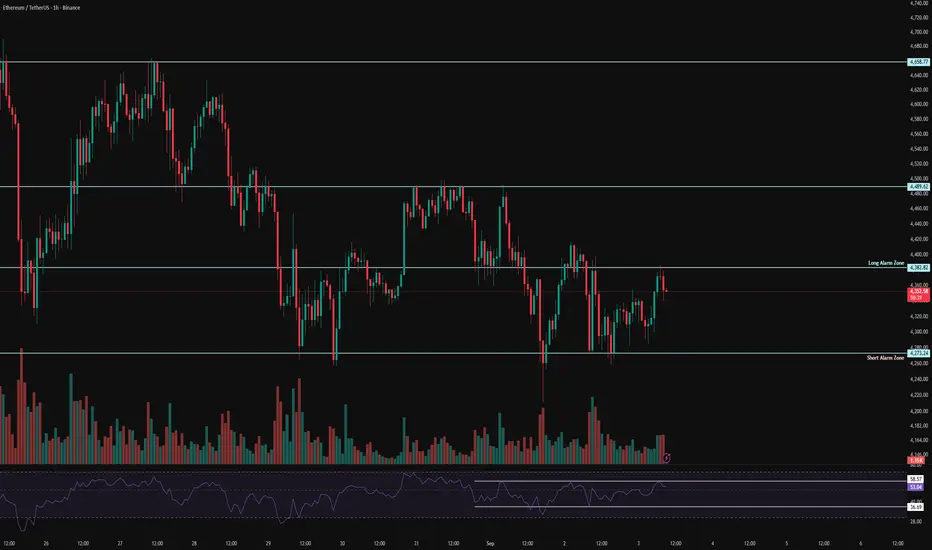
🔭 On the 4-hour timeframe for Ethereum, we can see that ETH is currently moving inside a very strong box and is preparing for this week’s upcoming news. The resistance (ceiling) of this box sits at $4,471, while the support (floor) is around $4,254. Once either of these levels is broken, Ethereum could make a strong move after this long consolidation phase. There’s also an early trigger zone at $4,332; if ETH breaks and stabilizes above this level, we can consider entering a position toward the top of the box.
⛏ Key RSI levels for Ethereum are at 58 and 40. Breaking these ranges could signal the start of a strong move. With increased volatility, ETH could even push toward the overbought (OB) or oversold (OS) zones.
💰 Currently, the size and volume of candles have dropped significantly — something we often see during holiday sessions. But with the start of the new week and upcoming economic reports, Ethereum could generate bigger candles and stronger momentum once it breaks out of this box.
🪙 Looking at the ETHBTC pair on the 4-hour timeframe, the chart still looks bearish with decreasing volume. The current zone is considered a maker-buyer area, and we’ll need to watch how the whales react here. If this level is lost, Ethereum could face a deeper correction and move toward its lower support levels.
💡 Ethereum currently has 3 alarm zones:
A short alarm zone at the bottom of the box — if broken, it could trigger stronger selling pressure.
A long alarm zone #1 at $4,332, acting as an early trigger for a potential breakout toward the top.
A long alarm zone #2 at $4,471 — breaking and holding above this level could lead to a solid upward move.
❤️ Disclaimer : This analysis is purely based on my personal opinion and I only trade if the stated triggers are activated .

Ethereum (ETH/USDT) – Neowave UpdateEthereum continues to move inside a short-term descending channel. Based on the Neowave count, the current structure can be interpreted as wave G of a Diametric pattern.
🔑 Main Scenario:
• If ETH manages to hold above 4315, buyers could regain control.
• In that case, a move toward the channel’s upper boundary around 4410 is likely, completing wave G of the Diametric.
⚠️ Alternative Scenario:
• Failure to sustain above 4315 will keep the bearish tone intact.
• In this case, ETH may retest the lower boundary of the channel, with possible extensions toward 4200–4150.
📌 Conclusion:
Ethereum is at a decision point. A confirmed breakout above 4315 opens room for a rally to 4410, while rejection from this level could extend the corrective phase lower.

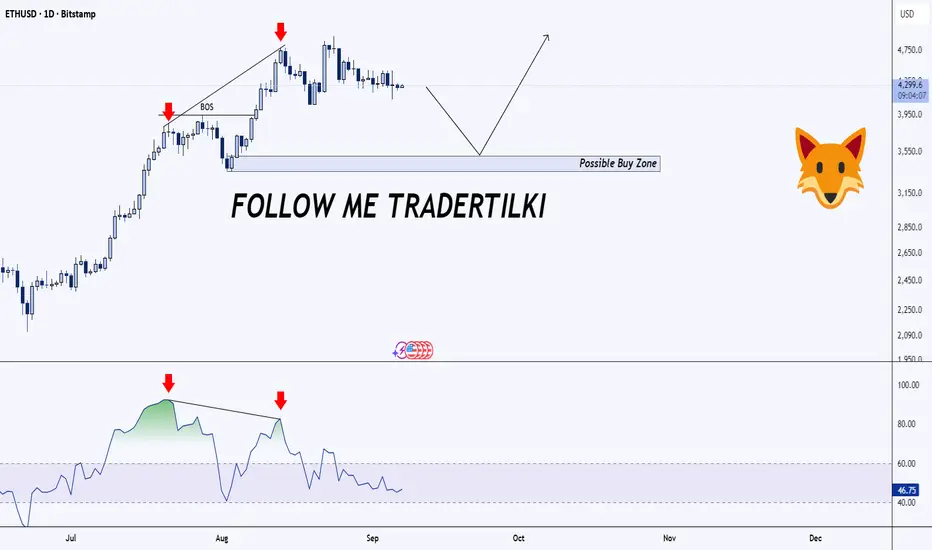
Ethereum climbing, but RSI throwing shade stay sharpGuys, I’ve also put together an Ethereum analysis for you.
Ethereum is an amazing coin that’s not up for debate. But it’s already climbed quite a bit. I haven’t bought in at this point, but if it drops to the 3,538.0 – 3,357.0 range, I’d definitely be looking to buy.🔥
Right now, we’re in an uptrend, but on the 1‑day chart I spotted a divergence on the RSI indicator. It looks like this divergence might be playing out. If the price falls below the 4,000 level, that would confirm the divergence is in effect.
Guys, I would like to thank everyone who supports my analyses with their likes. Your likes boost my motivation, and that's why I share these analyses.
#ETH/USDT towards upper levels#ETH
The price is moving within a descending channel on the 30-minute frame, adhering well to it, and is heading for a strong breakout and retest.
We have a bearish trend on the RSI indicator that is about to be broken and retested, which supports the upward move.
There is a major support area in green at 4255, which represents a strong support point.
For inquiries, please leave a comment.
We are in a consolidation trend above the 100 Moving Average.
Entry price: 4295
First target: 4326
Second target: 4367
Third target: 4417.83
Don't forget a simple matter: capital management.
When you reach the first target, save some money and then change your stop-loss order to an entry order.
For inquiries, please leave a comment.
Thank you.

Ethereum Peak Incoming!The above ETH chart highlights the historical relationship between Ethereum’s weekly RSI and major cycle peaks. The red sell zone (RSI above 80) has consistently marked high-risk areas where ETH price eventually topped out.
📜Historical Patterns
🔷 2017 Bull Run
- RSI reached 98 (extreme overbought).
- ETH price peaked soon after.
- A bearish divergence followed, where ETH made higher highs while RSI made lower highs — signaling exhaustion before the major correction.
🔷 2021 Bull Run
- RSI peaked at 92, lower than the 2017 cycle.
- ETH price again topped within this red sell zone.
-A clear bearish divergence formed as ETH pushed to new highs while RSI declined. This preceded the end of the cycle.
🔷 Current Cycle (2025)
-RSI is trending higher and approaching the 80+ sell zone once again.
- Based on the cycle-to-cycle decline (98 → 92 → projected 85), this run could see its RSI peak around 85.
- If ETH price enters the 80+ RSI zone while forming a bearish divergence, ETH could be trading in the $6K–$7K range.
- The projected timing for this peak is late Q4 2025 or early Q1 2026.
📉 Declining RSI Peaks Show Market Maturity
-Each bull run has shown a lower RSI peak compared to the last (2017: 98 → 2021: 92 → projected 2025: 85).
-This reflects ETH’s market maturity: price continues to grow, but volatility and overbought extremes decline cycle by cycle.
🐻 Bearish Divergence Watch
- After previous RSI peaks, ETH displayed a consistent bearish divergence:
Price → higher highs
RSI → lower highs
- This pattern has historically signaled weakening momentum before a macro top.
- We could see a similar divergence formation in the current cycle, marking a potential exhaustion phase.
🎯 Trading Implications
- RSI above 80 = high-risk sell zone.
- A projected RSI peak near 85 could align with ETH’s cycle high.
- ETH may trade in the $6K–$7K range if this setup plays out.\
- Expected peak timing: end of Q4 2025 or beginning of Q1 2026.
- Monitoring RSI and divergence signals will be key in spotting the top.
Conclusion: In 2017, ETH peaked with the RSI hitting 98, while in 2021 the RSI topped at 92. For the current 2025 cycle, the projected RSI peak is around 85. This consistent decline in RSI peaks across cycles highlights ETH’s market maturity, with reduced volatility as the asset grows. Historically, each major top has also been preceded by a bearish divergence, and a similar setup could form again. Traders should remain cautious as ETH approaches the red sell zone above 80 RSI.
Cheers
Hexa
CRYPTOCAP:ETH BITSTAMP:ETHUSD BINANCE:ETHUSDT

Ethereum Weekly Analysis📊 Ethereum Weekly Analysis
This week, I have analyzed the ETH/USDT chart focusing on key support & resistance levels, market structure, and potential trading zones.
The breakdown includes:
🔹 Weekly trend direction
🔹 Major support & resistance zones
🔹 Key liquidity levels & possible reversal points
🔹 Short & long opportunities based on structure
This analysis is purely educational and based on my personal trading experience. Always manage risk properly and do your own research before trading

TradeCity Pro | Ethereum Consolidates in Descending Triangle👋 Welcome to TradeCity Pro!
In this analysis I want to review Ethereum for you. Ethereum is by far the most popular altcoin in the market and with a market cap of 520 billion dollars it is ranked 2nd on CoinMarketCap.
⏳ 4-Hour Timeframe
After the bullish leg that started from the bottom of 3380, Ethereum broke 3890 and reached the top of 4806, managing to register a new all-time high.
✨ Currently, the price is in a corrective and ranging phase and has corrected down to the 0.382 Fibonacci level, forming a Maker Buyer zone near this area.
⚡️ A descending trendline has also formed, where the price has tested it multiple times, creating a descending triangle between this trendline and the Maker Buyer zone.
📈 With a breakout of this trendline, we can open a long position. The trendline trigger is at 4488, and this position can be taken as a pre-breakout entry before 4806, with the main trigger being the breakout of 4806 itself.
🔽 On the other hand, if the triangle breaks to the downside, the price will move towards lower Fibonacci levels and can correct down to 3890.
💫 In my opinion, as long as Ethereum is above the 3890 level, its trend remains fully bullish, and if it is supported in this current zone, the next leg up will start even stronger.
💥 The first confirmation of a trend reversal will be if the price stabilizes below 3890, but currently, the price is still far from this level, and as long as it is above it, opening short positions is not logical.
📝 Final Thoughts
Stay calm, trade wisely, and let's capture the market's best opportunities!
This analysis reflects our opinions and is not financial advice.
Share your thoughts in the comments, and don’t forget to share this analysis with your friends! ❤️

ETH 1H Analysis - Key Triggers Ahead | Day 14💀 Hey, how's it going ? Come over here — Satoshi got something for you!
⏰ We’re analyzing ETH on the 1-hour timeframe timeframe.
🔭 On the 1H timeframe for Ethereum, we can see that after yesterday’s news, ETH pushed upward toward the top of its range but failed to break out. From that resistance, it faced a heavy rejection, and this drop happened within just two 1H candles! At the moment, ETH is in a consolidation zone, and breaking out of this compression could provide us with an entry.
⛏ The key RSI oscillator levels are at 38 and 50. Once RSI breaks above or below these zones, Ethereum could start its next move following the effects of yesterday’s NFP news.
💰 The size and volume of red candles have increased sharply, showing strong selling pressure. The corrective bounce happened step by step, but then another fairly large red 1H candle was printed. With continued selling pressure, Ethereum may test lower price levels.
🪙 On the 1H timeframe for the ETHBTC pair, we can see it is moving inside a multi-timeframe range. Each time it reaches the bottom of the box, volume increases and the price reacts with zig-zag moves. Note that the bottom of this box is at 0.03864, which has already been tested twice. This area should be considered as a short alert zone for ETHBTC.
💡 The alert zones for Ethereum itself are at 4,272$ and 4,338$. If either of these levels is broken, ETH could start a strong move, especially considering the momentum after yesterday’s NFP News.
❤️ Disclaimer : This analysis is purely based on my personal opinion and I only trade if the stated triggers are activated .
ETH/USD: Could $5,000 Be Just Around the Corner?Ethereum (ETH) is currently trading at $4,285, experiencing a slight decline from the previous close. Intraday, it reached a high of $4,474 and a low of $4,261. The $4,300–$4,400 range has been acting as a key support zone, and a breach below this could see ETH testing the $4,000 level, with the 50-day EMA providing additional support. Immediate resistance is observed around $4,530, and a successful breakout above this level could pave the way for a move towards $5,000.
Market sentiment shows the Relative Strength Index (RSI) approaching overbought territory, indicating potential for a short-term pullback. Significant institutional accumulation continues, with firms like BlackRock increasing their ETH holdings. The approval of Ethereum ETFs in the U.S. and Australia has led to increased investor participation, contributing to upward price pressure.
Short-term volatility is expected as ETH tests these key support and resistance levels. A breakout above $4,530 could signal a bullish continuation towards $5,000, while a drop below $4,000 may lead to further downside. Long-term prospects remain positive, supported by growing institutional interest and favorable market conditions.

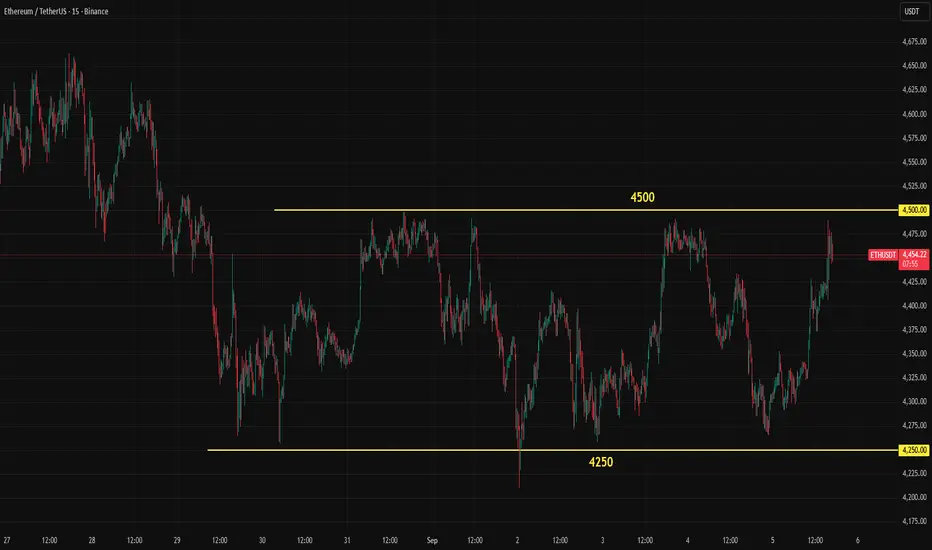
Quick Update on EthereumETH has been ranging between 4,250 and 4,500 since late August. With the weak payrolls data and yet another downward revision, a September cut is now mostly priced in. The market has also started to anticipate two more cuts for the rest of the year. This has supported Ether, with 4,500 being tested again. If a breakout occurs, an upward move may begin shortly, but for now the 4,500 resistance is still holding.
ETH 1H Analysis - Key Triggers Ahead | Day 13💀 Hey , how's it going ? Come over here — Satoshi got something for you !
⏰ We’re analyzing ETH on the 1-hour timeframe timeframe .
🔭 On the 1H timeframe of Ethereum, we can see that ETH has had a solid upward move and is now facing resistance at $4416. If this level breaks, price could move toward the next resistance at $4481. A early trigger for a long position is right at the current level, which I’ve already used to open a trade. I’ve also set a low-risk order around $4481, which is the top of ETH’s box structure on the multi-timeframe view.
⛏ The key RSI zones for ETH are around 50 and 70. Breaking out of these levels could trigger a strong leg. With news coming, volatility is expected to increase sharply. ETH is currently trading below 70 but above 50, which suggests long setups have more momentum.
📊 The size and volume of ETH’s green candles are increasing, showing clear buying strength. If today’s NFP news comes out positive, ETH could make a very strong upward leg.
💸 On the 1H ETHBTC chart, the pair is inside a descending channel, and within this channel, it has formed a tight box-like consolidation. The box top is at 0.03999, while the bottom sits at 0.0387. With higher volume and volatility, ETHBTC could break out, leading to either a pump or a dump in Ethereum.
💡 The alarm zones for Ethereum are set at $4416 and $4481. Breaking and holding above these levels can provide strong trading opportunities. Personally, I’ve already opened a position on the $4416 breakout, and I plan to add more size if the $4481 zone is taken out. The NFP release could bring momentum similar to last time, with sharp and powerful moves.
❤️ Disclaimer : This analysis is purely based on my personal opinion and I only trade if the stated triggers are activated .

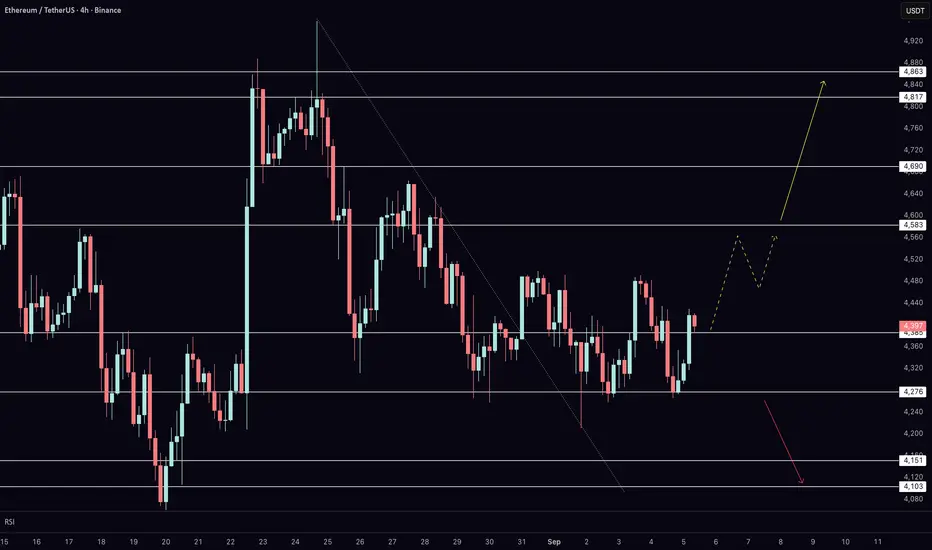
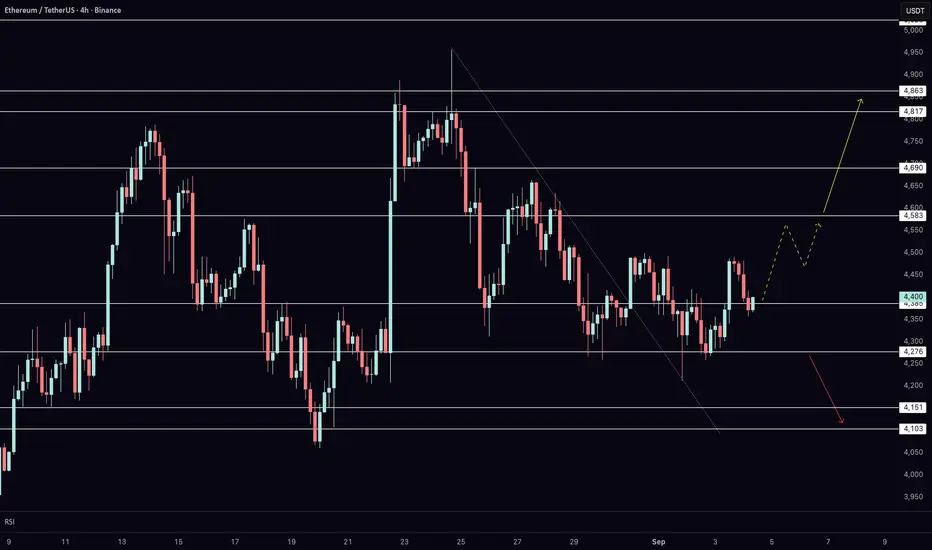
Key Levels to Watch on Ethereum Today After NFP & Bitcoin RallyEthereum is trading right at key resistance on the 4-hour chart, and today’s price action could set the tone for the next major move. After defending support at $4,276, ETH has bounced back into the $4,383 level, where buyers and sellers are now battling for control. In this video, I break down the short-term roadmap, explain the critical support and resistance levels, and outline the scenarios that could unfold depending on today’s reaction.
With the U.S. NFP release adding volatility across markets and Bitcoin showing fresh bullish momentum, Ethereum is at a decisive moment. A confirmed breakout above resistance would open the path toward $4,582, $4,689, and $4,862, while failure to hold support shifts focus back to $4,148 and $4,103. Watch closely — the coming sessions are likely to provide clarity on whether ETH is ready to extend higher.
ETH 1H Analysis - Key Triggers Ahead | Day 12💀 Hey , how's it going ? Come over here — Satoshi got something for you !
⏰ We’re analyzing ETH on the 1-hour timeframe timeframe .
🔭 On the 1H timeframe of Ethereum, we can see that ETH is moving inside a very tight consolidation box along with heavy profit-taking. It has been strongly supported around the $4277 level. As a result, both the top and bottom of this 1H range appear very solid. Ethereum is currently in an accumulation phase, and it could break out of this box with tomorrow’s news. The key levels to watch are exactly the top and bottom of this range.
⛏ On the RSI, the critical zones are around 40 and 70 (Overbought). If price momentum pushes beyond these zones, Ethereum could experience a strong move. Tomorrow’s news is likely to have a significant impact on ETH volatility.
💰 The size, volume, and number of green candles are greater compared to the red ones. This structure indicates a price compression pattern. A taker-seller zone exists around $4480, where more sell orders keep activating. On the other hand, there’s a maker-buyer zone at the bottom of the box that supports ETH whenever price reaches it.
📊 On the 4H timeframe of ETHBTC, the pair is moving inside a descending channel. Each time price touches the channel’s bottom, it finds support. Currently, ETHBTC has formed a V-pattern, and if it breaks the neckline, more Bitcoin could be converted into Ethereum. However, for this breakout to happen, the RSI across the 1H–4H multi-timeframes needs to move into the Overbought zone.
💡 The alarm zones for Ethereum are set at $4272 and $4480. Breaking either of these levels could trigger a strong move. For a long setup, breaking above $4480 requires high volume and strong buying pressure to absorb the sell orders placed there. Tomorrow’s news is extremely important—most of the market is waiting for it. There’s a lot of talk about a potential interest rate cut, which will directly affect Ethereum’s trend. From a technical perspective, strong patterns have already formed, and their breakout will likely align with the NFP news release tomorrow.
❤️ Disclaimer : This analysis is purely based on my personal opinion and I only trade if the stated triggers are activated .

Ethereum at $4,382 – Upside or Another Retest of $4,276?My main bias remains more upside. On the 4-hour chart, Ethereum is defending $4,280 support and testing $4,380 resistance. A break and hold above $4,380 opens the path toward $4,580, $4,690, and $4,860. Failure to hold $4,280 would shift focus to $4,150 and $4,100.
Do you also want me to round the prices in the full transcript I wrote earlier, so it matches this simplified style?
ETHERUM New Analysis | Be Careful (4H)This analysis is an update of the analysis you see in the "Related publications" section
Considering the lack of price penetration and the formation of higher highs at the first supply zone, Ethereum may have already started its drop without a recovery and could move from the current area toward the $3,700–$3,500 range. So stay alert and manage your risk carefully.
There is still a slight chance of a price rebound to the upside.
For risk management, please don't forget stop loss and capital management
Comment if you have any questions
Thank You

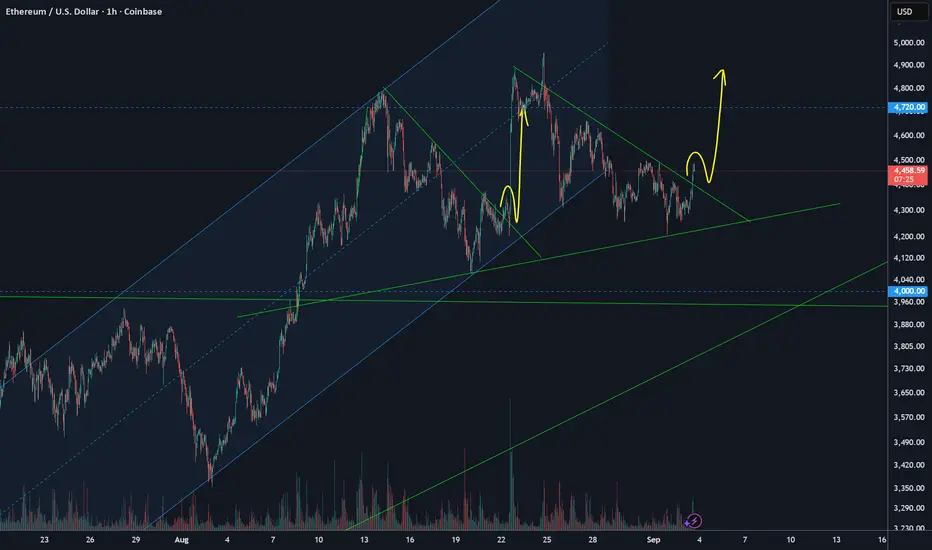
ETH repeating itself with a nice move up incoming?It looks like a repeating pattern could be playing out in the ETH market.
Look for the retest of the breakout (as marked in yellow arrows) followed by a leg up back to test the ATH.
ETH 1H Analysis - Key Triggers Ahead | Day 11💀 Hey , how's it going ? Come over here — Satoshi got something for you !
⏰ We’re analyzing ETH on the 1-hour timeframe timeframe .
🔭 On the 1-hour timeframe of Ethereum, we can see that ETH has a similar situation to yesterday. It has an important resistance at $4382, and with a breakout and confirmation above this level, Ethereum could experience a good bullish leg. Keep in mind, according to the data we posted in the channel, yesterday people in the U.S. sold their ETH and bought Bitcoin.
⛏ Two key RSI zones for Ethereum are considered: 58 and 37. Once the oscillation limit crosses these numbers, ETH can start its move.
💰 The volume and the size of green candles in Ethereum have slightly increased, and with more volume and the filling of sell orders at the $4382 resistance, Ethereum could move upward.
🪙💸 On the 1-hour timeframe of the ETHBTC trading pair, we can see that this pair had a resistance at 0.03909, which was successfully broken with higher volume. With a completed pullback and breakout above 0.03939, Ethereum could move upward. Note that this level is directly related to the maker buyers of this pair, and in this timeframe, it’s almost at its bottom.
🔔 Two alarm zones are considered for Ethereum: the $4382 level as our long trade alarm zone, where with a breakout and confirmation above it ETH could move higher; and the $4273 level as the short trade alarm zone, where a breakdown could give us a short position.
❤️ Disclaimer : This analysis is purely based on my personal opinion and I only trade if the stated triggers are activated .
Ethereum bullish in SeptemberEthereum is holding above September's pivot at 4,230 and may reach the second resistance at 5,800 in the coming weeks.
