EURCAD Breakout and Retest , All Eyes on SellingHello Traders
In This Chart EURCAD HOURLY Forex Forecast By FOREX PLANET
today EURCAD analysis 👆
🟢This Chart includes_ (EURCAD market update)
🟢What is The Next Opportunity on EURCAD Market
🟢how to Enter to the Valid Entry With Assurance Profit
This CHART is For Trader's that Want to Improve Their Technical Analysis Skills and Their Trading By Understanding How To Analyze The Market Using Multiple Timeframes and Understanding The Bigger Picture on the Charts
Eurcad!


EURCAD: Long Signal Explained
EURCAD
- Classic bullish pattern
- Our team expects retracement
SUGGESTED TRADE:
Swing Trade
Buy EURCAD
Entry - 1.6217
Stop - 1.6201
Take - 1.6247
Our Risk - 1%
Start protection of your profits from lower levels
Disclosure: I am part of Trade Nation's Influencer program and receive a monthly fee for using their TradingView charts in my analysis.
❤️ Please, support our work with like & comment! ❤️

EURCAD A Fall Expected! SELL!
My dear friends,
Please, find my technical outlook for EURCAD below:
The instrument tests an important psychological level 1.6289
Bias - Bearish
Technical Indicators: Supper Trend gives a precise Bearish signal, while Pivot Point HL predicts price changes and potential reversals in the market.
Target - 1.6257
About Used Indicators:
Super-trend indicator is more useful in trending markets where there are clear uptrends and downtrends in price.
Disclosure: I am part of Trade Nation's Influencer program and receive a monthly fee for using their TradingView charts in my analysis.
———————————
WISH YOU ALL LUCK

Bullish continuation above key support?EUR/CAD is falling towards the pivot, which serves as a pullback support that aligns with the 50% Fibonacci retracement and could bounce back to the 1st resistance, which acts as a pullback resistance.
Pivot: 1.61864
1st Support: 1.61261
1st Resistance: 1.63589
Disclaimer:
The above opinions given constitute general market commentary, and do not constitute the opinion or advice of IC Markets or any form of personal or investment advice.
Any opinions, news, research, analyses, prices, other information, or links to third-party sites contained on this website are provided on an "as-is" basis, are intended only to be informative, is not an advice nor a recommendation, nor research, or a record of our trading prices, or an offer of, or solicitation for a transaction in any financial instrument and thus should not be treated as such. The information provided does not involve any specific investment objectives, financial situation and needs of any specific person who may receive it. Please be aware, that past performance is not a reliable indicator of future performance and/or results. Past Performance or Forward-looking scenarios based upon the reasonable beliefs of the third-party provider are not a guarantee of future performance. Actual results may differ materially from those anticipated in forward-looking or past performance statements. IC Markets makes no representation or warranty and assumes no liability as to the accuracy or completeness of the information provided, nor any loss arising from any investment based on a recommendation, forecast or any information supplied by any third-party.

EURCAD: Potential Long Setup
Market Context
Price swept liquidity below the previous daily low and then broke structure to the upside, signaling a potential shift in market direction. This could be the beginning of a bullish leg if price respects demand on the pullback.
Key Technicals
Clear liquidity sweep (CRT) beneath recent lows
Bullish BOS on the 4H timeframe
Watching for price to retrace back into the imbalance (FVG) area
FVG aligns closely with the 50 EMA and 0.5–0.618 Fibonacci retracement zone on the 15m chart
Plan is to look for rejection or confirmation candle within this confluence area
Trade Plan
Wait for price to return into the FVG + 50 EMA + Fib confluence zone
Enter only if a clear rejection or engulfing candle forms
Direction: Longs only while price holds above 50 EMA
Target: Liquidity above recent highs around 1.63600
Invalidation: If price breaks below the sweep low and closes under demand
Summary
Price has shifted bullish after a liquidity sweep. A pullback into demand + FVG zone could offer a high-probability long setup if confirmation appears.


SHORT ON EUR/CADEUR/CAD has a nice rising channel at a major resistance area.
There is a lot of Liquidity to the downside.
I have a sell limit set at the top of the channel to activate me after the possible sweep of liquidity behind the resistance line of the channel.
Looking to catcu 300-400 pips on this play.

EUR/CAD SELLERS WILL DOMINATE THE MARKET|SHORT
Hello, Friends!
We are now examining the EUR/CAD pair and we can see that the pair is going up locally while also being in a uptrend on the 1W TF. But there is also a powerful signal from the BB upper band being nearby, indicating that the pair is overbought so we can go short from the resistance line above and a target at 1.597 level.
Disclosure: I am part of Trade Nation's Influencer program and receive a monthly fee for using their TradingView charts in my analysis.
✅LIKE AND COMMENT MY IDEAS✅

USD/CAD, GBP/CAD, EUR/CAD: Canadian Dollar Bulls Regain FootingPrice action on several Canadian dollar charts suggests that we've entered a phase of strength from the bull camp. With Canadian CPI and a Bank of Canada meeting on tap, there is plenty of opportunity for volatility. Today I outline my bias for USD/CAD, GBP/CAD and EUR/CAD.
Matt Simpson, Market Analyst at City Index and Forex.com (part of StoneX)

EURCAD High Probability Reversal + RSI DivergenceEURCAD has been consolidating at a resistance area after being in an uptrend.
It formed an ascending triangle pattern which although this is a continuation pattern usually, sometimes it does occur as a reversal pattern. This coupled with the fakout and the spike in volume when price went back into the triangle pattern (and don't forget the rsi divergence) makes this setup a high probability.

EURCAD Will Go Down!
HI,Traders !
#EURCAD broke out of the
Rising Wedge and the
Breakout is confirmed
So we are locally bearish
Biased and we will be
Expecting a further
Local move down !
Comment and subscribe to help us grow !

EURCAD: Bearish Continuation & Short Trade
EURCAD
- Classic bearish pattern
- Our team expects retracement
SUGGESTED TRADE:
Swing Trade
Sell EURCAD
Entry - 1.6249
Stop - 1.6257
Take - 1.6233
Our Risk - 1%
Start protection of your profits from lower levels
Disclosure: I am part of Trade Nation's Influencer program and receive a monthly fee for using their TradingView charts in my analysis.
❤️ Please, support our work with like & comment! ❤️


EUR_CAD WAIT FOR BREAKOUT|LONG|
✅EUR_CAD is trading in a
Strong uptrend and the pair
Has formed a range pattern
So IF we see a bullish breakout
We will be expecting a further
Bullish move up next week
LONG🚀
✅Like and subscribe to never miss a new idea!✅

EURCAD Set To Grow! BUY!
My dear friends,
Please, find my technical outlook for EURCAD below:
The instrument tests an important psychological level 1.6218
Bias - Bullish
Technical Indicators: Supper Trend gives a precise Bullish signal, while Pivot Point HL predicts price changes and potential reversals in the market.
Target - 1.6231
Recommended Stop Loss - 1.6209
About Used Indicators:
Super-trend indicator is more useful in trending markets where there are clear uptrends and downtrends in price.
Disclosure: I am part of Trade Nation's Influencer program and receive a monthly fee for using their TradingView charts in my analysis.
———————————
WISH YOU ALL LUCK


EURCAD LONG
📈 EURCAD 55m Long Setup – Breakout Continuation in Play
Technical Overview:
EURCAD has confirmed a breakout above descending structure on the 55-minute chart, followed by a clean retest. Price action is supported by bullish divergence on RSI and MACD, with volume expansion signaling institutional interest. EMAs are aligned bullishly, and the corrective phase appears complete.
Trade Parameters:
- Entry: 1.46850
- Stop-Loss: 1.46490 (below structure base and EMA cluster)
- Take-Profit 1: 1.47420 (first resistance zone, fib extension)
- Take-Profit 2: 1.47880 (prior swing high, psychological level)
- Risk/Reward: TP1 ≈ 1:1.58 | TP2 ≈ 1:2.86
- ROI:
- TP1: +158%
- TP2: +286%
Strategic Notes:
This setup qualifies as a Breakout Continuation with high tactical confidence. Ideal for journaling under “Legacy Trades” and dashboarding with CrocoBot or ECLIPS overlays. Consider trailing stop recalibration post-TP1 and tagging this as a conviction trade.
Overlay Ideas:
- Annotate breakout zone with “Retest Confirmed” label
- Deploy impulse tracker module with fib-based TP zones
- Use momentum confirmation toggle (RSI > 55, MACD histogram rising)
- Visual theme: Iron Pulse or Momentum Surge
---
#EURCAD #ForexTrading #BreakoutSetup #TechnicalAnalysis #MomentumDivergence #CrocoBot #ECLIPS #TradingView #ForexSignals #TradeJournal #AnnotatedCharts #TradingStrategy #ForexSetup #SmartMoney #PriceAction #TradingDiscipline #VisualTrading #ForexMentor #FXMomentum #TradingDashboard #ForexPrecision #LegacySetup #ConvictionTrade #TPHit #ForexLife #TradeWithConfidence #ForexLegacy #TradingWithAdam

EURCAD Is Bearish! Sell!
Please, check our technical outlook for EURCAD.
Time Frame: 1D
Current Trend: Bearish
Sentiment: Overbought (based on 7-period RSI)
Forecast: Bearish
The market is trading around a solid horizontal structure 1.623.
The above observations make me that the market will inevitably achieve 1.598 level.
P.S
The term oversold refers to a condition where an asset has traded lower in price and has the potential for a price bounce.
Overbought refers to market scenarios where the instrument is traded considerably higher than its fair value. Overvaluation is caused by market sentiments when there is positive news.
Disclosure: I am part of Trade Nation's Influencer program and receive a monthly fee for using their TradingView charts in my analysis.
Like and subscribe and comment my ideas if you enjoy them!

EURCAD Will Go Up! Buy!
Please, check our technical outlook for EURCAD.
Time Frame: 12h
Current Trend: Bullish
Sentiment: Oversold (based on 7-period RSI)
Forecast: Bullish
The market is trading around a solid horizontal structure 1.605.
The above observations make me that the market will inevitably achieve 1.619 level.
P.S
We determine oversold/overbought condition with RSI indicator.
When it drops below 30 - the market is considered to be oversold.
When it bounces above 70 - the market is considered to be overbought.
Disclosure: I am part of Trade Nation's Influencer program and receive a monthly fee for using their TradingView charts in my analysis.
Like and subscribe and comment my ideas if you enjoy them!

EUR/CAD: Launching Long! Layered Entry Strategy For Gains💸 EUR/CAD "Euro vs Loonie" Bank Plan (Swing / Scalping) 📊
🎯 Trading Plan (Thief Layering Strategy)
Asset: EUR/CAD
Setup: Bullish Hull Moving Average breakout + retest 🟢
Entry (Layering Style): Multiple buy limit orders at
1.60800
1.60900
1.61000
1.61200
(You can expand layers based on your own risk preference)
Stop Loss (SL): Thief SL @ 1.60600 (adjust to your own risk strategy) 🛡️
Target (TP): Resistance "police barricade" around 1.62200 🏁
⚠️ Note: This is not financial advice — manage your own TP and risk as per your trading plan.
🔍 Why This Plan? (Fundamental + Macro + Sentiment + Thief Blend)
📈 Real-Time Snapshot (Sept 5, 2025)
EUR/CAD Spot Rate: 1.6025
Daily Change: +0.12%
52-Week Range: 1.4650 – 1.6350
👥 Trader Sentiment
Retail Traders: 42% Long 🐂 | 58% Short 🐻
Institutions: 55% Long 🐂 | 45% Short 🐻
😱 Investor Mood (Fear & Greed)
Index: 48/100 → Neutral ⚖️ (leaning fear due to global trade + US jobs data)
📋 Fundamentals
Score: 62/100 🟢
Drivers:
Eurozone growth resilient, ECB steady at 2% 🏦
Canada facing weak jobs data, BoC at 2.75% 🛢️
Oil prices steady, modest CAD support ⚡
🌍 Macro Score
Score: 58/100 🟡
Factors:
Global trade tensions weigh on CAD 🛡️
Eurozone recovery boosts EUR 💪
US policy uncertainty adds volatility 🌪️
🧭 Overall Market Outlook
Bias: Neutral → Slightly Bullish Tilt 📈
Why: ECB support + Eurozone recovery outweigh CAD’s oil-linked strength. Range likely 1.60 – 1.63 short-term.
🚦 Related Pairs to Watch
FX:EURUSD , OANDA:USDCAD , OANDA:GBPCAD , OANDA:EURGBP
Keep an eye on BLACKBULL:WTI (Oil) for CAD correlation.
✨ “If you find value in my analysis, a 👍 and 🚀 boost is much appreciated — it helps me share more setups with the community!”
#EURCAD #Forex #TradingPlan #SwingTrading #Scalping #ThiefStrategy #HullMovingAverage #Fundamentals #MacroAnalysis #Sentiment #FXCommunity

EUR/CAD BEST PLACE TO SELL FROM|SHORT
EUR/CAD SIGNAL
Trade Direction: short
Entry Level: 1.610
Target Level: 1.600
Stop Loss: 1.616
RISK PROFILE
Risk level: medium
Suggested risk: 1%
Timeframe: 9h
Disclosure: I am part of Trade Nation's Influencer program and receive a monthly fee for using their TradingView charts in my analysis.
✅LIKE AND COMMENT MY IDEAS✅

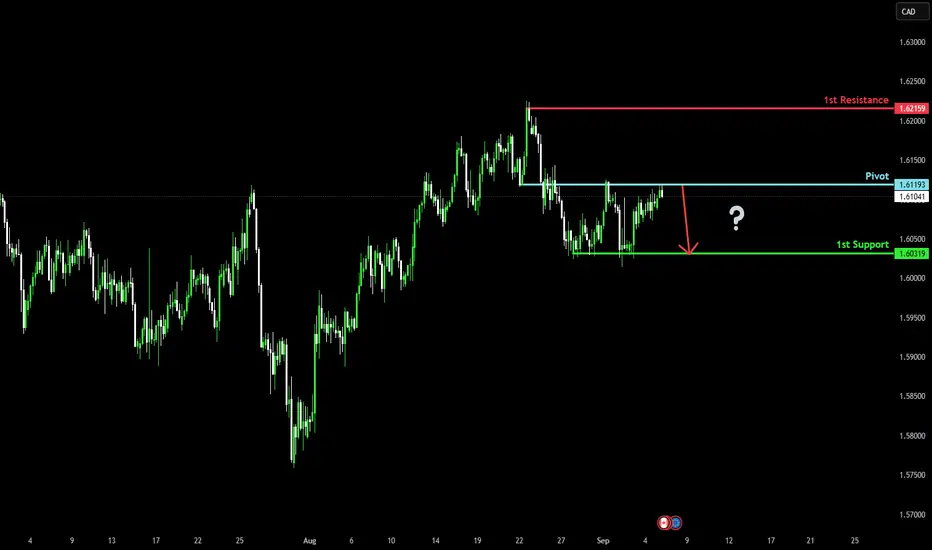
Bearish reversal?EUR/CAD is reacting off the pivot and could reverse to the 1st support, which acts as a pullback support.
Pivot: 1.61193
1st Support: 1.60319
1st Resistance: 1.62159
Disclaimer:
The above opinions given constitute general market commentary, and do not constitute the opinion or advice of IC Markets or any form of personal or investment advice.
Any opinions, news, research, analyses, prices, other information, or links to third-party sites contained on this website are provided on an "as-is" basis, are intended only to be informative, is not an advice nor a recommendation, nor research, or a record of our trading prices, or an offer of, or solicitation for a transaction in any financial instrument and thus should not be treated as such. The information provided does not involve any specific investment objectives, financial situation and needs of any specific person who may receive it. Please be aware, that past performance is not a reliable indicator of future performance and/or results. Past Performance or Forward-looking scenarios based upon the reasonable beliefs of the third-party provider are not a guarantee of future performance. Actual results may differ materially from those anticipated in forward-looking or past performance statements. IC Markets makes no representation or warranty and assumes no liability as to the accuracy or completeness of the information provided, nor any loss arising from any investment based on a recommendation, forecast or any information supplied by any third-party.