After a long pause, I'm backIt's been a minute since I've posted or traded. As it happens trading drew me back. Let's see the first position I've taken.
We've got ourselves a downtrend on euro-dollar since sep, and around the 1.15 area is my trade. Is it risky? Yes. But, I'll only give it 2-3 options to be able to break further down or need an extra super strong signal of bullish momentum to change my view.
Initial stop will be very close: 1.1545
First tp is @1.1454
RR is 1:2.
Eurodollar

EUR/USD Daily Chart Analysis For Week of Oct 31, 2025Technical Analysis and Outlook:
In the most recent trading session, the Eurodollar market exhibited substantial downward movement, declining significantly from the critical Mean Resistance level of 1.165. The market penetrated two weakened Mean Support levels, 1.159 and 1.155, ultimately stabilizing just above the Inner Currency Dip at 1.151.
The current market assessment suggests that the prevailing progressive trend is likely to persist toward the initial Inner Currency Dip at 1.151, with the expectation of eventually reaching the Outer Currency Dip at 1.145. Nevertheless, the active Inner Trading Zone is expected to remain highly dynamic until the currency achieves these two specified targets. Furthermore, it is essential to remain cognizant of the rebound thresholds for the currency, within the two principal outputs.

EUR/USD Shorts towards 1.1440My analysis for this week is for EU to continue moving lower, in line with the current bearish trend. I’m watching for a potential pullback into the 5hr supply zone that recently caused a break of structure to the downside.
Once price taps into this area, I’ll wait for signs of distribution and confirmation entries to take shorts targeting the 16hr demand zone around 1.1440.
Confluences:
- Strong bearish structure with consistent breaks to the downside
- Multiple new supply zones, including the refined 5hr one near current price
- Significant liquidity resting below that still needs to be taken
- DXY remains bullish, supporting this bearish idea
- A clean pro-trend setup with no major news interference expected
P.S. If price breaches the 5hr supply, it’ll likely be due to it not being in a premium area. In that case, I’ll wait for price to reach higher premium levels before looking for another short setup — all depending on how price approaches the zone.

EUR/USD – Bullish Reversal Potential from Demand Zone EUR/USD – Bullish Reversal Potential from Demand Zone (Smart Money Outlook)
🧭 Market Structure Overview
The EUR/USD pair has been trading within a larger bearish framework, as evidenced by the prior Market Structure Break (MSB) and Bearish Change of Character (CHOCH) that confirmed bearish intent after price rejected from the Bearish Order Block (BE-OB) near the 1.17787 level.
However, recent price action indicates potential accumulation near the Demand Zone Area (1.15507 – 1.15005). This zone aligns with prior Break of Structure (BOS) support and a clear volume imbalance fill, signaling possible Smart Money interest in building long positions.
🔍 Key Structural Highlights
Liquidity Sweep (LQDT) above previous highs marked the start of the bearish leg, confirming liquidity engineering before mitigation of the BE-OB.
The MSB confirmed bearish control, followed by a Bearish CHOCH, maintaining a lower-high and lower-low sequence.
Price eventually tapped into the Demand Zone Area, causing a Bullish CHOCH, which indicates potential reversal or at least a short-term bullish retracement phase.
The IDMT (Internal Daily Manipulation Target) zone shows internal liquidity being swept, further validating Smart Money activity.
🟩 Demand Zone Analysis
The Demand Zone Area (1.15507 – 1.15005) has been highlighted as a key accumulation region.
This zone sits below prior equal lows, making it a high-probability liquidity grab region.
Strong reaction wicks and volume buildup in this area suggest that institutional players may be filling long orders.
A potential bullish CHOCH from this zone could confirm the start of a new short-term bullish leg targeting premium levels.
🟥 Premium Supply Zones (Sell Areas)
1.16179 – Minor intraday supply level, potential first rejection area for pullbacks.
1.17256 – Intermediate liquidity target and imbalance fill zone.
1.17787 – Major Bearish Order Block (BE-OB), serving as a high-probability reversal area if bullish retracement extends.
🔄 Projected Price Path (Outlook)
Price is expected to follow a reaccumulation pattern inside the demand zone:
A final liquidity sweep below 1.15507 may occur to trigger late shorts.
A bullish displacement from the demand zone could signal a short-term BOS to the upside.
Price may then target 1.16179 → 1.17256 → 1.17787, where further liquidity rests above internal highs.
If buyers fail to defend the 1.15005 level, bearish continuation toward deeper discount levels would be confirmed.
📈 Trading Plan (Educational Purpose Only)
Buy Scenario: Wait for a confirmed bullish CHOCH and displacement from the Demand Zone Area, then look for mitigation of a bullish order block.
Sell Scenario: Watch for bearish rejections or liquidity sweeps around 1.17256 – 1.17787 (premium region).
🎯 Target Levels
🎯 Bullish Targets
TP1: 1.16179 → First structural target (previous minor supply zone).
TP2: 1.17256 → Key liquidity pool & imbalance fill zone.
TP3: 1.17787 → Major BE-OB (final upside mitigation before potential sell-off).

EUR/USD Under PressureEUR/USD Under Pressure
Today, the EUR/USD pair is trading around 1.1560, close to autumn lows. From this week’s high, the pair has fallen by roughly 0.85%, reflecting bearish pressure.
The main factors driving the decline are traders’ reactions to central bank signals:
→ Hawkish Fed rhetoric: On Wednesday, Jerome Powell indicated that further rate cuts are “by no means predetermined.” The Fed continues to see mixed signals from the labour market and inflation data, suggesting it will not rush into easing policy.
→ ECB keeps rates unchanged: Yesterday, the European Central Bank left rates steady. However, markets remain concerned about the slowing economic growth across the eurozone, meaning the ECB cannot afford to tighten policy amid weak activity.
Technical Analysis of EUR/USD
Since mid-September, price movements have formed a descending channel (shown in red). Today, the pair fell below a key support level at 1.1580 (highlighted by arrows).
An earlier attempt to break this support in early October failed — as the pair entered oversold territory below the channel, it formed a double bottom (A–B) before sharply rebounding.
In this context, the 1.15435 level, where the double bottom formed, is significant. The orange-shaded area shows that bulls step in near this level, producing candles with long lower wicks. On shorter timeframes, this behaviour displays signs of a bullish engulfing pattern.
If bears succeed in breaking support, the pair could test the lower boundary of the red channel. Positive news from Donald Trump on progress in trade talks with China could improve the U.S. trade balance, supporting this bearish scenario.
Conversely, if bulls continue defending the 1.1560–1.15435 zone, EUR/USD may rebound, potentially moving towards the QH line.
This article represents the opinion of the Companies operating under the FXOpen brand only. It is not to be construed as an offer, solicitation, or recommendation with respect to products and services provided by the Companies operating under the FXOpen brand, nor is it to be considered financial advice.

Fundamental Market Analysis for October 31, 2025 EURUSDEUR/USD is trading around 1.15700–1.15800 after this week’s major central-bank decisions. On October 29, the Fed cut the policy rate by 0.25 pp while indicating that further easing in December is not guaranteed and announcing an end to balance-sheet reduction from December 1. This combination of a cautious tone and the halt to “tightening via the balance sheet” was largely priced in and failed to deliver durable support to risk currencies, while U.S. Treasury yields remain relatively elevated. That backdrop sustains demand for the dollar and caps euro rebounds.
For the euro, the lack of fresh stimulus from the ECB is a key factor: on October 30 the central bank left its rate unchanged, and recent surveys and business-activity indicators point to a gradual recovery rather than an acceleration strong enough to flip the rate differential with the U.S. in the euro’s favor. As a result, the near-term fundamental balance for the pair is tilted toward moderate downside.
Additional risks in global trade and tariff uncertainty support defensive demand for the dollar. Meanwhile, U.S. inflation indicators (PCE) are broadly in line with expectations, keeping the debate alive about a pause after the Fed’s October move. Together these inputs favor a pullback in EURUSD from current levels.
Trading recommendation: SELL 1.15750, SL 1.16250, TP 1.15000

$EUGDPQQ -Europe GDP (Q3/2025)ECONOMICS:EUGDPQQ
Q3/2025 +0.2%
source: EUROSTAT
- The Eurozone economy expanded by 0.2% quarter-on-quarter in Q3 2025,
up from 0.1% in Q2 and slightly above market expectations of 0.1%, according to a flash estimate.
France grew 0.5%, exceeding expectations of 0.2%, driven by a sharp rise in exports, while Spain remained the best performer among the bloc’s largest economies, expanding 0.6% as expected, supported by strong household consumption and fixed investment.
Meanwhile, Germany stagnated due to a decline in exports, and Italy stalled, with the industrial sector contracting and services showing no growth.
On an annual basis, Eurozone GDP rose 1.3%, above expectations of 1.2%.
The better-than-expected figures ease pressure on the ECB to cut interest rates in the near term, supporting the view that the economy remains resilient despite geopolitical tensions and trade policy uncertainty.

$EUINTR -ECB Holds Rate at 2.15% (October/2025)ECONOMICS:EUINTR 2.15%
October/2025
source: European Central Bank
- The ECB kept interest rates unchanged for the 3rd meeting,
reflecting confidence in the eurozone’s economic resilience and continued easing of inflationary pressures.
In her remarks after the meeting, ECB President Lagarde emphasized that the ECB is “in a good place” and remains committed to taking all necessary actions to preserve that stability.

EURUSD is ready to reverse to the UPSIDE! Buy nowEURUSD was stuck inbetween 2 support and resistance trendlines but has now broken above a powerful resistance zone today. The price is now above the resistance zone which means it is very likely to head to the next major resistance level (the green line above) Buy now!

Can the Euro Break Free From the Dollar's Grip?The EUR/USD currency pair is extending a modest winning streak, nearing 1.1670 as the US Dollar (USD) underperforms ahead of the Federal Reserve's monetary policy announcement. This marks the fifth consecutive day of gains for the pair, largely fueled by a cooling USD sentiment due to the prolonged US government shutdown and a cautiously dovish outlook from the Fed. Despite this short-term momentum, a sustained rally remains elusive. The pair is currently searching for a stronger catalyst, with the upcoming monetary policy meetings from both the Federal Reserve (Fed) and the European Central Bank (ECB) expected to provide the necessary spark for clearer directional movement. Immediate resistance levels are flagged around 1.1728 and 1.1778, while initial support rests at the October low of 1.1542.
The underlying technical picture suggests that while the broader positive trend holds above the crucial 200-day Simple Moving Average (SMA), momentum is weak. Key indicators, such as the Relative Strength Index (RSI) sitting just over 47 and the Average Directional Index (ADX) around 15, imply that the current upward move lacks conviction and leaves the door open for potential renewed losses. Investors are keenly focused on a potential shift in the narrative. A dovish surprise from the Fed, a reduction in the appetite for US assets, or a more encouraging stance from the ECB could provide the requisite lift for the Euro. Furthermore, any genuine progress in easing US-China trade tensions would also likely weigh on the USD and benefit the currency pair.
The fundamental backdrop is characterized by the Washington stalemate and a cautious approach from both major central banks. The nearly month-long US government shutdown continues to erode business confidence and negatively impact growth expectations, contributing to the USD's drift lower. Meanwhile, the Fed is largely anticipated to deliver a 25-basis-point rate cut at its upcoming meeting, maintaining a flexible, "meeting by meeting" policy approach as it balances softer job data against lingering inflation. Across the Atlantic, the ECB is opting to stay patient, with President Christine Lagarde expressing confidence that policy is "in a good place" and future adjustments will be entirely data-dependent, a signal that the European easing cycle may be largely concluded, at least for now.

Fundamental Market Analysis for October 28, 2025 EURUSDEUR/USD is supported by expectations ahead of this week’s FOMC decision: fresh September inflation data in the United States came in moderate, reinforcing the scenario of rate cuts and a softer dollar as price pressures normalize. At the same time, the euro area’s central bank communication remains cautious but without signs of emergency tightening, which eases pressure on business activity and supports risk appetite.
Demand for the euro is also strengthened by improved global risk sentiment and stable U.S. Treasury yields: growing interest in equities and commodities typically reduces the need for the dollar as a defensive asset. This week, markets focus on the Fed’s comments about the policy path into year-end and early 2026: a gentler tone increases the probability of a weaker dollar and continued EURUSD upside.
For the short-term fundamental setup, it is notable that U.S. risks (slowing inflation, debate over fiscal constraints) weigh on yields, while Europe faces no new energy-price shocks. In this configuration, the balance of factors tilts toward moderate euro appreciation against the dollar unless the Fed signals a stricter stance on rates and balance sheet.
Trading recommendation: BUY 1.16650, SL 1.16350, TP 1.17100

EUR/USD Daily Chart Analysis For Week of Oct 24, 2025Technical Analysis and Outlook:
In the previous trading session, the Eurodollar market exhibited significant fluctuations between the critical Mean Resistance level of 1.165 and the Mean Support level of 1.159, with the current price oscillating between the two levels.
Market sentiment suggests the prevailing Active Inner Decline trend will continue. The ongoing market perspective continues to anticipate a price decrease toward the initial support level, indicated by Mean Support at 1.159, followed by secondary support at 1.155 and the Inner Currency Dip at 1.151. If this downward trajectory continues, it could extend further to the Outer Currency Dip at 1.145, alongside the Key Support level of 1.140.
Moreover, it is crucial to remain mindful of the potential emergence of an Active Inner Rebound at the Mean Support of 1.159, which may prompt a subsequent move toward the Mean Resistance of 1.165. Additionally, an Auxiliary Inner Rebound following the Outer Currency Dip at 1.145, in conjunction with the Key Support level of 1.140, will represent alternative rebound thresholds for the currency, along with the Mean Support at 1.155 situated above these levels.

EURUSD buy positionOn 15m timeframe, there are several confirmations present at the moment. Session low met from today's LDN session, P line and DXY double confirmation mirroring the Euro at the moment. Although not taking the trade in its active time, I'd say it's worth the 10 pips, just like the UJ earlier today:)

EURUSD BTMM Analysis – Potential Reversal SetupOn the 1-hour chart, EURUSD continues to follow a clear downward trend, with price forming multiple lower highs and lower lows across the week.
Currently, the pair is trading near a potential reversal zone, where market makers may begin accumulation before a shift in direction. The MAs remain bearish, but early signs of exhaustion are visible as momentum slows near 1.1550 support.
If price forms a clear structure shift (SOC) or stop-hunt low, the setup could confirm a Day 1 reversal leading into a bullish retracement or a new cycle phase.
Bias: Preparing for possible bullish reversal
Confirmation: Structure break and hold above intraday highs
Invalidation: Sustained breakdown below 1.1530

EUR/USD 4H Analysis EURUSD provided a double bottom and rallied it's away towards 1.17 then pulling back shortly after. I'd like to see the market reverse and continue the bullish rally after it's done with the pullback.
EUR/USD Daily Chart Analysis For Week of Oct 17, 2025Technical Analysis and Outlook:
Last week, we had an interesting trading session! The Euro demonstrated a considerable increase after reaching our crucial Mean Support level at 1.155. Nevertheless, this significant upward reversal fell marginally short of the Mean Resistance at 1.174, leading to a subsequent decline in the currency.
Current market indicators suggest that this Active Inner Rebound movement is unlikely to be sustainable. Ongoing market sentiment consistently reflects a retracement toward the Outer Currency Dip, designated at 1.145. Should this downward trend persist, it may extend further to the Key Support level of 1.140.
Conversely, it is essential to acknowledge and be aware of the emergence of an Auxiliary Inner Rebound following the Outer Currency Dip at 1.145, in conjunction with the Key Support level of 1.140.

SELL EURUSD - Perfect low risk high reward tradeBased on all our deep analysis and research, we can see that EURUSD will drop to the downside. This is a great low risk high reward trade. SELL NOW

EURUSD — Buy to Mega Resistance, Then Sell Big (Part 2)💥🎯 On our way to the 'Legacy Level'....but for now Long again
EURUSD — Buy to Mega Resistance, Then Sell Big (Part 2) 📈📉
If you were here in December 2020, you remember the post:
“Buy to 1.232 — then SELL BIG.”
That trade didn’t just play out — it defined the macro cycle of the next 2 years.
Well... guess what?
We're back. Different year, same setup.
Only this time, the purple line at 1.1915 is our first battle.
🟣 The Mega Resistance Returns
That purple level — 1.19153 — hasn’t changed. It was the graveyard for EURUSD bulls before, and it’s the first major stop before the sell trigger activates again.
🧭 Chart Summary:
• ✅ Buy continuation toward 1.1915
• 🚫 If rejection holds → SELL BIG again
• 🏁 Target zone below: 1.145–1.142 = structural retest
This is Part 2 of the same movie — and we already know how Act 1 ended.
🔍 Structure Breakdown
• 🔹 1.19153 = Mega Resistance** (multi-year defining level)
• 🔹 1.232 = Legacy high** from 2021 (final macro wall)
• 🔹 1.142–1.145 = Buy zone / target after rejection**
We're not here to wish. We're here to trade what works — and this setup has already proven its worth.
🔄 Strategy Logic
• Dollar weakness (as forecasted in "Normalized Dollar" posts) = EUR short-term support
• But structurally, EURUSD still trapped below macro resistance
• Long until proven otherwise — then flip and ride it down hard**
This isn’t trend-chasing. This is level execution.
🔁 Trading Wisdom 🔁
Great trades don’t expire — they just reload.
When a level this big reappears, you don’t ignore it.
You stalk it… then strike.
One Love,
The FXPROFESSOR 💙
Dollar can be in trouble, EURO will be in even more!!!

Fundamental Market Analysis for October 16, 2025 EURUSDThe euro is strengthening against the dollar and holding above 1.16 amid USD weakness driven by rising expectations of a Federal Reserve rate cut and ongoing U.S.–China trade frictions. The dollar index is correcting lower, and the 10-year Treasury yield is fluctuating around 4.0–4.1%, which reduces the dollar’s appeal as a defensive asset and supports the euro. An additional factor has been the softer tone from some Fed officials regarding the policy path amid signs of a slowdown in the U.S. economy.
In the euro area, the preliminary inflation estimate for September showed an acceleration of the annual rate to 2.2% y/y, which continues to bring readings closer to the target but does not resolve the question of the pace of subsequent ECB decisions. Markets assume that the difference in the speed of easing between the Fed and the ECB may remain in the euro’s favor in the near term, as the probability of a U.S. rate cut by year-end is considered high, while in the eurozone the regulator prefers a gradual approach without rushed steps.
Risks for the euro are linked to the dynamics of U.S. Treasury yields, headlines on trade negotiations, and the EU energy market. However, given the current balance of factors, the advantage lies with the European currency: a weaker dollar, relatively stable inflation expectations in the euro area, and an improvement in risk appetite.
Trading recommendation: BUY 1.16650, SL 1.16150, TP 1.17150

Market Analysis: EUR/USD Attempts RecoveryMarket Analysis: EUR/USD Attempts Recovery
EUR/USD is recovering losses from 1.1540.
Important Takeaways for EUR/USD Analysis Today
- The Euro struggled to stay in a positive zone and declined below 1.1650 before finding support.
- There was a break above a connecting bearish trend line with resistance at 1.1590 on the hourly chart of EUR/USD.
EUR/USD Technical Analysis
On the hourly chart of EUR/USD, the pair started a fresh decline from 1.1720. The Euro declined below 1.1650 and 1.1600 against the US Dollar.
The pair even declined below 1.1565 and the 50-hour simple moving average. Finally, it tested the 1.1540 zone. A low was formed at 1.1541, and the pair is now recovering losses. There was a move above 1.1600 and a connecting bearish trend line at 1.1590.
The pair surpassed the 23.6% Fib retracement level of the downward move from the 1.1721 swing high to the 1.1541 low. On the upside, the pair is now facing resistance near the 50% Fib retracement at 1.1630.
The first major hurdle for the bulls could be 1.1650. An upside break above 1.1650 could set the pace for another increase. In the stated case, the pair might rise toward 1.1720.
If not, the pair might drop again. Immediate support is near the 50-hour simple moving average and 1.1590. The next key area of interest might be 1.1540. If there is a downside break below 1.1540, the pair could drop toward 1.1500. The main target for the bears on the EUR/USD chart could be 1.1440, below which the pair could start a major decline.
This article represents the opinion of the Companies operating under the FXOpen brand only. It is not to be construed as an offer, solicitation, or recommendation with respect to products and services provided by the Companies operating under the FXOpen brand, nor is it to be considered financial advice.

EURUSD Outlook: Dollar Dominance Extends as Euro WeakensThe EURUSD pair remains under downward pressure as investors continue favoring the U.S. dollar amid global economic uncertainty. The Federal Reserve’s consistent stance on keeping interest rates higher for longer has reinforced the dollar’s appeal, while weak Eurozone data — including sluggish industrial output and fading consumer confidence — has weighed on the euro’s recovery.
Market sentiment shows limited bullish strength for the euro, with traders closely monitoring upcoming U.S. inflation and ECB policy comments. Unless the Eurozone presents stronger economic momentum or fiscal support, the euro is likely to remain on the defensive.
Overall, the fundamental tone supports continued USD dominance. The broader market structure reflects bearish tendencies for EURUSD in the medium term, with investors preferring dollar exposure as a safer bet amid global uncertainty.

Fundamental Market Analysis for October 13, 2025 EURUSDThe euro remains under pressure amid political uncertainty in France: cabinet formation and the budget timetable still raise questions, and the market is pricing the risk of delays to the draft budget. This worsens the assessment of growth prospects in the euro area and reduces the willingness to allocate new capital to the euro.
On the US side, demand for the dollar is supported by a cautious risk tone and ongoing trade-policy discussions between Washington and Beijing. Even during periods of a softer dollar index, some participants prefer to hold USD cash liquidity until macro indicators and the US budget agenda become clearer. The yield differential remains wide, and flows into dollar assets cap the euro’s rebound.
Additional pressure comes from weak signals out of Germany, including cooling external trade and cautious price expectations among businesses. As a result, the balance of fundamentals tilts against the euro, while short-term quality flows support the dollar. This underpins a sell-on-rallies approach near current levels with conservative targets.
Trade recommendation: SELL 1.16150, SL 1.16650, TP 1.15650

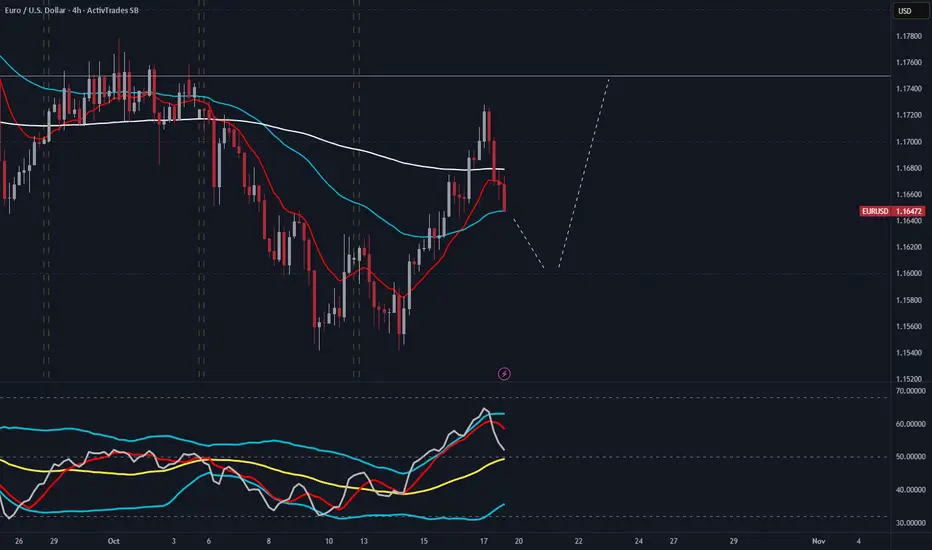
EURUSD 4H – Bullish Recovery from Holding ZoneFX:EURUSD
Structure | Trend | Key Reaction Zones
Price respected the holding zone (1.154–1.156) with a clean liquidity sweep below.
Bullish structure forming within a descending channel, indicating a possible breakout toward 1.17+.
Buyers are currently stepping in, defending demand after a deep corrective move.
Market Overview
After multiple rejections from the resistance zone, EURUSD has dropped into a high-value demand region, where smart money accumulation is visible. The pair bounced from the holding zone with a strong bullish candle, suggesting possible recovery toward mid-channel levels. If structure breaks above 1.162 cleanly, a continuation toward 1.17–1.172 is expected before any major retracement.
Key Scenarios
✅ Bullish Case 🚀 → 🎯 Target 1: 1.165 | 🎯 Target 2: 1.172 | 🎯 Target 3: 1.178
❌ Bearish Case 📉 → 🎯 Target 1: 1.150 | 🎯 Target 2: 1.141
Current Levels to Watch
Resistance 🔴 : 1.165 – 1.172
Support 🟢 : 1.155 – 1.150
⚠️ Disclaimer: For educational purposes only. Not financial advice.
