KRAB - A joke that became a good investmentIm pushing the joke and found something that looks like a rly good investment.
Perfect text book example of accumulation after a downward move (down move not shown on the chart) and a reaccumulation at 0.5 at 11
additional evidences are the pick volume on early 2024 and re accumulation at 11 shown by blue arrows
we are targeting 17 for the next wave up, on 2026 and maybe further up to 21 then
cheers not financial advice
Europe

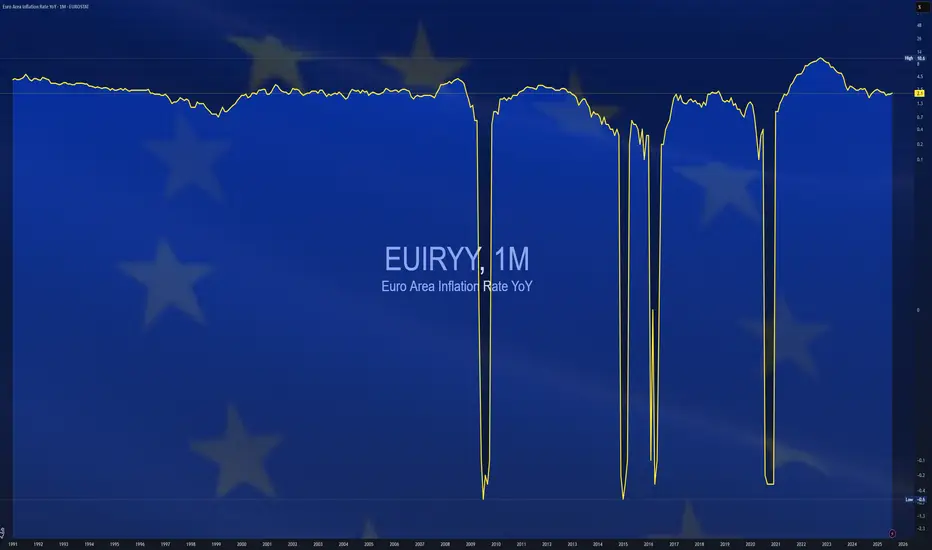
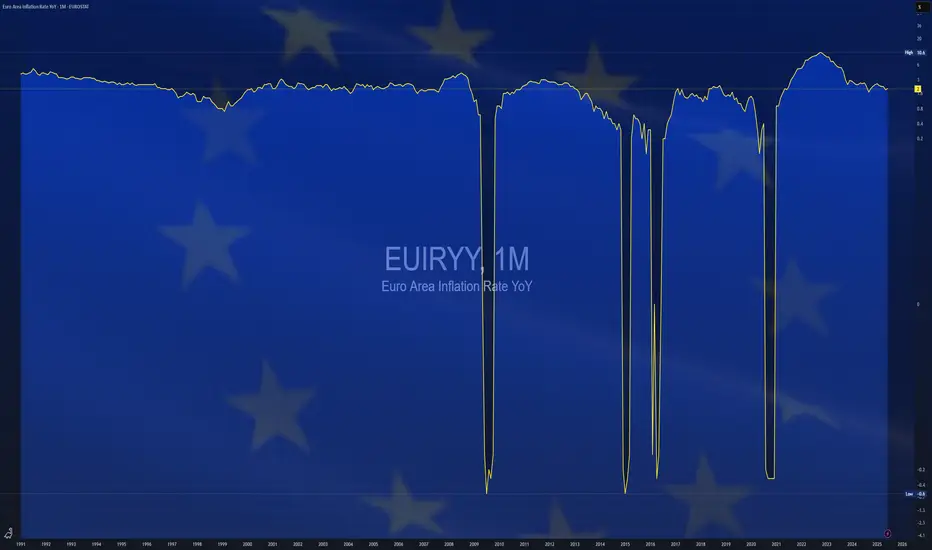
$EUIRYY- E.U CPI (November/2025)ECONOMICS:EUIRYY 2.2%
November/2025
source: EUROSTAT
- The annual inflation rate in the Eurozone edged up to 2.2% in November from 2.1% in October, slightly above expectations of 2.1%.
Prices grew faster in the services sector, while energy costs continued to decline but at a slower pace.
Meanwhile, core inflation held steady at 2.4%.

4 Biggest trading opportunities this week This week presents several key events traders should keep a close eye on:
Korean inflation – Monday 6pm
The last reading for SK CPI came in at +2.4% year‑on‑year in October 2025, above the 2.1% expected by economists. Another surprise uptick might reinforce expectations of a rate pause (or even a re‑tightening), which could boost KRW.
Euro inflation – Tuesday 5am
Inflation data out of the eurozone will shape expectations for the European Central Bank (ECB). If inflation remains sticky or rises, it could bolster ECB hawkishness, strengthening EUR and European bond yields.
Australian GDP Growth – Tuesday 7.30am
Australia’s GDP report will offer a snapshot of the local economic picture. A strong GDP print could support the Australian dollar and lift demand for commodity‑linked assets, given Australia’s status as a major commodity exporter.
US PCE – Friday 10am
The upcoming release of the Personal Consumption Expenditures Price Index (PCE) matters because the Fed views it as its preferred inflation gauge. A hotter‑than‑expected PCE could reaffirm caution on rate cuts and lift USD, bond yields, and potentially weigh on risk assets.

#AN028: London Challenges European Union, Halts Defense Funds
The news that the United Kingdom has decided not to pay the €6.75 billion earmarked for the new European Defense Fund sends a clear political and economic signal to Brussels. Hello, I'm Andrea Russo, an independent Forex trader and prop trader with $200,000 in capital under management. Thank you in advance for your time.
Behind this decision is not just a question of money, but a precise strategy of industrial and military independence aimed at reaffirming British sovereignty post-Brexit.
💼 Economic and geopolitical implications
The European fund was designed to finance joint defense and technological projects, reducing dependence on the United States and strengthening the EU's autonomous military capacity.
By refusing to participate, London is sending a two-pronged message:
Economic: Priority is given to its own budgets and its national defense industry, which has seen a strong revival in the last two years with orders from Ukraine, the Middle East, and NATO countries.
Strategic: The United Kingdom does not intend to bind itself to European defense plans that could compete with NATO, of which it remains a key member.
📉 Market Impact
In currency markets, the news tends to temporarily strengthen the pound sterling (GBP), as it is perceived as a gesture of autonomy and fiscal stability—less public spending in a context of tensions over EU budgets.
However, the effect could be short-lived: the decision deepens the rift with Brussels, fueling political risks and potential trade frictions, especially if the EU reacts with restrictive measures on joint military contracts or exports.
On the equity front, British defense stocks (BAE Systems, Rolls-Royce Defence) could benefit from "patriotic" sentiment and increased domestic orders.
On the bond market, however, the effect is neutral: the move does not change the sovereign rating but reinforces the idea of the pound as a regional safe haven currency in a Europe torn between austerity and defense spending.
🌍 Risks for the EU
For Brussels, London's lack of input complicates the construction of a common defense policy:
less funding for shared industrial programs,
greater dependence on Germany and France,
and a perception of European institutional instability, a factor that tends to weaken the euro (EUR).

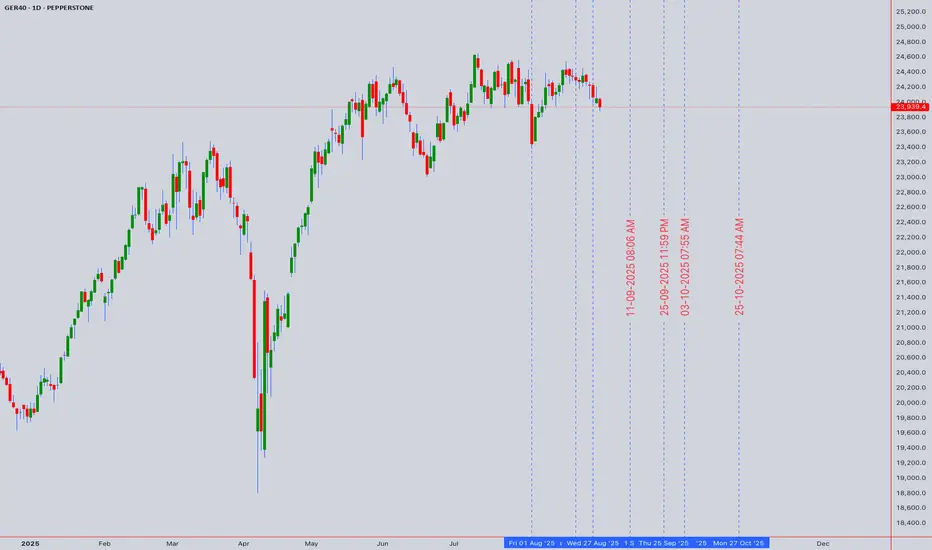
GER40 at a Crossroads: Parabolic Breakout or Exhaustion Top? 🇩🇪 GER40 DAX INDEX | Premium Technical Analysis & Trading Blueprint | 23,967.9 🇩🇪
📊 INSTITUTIONAL MULTI-TIMEFRAME MASTERCLASS | NOVEMBER 3-7, 2025 FORECAST 📊
Current Level: 23,967.9 | Analysis Date: November 1, 2025, 00:54 UTC+4
Hey, TradingView fam! 👋 The German powerhouse, GER40, has put on a spectacular show, closing the week at a mighty 23,967.9 . After such a vertical ascent, traders are rightfully asking: Is this the start of a new parabolic phase, or are we witnessing a massive exhaustion top in the making? The upcoming week, from November 3rd to 7th, is poised to give us the answer.
Let's dissect the charts across multiple timeframes, combining timeless theories with key indicators to map out the strategic path forward for both intraday and swing traders. 🧭
╔═══════════════════════════════════════════════════════════════════╗
🎯 STRATEGIC MARKET INTELLIGENCE OVERVIEW
The German DAX Index commands attention at 23,967.9 , positioning at a pivotal technical crossroads that will define European equity direction through Q4 2025. Our sophisticated multi-dimensional analysis reveals cautious optimism with breakout potential as the index tests critical resistance near the psychological 24,000 barrier. This week's confluence of ECB policy implications, US election spillover, and technical setups creates exceptional risk-reward opportunities for prepared traders.
Institutional Support Architecture: 🛡️
Immediate Foundation: 23,900 - 23,920 (Algo bid zone)
Secondary Cushion: 23,850 - 23,870 (Volume-weighted support)
Critical Platform: 23,750 - 23,780 (Weekly pivot cluster)
Major Fortress: 23,650 - 23,680 (Psychological & structural)
Resistance Target Matrix: 🎯
First Hurdle: 24,000 - 24,020 (Psychological barrier)
Secondary Wall: 24,100 - 24,120 (Pattern objective)
Breakout Zone: 24,200 - 24,250 (Extension target)
Major Milestone: 24,350 - 24,400 (Monthly target)
╚═══════════════════════════════════════════════════════════════════╝
📈 WEEKLY TIMEFRAME (1W) - MACRO STRUCTURAL ANALYSIS
Elliott Wave Supercycle Mapping: 🌊
Currently navigating Wave 4 consolidation within larger Wave (5) of the supercycle advance. The shallow retracement (38.2% Fibonacci) suggests underlying strength with Wave 5 targeting 24,500-24,800 . Alternative count places us in Wave B of corrective ABC - monitor 23,650 for bearish confirmation.
Primary Scenario: Wave 4 complete, Wave 5 underway to 24,500+
Alternative: Wave B top forming, Wave C decline to 23,200
Invalidation Level: Weekly close below 23,500
Time Projection: Completion by mid-November
Wyckoff Distribution/Re-Accumulation: 📚
Critical Juncture - Phase B/C Transition
- Preliminary Supply (PSY): 24,100 tested
- Buying Climax (BC): 24,150 rejection
- Automatic Reaction (AR): 23,750 held
- Secondary Test (ST): Current 23,967
- Upthrust pending: Above 24,000
Ichimoku Cloud European Perspective: ☁️
Tenkan-sen: 23,885 (9-period support)
Kijun-sen: 23,820 (26-period base)
Senkou Span A: 23,950 (cloud resistance)
Senkou Span B: 23,780 (cloud support)
Chikou Span: Neutral (at price level)
Cloud Status: Thin, potential twist ahead
Advanced Harmonic Configuration: 🦋
Emerging Bullish Shark pattern with precision measurements:
- 0 Point: 23,450 (October low)
- X Point: 24,150 (October high)
- A Point: 23,650 (retracement low)
- B Point: 23,967 (current - 0.618 XA)
- C Target: 23,750 (1.13 AB extension)
- D Completion: 24,350 (0.886 XC)
Gann Master Analysis: 📐
Price respecting 3x1 Gann angle from September base. Critical Gann levels:
- Current angle support: 23,920
- 45-degree resistance: 24,050
- Square of 9 target: 24,144
- Time cycle: November 6 (+/- 1 day)
╔═══════════════════════════════════════════════════════════════════╗
📊 DAILY TIMEFRAME (1D) - SWING TRADING COMMAND
Japanese Candlestick Intelligence: 🕯️
Yesterday's Hanging Man at resistance warns of potential reversal. Critical observation for today:
- Close above 24,000 = Bullish Engulfing invalidates reversal
- Close below 23,900 = Bearish Confirmation
- Doji formation = Continued indecision
Master Pattern Recognition:
Ascending Triangle approaching apex:
- Horizontal resistance: 24,000-24,020
- Rising support: Currently at 23,880
- Breakout target: 24,320 (320-point measured move)
- Volume requirement: 30% above 20-day average
- False breakout risk: High due to round number
Bollinger Bands Configuration: 📈
Upper Band: 24,015 (kissing price)
Middle Band (20-SMA): 23,870 (dynamic support)
Lower Band: 23,725 (oversold boundary)
Band Width: Contracting (squeeze alert)
%B Reading: 0.89 (upper band test)
RSI Momentum Analysis:
Daily RSI: 64 (approaching overbought)
Bearish divergence forming vs price highs
Support trend line: 55 level
Resistance: 70 level (6 points away)
Volume Profile Insights: 📊
- High Volume Node: 23,850-23,900
- Point of Control: 23,875
- Value Area High: 23,950
- Value Area Low: 23,800
- Low Volume Gap: 24,020-24,080 (breakout zone)
╚═══════════════════════════════════════════════════════════════════╝
⚡ 4-HOUR TIMEFRAME (4H) - TACTICAL FRAMEWORK
Dow Theory Application: ✅
Primary Trend: Bullish (higher highs maintained)
Secondary Trend: Consolidation/Distribution question
Minor Trend: Testing resistance
Volume Pattern: Declining on rallies (caution)
Confirmation needed: Break above 24,020
DAX/STOXX correlation: Diverging (warning)
Moving Average Configuration:
EMA 8: 23,945 (micro support)
EMA 21: 23,915 (short-term support)
EMA 50: 23,880 (medium support)
SMA 100: 23,825 (strong support)
SMA 200: 23,750 (major trend support)
Golden Cross: EMA 50 above SMA 100 ✅
Chart Pattern Alert: 🚨
Rising Wedge formation - bearish implications:
- Upper trendline: 23,980-24,000
- Lower trendline: 23,850-23,870
- Breakdown target: 23,700
- Invalidation: Close above 24,020
╔═══════════════════════════════════════════════════════════════════╗
🎪 1-HOUR TIMEFRAME (1H) - PRECISION ENTRY MATRIX
Micro Pattern Development: 🔬
Triple Top formation at 23,980:
- First top: 23,975 (Monday)
- Second top: 23,982 (Wednesday)
- Third top: 23,978 (Friday)
- Neckline support: 23,920
- Breakdown target: 23,860
VWAP Trading Framework:
Daily VWAP: 23,952
Weekly VWAP: 23,895
Monthly VWAP: 23,810
Upper Band 1: 23,985 (resistance)
Upper Band 2: 24,018 (strong resistance)
Lower Band 1: 23,919 (support)
Lower Band 2: 23,886 (strong support)
Support & Resistance Precision:
R4: 24,050 (Major resistance)
R3: 24,020 (Round number)
R2: 23,990 (Pattern resistance)
R1: 23,975 (Immediate ceiling)
PIVOT: 23,967.9 (Current)
S1: 23,950 (Micro support)
S2: 23,920 (Neckline)
S3: 23,890 (Strong support)
╚═══════════════════════════════════════════════════════════════════╝
⚡ 30-MINUTE SCALPING LABORATORY (30M)
Microstructure Dynamics: 🎯
Range-bound channel :
- Upper boundary: 23,975-23,985
- Middle pivot: 23,950-23,955
- Lower boundary: 23,925-23,935
- Breakout pending: 70% probability upward
European Session Dynamics: 🕐
Frankfurt Open (08:00 CET):
- Average range: 40-50 points
- Directional bias: First 30 minutes
London Overlap (09:00 GMT):
- Volatility spike: 60-80 points
- Best scalping window
US Premarket Impact (13:30 CET):
- Range expansion: 80-100 points
Scalping Execution Zones:
Buy Zones:
• Zone A: 23,945-23,950 (VWAP test)
• Zone B: 23,925-23,930 (Channel bottom)
• Zone C: 23,900-23,905 (Strong bid)
Sell Zones:
• Zone A: 23,975-23,980 (Triple top)
• Zone B: 23,990-23,995 (Resistance cluster)
• Zone C: 24,010-24,015 (Major resistance)
╔═══════════════════════════════════════════════════════════════════╗
🏃 15-MINUTE & 5-MINUTE ULTRA-SCALPING
15-Minute Momentum Setup: ⚡
Bull Flag micro pattern:
- Pole: 23,920 to 23,970 (50 points)
- Flag: 23,955-23,965 consolidation
- Breakout trigger: 23,968
- Quick target: 24,000 (+32 points)
- Stop: 23,950 (-18 points)
5-Minute Algorithm Signals:
Long Conditions:
RSI(5) oversold (<25) + VWAP bounce = BUY
MACD bullish cross + Volume spike = BUY
EMA(8) > EMA(21) + Pullback = BUY
Short Conditions:
RSI(5) overbought (>75) + Resistance = SELL
MACD bearish cross + High volume = SELL
Failed breakout at 24,000 = SELL
Management:
TP: 15-20 points | SL: 10-12 points
Max hold: 10 minutes | Trail: 8 points
╚═══════════════════════════════════════════════════════════════════╝
📅 WEEKLY STRATEGIC PLAYBOOK (NOVEMBER 3-7, 2025)
Monday, November 3: 🚀
Gap-up potential to 24,000 test
Strategy: Sell resistance, buy 23,920 dips
Key levels: 23,920 support, 24,000 resistance
Expected range: 80 points
Tuesday, November 4: 🗳️
US Election volatility spillover to DAX
Strategy: Wide stops, reduced size
Potential range: 23,750-24,100 (350 points!)
Correlation with US futures critical
Wednesday, November 5: 💥
Post-election directional resolution
Strategy: Trade breakout with conviction
Bullish above 24,050 → Target 24,200
Bearish below 23,850 → Target 23,700
Thursday, November 6: 📊
ECB officials speaking + German data
Strategy: Fade initial moves
Expected consolidation: 23,900-24,000
Focus on European session
Friday, November 7: 🎯
Weekly close crucial for next week's bias
Strategy: Position for weekly close
Above 24,000 = Bullish continuation
Below 23,900 = Bearish reversal
╔═══════════════════════════════════════════════════════════════════╗
⚖️ PROFESSIONAL RISK MANAGEMENT SYSTEM
Intraday Risk Parameters: 🛡️
Position size: 0.5-1% account risk
Risk-Reward: Minimum 1:2, target 1:3
Daily stop: -2% maximum loss
Consecutive losses: 3 max, then pause
Profit protection: Trail at 60% gain
Breakeven: Move stop at +15 points
Correlation monitor: Watch US futures
Swing Position Framework: 💼
Core position: 40% at 23,900-23,920
Scale-in: 30% at 23,850, 30% at 23,800
Stop loss: Below 23,750 (all positions)
Target 1: 24,050 (25% exit)
Target 2: 24,150 (35% exit)
Target 3: 24,250 (25% exit)
Runner: 24,350+ (15% hold)
╚═══════════════════════════════════════════════════════════════════╝
🔴 RISK SCENARIOS & CONTINGENCIES
Bearish Triggers: 🐻
30-min close below 23,950 = Micro caution
Hourly close below 23,920 = Intraday bearish
4H close below 23,880 = Swing bearish
Daily close below 23,800 = Trend concern
Weekly close below 23,650 = Major reversal
European Risk Factors: 🦢
• ECB policy surprises (100+ point moves)
• German economic data shocks
• EU political developments
• Energy crisis escalation
• Banking sector concerns
╔═══════════════════════════════════════════════════════════════════╗
💎 ELITE CONFLUENCE TRADING ZONES
Optimal Buy Zone: ✅
23,880-23,920
(Multi-timeframe support + Fibonacci 61.8% + VWAP + Moving averages)
Premium Sell Zone: ❌
23,990-24,020
(Triple top + Round number + Bollinger Band + Wedge resistance)
Breakout Trigger: 🚀
24,020-24,050
(Pattern completion + Resistance break + Volume confirmation)
╚═══════════════════════════════════════════════════════════════════╝
🏆 MASTER TRADER'S VERDICT
The DAX at 23,967.9 stands at a critical inflection point with the psychological 24,000 level acting as the decisive battleground. Technical indicators suggest cautious bullish bias but with increasing distribution signals. The week ahead demands disciplined execution and nimble position management.
Top 3 High-Probability Setups: 🎯
Range Trade: Buy 23,900, Sell 23,980 (Multiple touches)
Breakout Long: Above 24,020 → Target 24,150 (Clear skies)
Reversal Short: Triple top failure at 23,980 → Target 23,850
Trading Wisdom: 🧠
The DAX rewards patience at extremes. Trade the range until proven otherwise. Respect the 24,000 psychological level.
"The European markets dance to their own rhythm - master the tempo, profit from the moves!" 💶
╔═══════════════════════════════════════════════════════════════════╗
📍 ACTIONABLE INTELLIGENCE BRIEFING
Range-bound action between 23,850-24,020 until catalyst emerges. US election spillover likely to provide directional resolution. Accumulate dips toward 23,900 for upside potential to 24,200+.
Trade European hours. Respect correlations. Profit consistently. 💰
╚═══════════════════════════════════════════════════════════════════╝
#DAX #GER40 #DAX40 #TechnicalAnalysis #Trading #EuropeanMarkets #Indices #DayTrading #SwingTrading #ElliottWave #Wyckoff #HarmonicPatterns #ECB #Frankfurt #GermanStocks #STOXX #EuropeTrading #TradingView #MarketAnalysis #Forex #MarketForecast
🔔 Follow for Premium European Market Analysis | Präzision • Disziplin • Profit 📊
Risk Notice: Trading carries significant risk of loss. This analysis is educational only. Past performance does not predict future results. Conduct your own research and apply proper risk management.

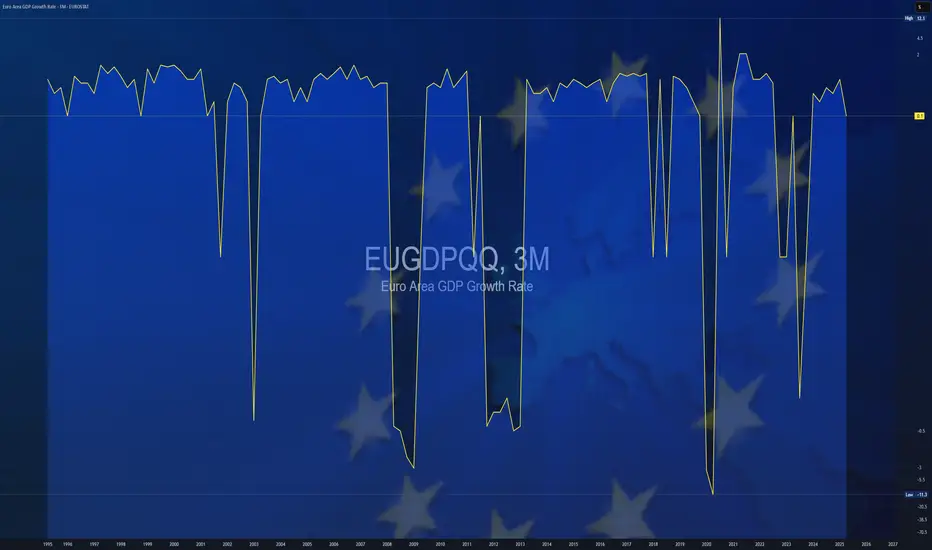
$EUGDPQQ -Europe GDP (Q3/2025)ECONOMICS:EUGDPQQ
Q3/2025 +0.2%
source: EUROSTAT
- The Eurozone economy expanded by 0.2% quarter-on-quarter in Q3 2025,
up from 0.1% in Q2 and slightly above market expectations of 0.1%, according to a flash estimate.
France grew 0.5%, exceeding expectations of 0.2%, driven by a sharp rise in exports, while Spain remained the best performer among the bloc’s largest economies, expanding 0.6% as expected, supported by strong household consumption and fixed investment.
Meanwhile, Germany stagnated due to a decline in exports, and Italy stalled, with the industrial sector contracting and services showing no growth.
On an annual basis, Eurozone GDP rose 1.3%, above expectations of 1.2%.
The better-than-expected figures ease pressure on the ECB to cut interest rates in the near term, supporting the view that the economy remains resilient despite geopolitical tensions and trade policy uncertainty.

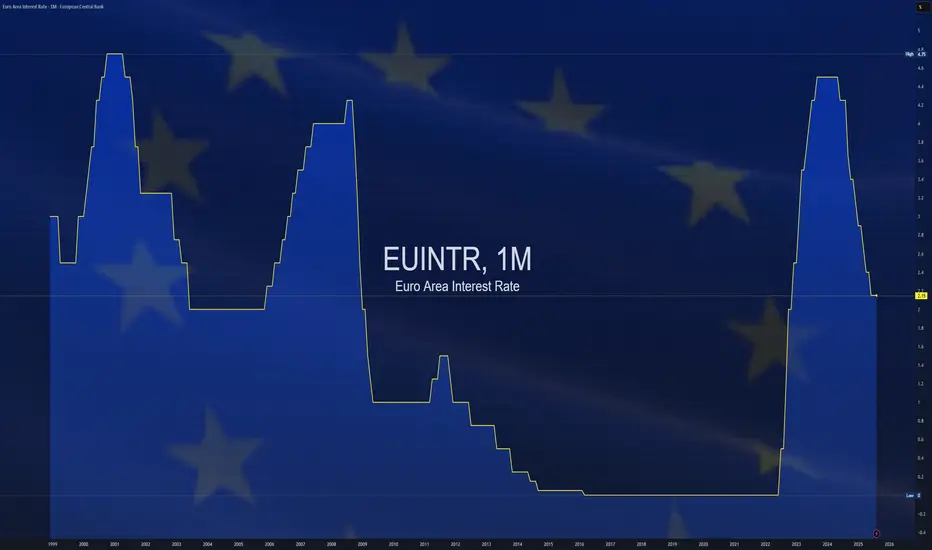
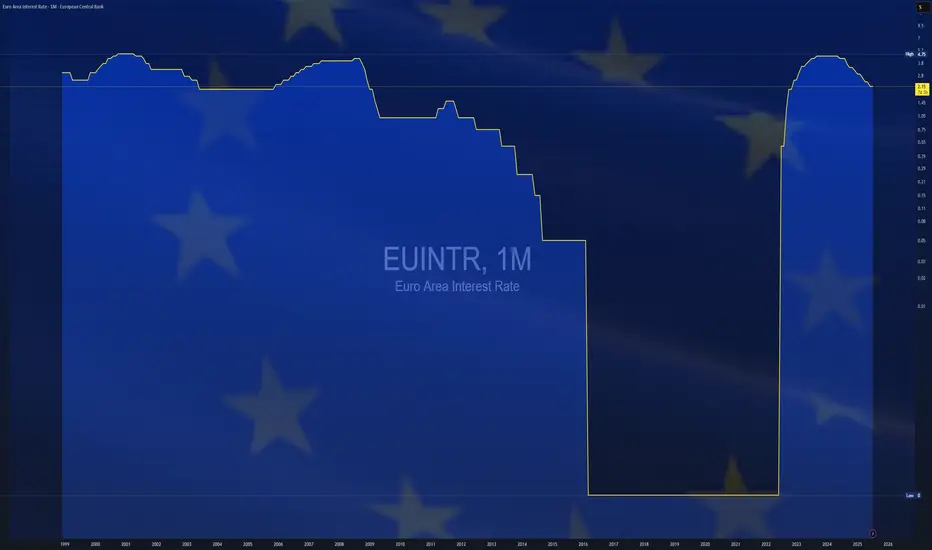
$EUINTR -ECB Holds Rate at 2.15% (October/2025)ECONOMICS:EUINTR 2.15%
October/2025
source: European Central Bank
- The ECB kept interest rates unchanged for the 3rd meeting,
reflecting confidence in the eurozone’s economic resilience and continued easing of inflationary pressures.
In her remarks after the meeting, ECB President Lagarde emphasized that the ECB is “in a good place” and remains committed to taking all necessary actions to preserve that stability.

How China Is Quietly Taking Over Europe’s Industrial FutureThe Lack of Rare Earth Elements Pushes Europe into Major Concessions to China.
Europe’s growing shortage of rare earth elements is forcing it to make unprecedented concessions to China — so deep that analysts now warn the continent could see the collapse of entire industrial sectors within the next five to six years.
Automotive, shipbuilding, aviation, and railway manufacturing are all at risk. To stay afloat, European manufacturers — especially in Germany — are reportedly transferring valuable production know-how and proprietary technologies to Chinese partners in a desperate attempt to survive just a few more months or years.
China, meanwhile, is using this knowledge to strengthen its own technological base. The scenario is alarmingly familiar: just as China mastered and surpassed the West in electric vehicles, it is now poised to outpace Europe across nearly every remaining industrial field.
Investing in major German corporations is rapidly becoming meaningless. These companies will either shut down or be bought out entirely. The battle for industrial dominance has already been decided — China has won against Europe. What remains is the larger confrontation with the United States, a conflict that will likely unfold on Europe’s back, among the ruins of its once world-leading industries.

NEAR - Patience at the Pivot, Power at the Bounce!📦NEAR has been stuck within a big range for months. After failing at the mid-range, price is grinding lower, and I’d prefer one more liquidity sweep into the blue support zone to reset late longs and load smart risk.
⚔️If buyers defend 2.00 and we then reclaim 2.20 → 2.30 (H4 close back above the pink structure), I’ll look for trend-following longs toward 2.70, then 3.10–3.40 (major resistance).
Plan:
🏹Wait for the dip into support, hunt for a wick + strong close/reclaim, and let the squeeze do the heavy lifting back into the range highs.
📚All Strategies Are Good; If Managed Properly!
~Richard Nasr

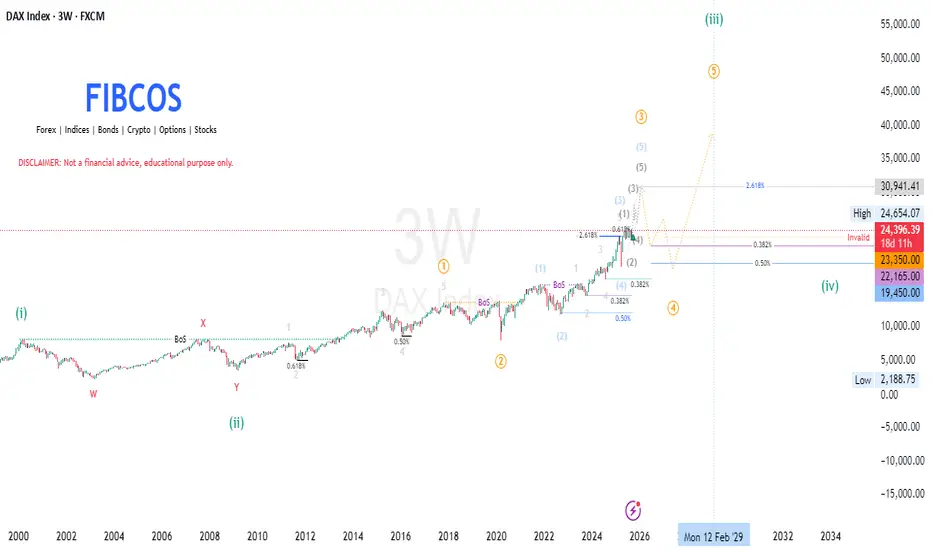
DAX INDEX | Elliott Wave + SMC + Fib + Market CycleDAX INDEX | Super Cycle Wave (3) In Progress | Micro Wave (iv) Correction Expected | Elliott Wave + SMC + Fib + Market Cycle
This macro outlook on the DAX Index (GER40) combines Elliott Wave Theory , Smart Money Concepts (SMC) , and Fibonacci Analysis , tracking the long-term price structure from the 1990s into the expected 2029 Super Cycle top .
We are currently nearing the completion of Micro Wave (iii) inside Super Cycle Wave (3) , with a correction expected as Micro Wave (iv) before a final leg Wave (v) to complete the 20-year Super Cycle advance.
🌀 SUPER CYCLE STRUCTURE (Wave Count Recap)
🔵 Supercycle Wave (1)
📈 Topped in 2000
📐 Five-wave impulse from early 90s
💡 Marked the first major peak of the new macro bull cycle
🔴 Super Cycle Wave (2)
🕰 2000–2009
📉 Multi-year W-X-Y complex correction
🔻 Pulled back to 0.618 retracement of Wave (1)
📍 Bottomed Jan–Feb 2009 — Smart Money accumulation zone
🚀 Supercycle Wave (3) — Now in Progress (2009–2029 Target)
This is a multi-decade impulse wave , subdividing into Micro Waves (i) through (v) .
🟠 Micro Wave (i)
🕰 2009–2018
✅ Clean 5-wave impulsive structure
🔓 Broke above Super Cycle Wave (1) high
📊 Confirmed initiation of Wave (3)
🟠 Micro Wave (ii)
🕰 2018–2020 (COVID crash)
🔻 Pulled back to 0.50 retracement of Wave (i)
📦 Retested key order blocks
💧 Liquidity swept beneath 2016–2018 lows
📈 Smart Money reaccumulation before major expansion
🟠 Micro Wave (iii) — Currently Unfolding
🕰 2020 – Expected top by end of 2025 or early 2026
🚀 Strongest wave in the structure
🔼 Targeting 2.618 Fibonacci extension of Wave (i)
🎯 Target zone: 30,941 (~32K)
📊 Multiple internal impulses have formed
🧠 Price delivery:
Consistent BoS
Minimal retracement
No parabolic blow-off yet → confirming institutional flow
🟠 Micro Wave (iv) — Correction Expected Next
🕰 Expected: 2026 to early 2027
🔻 Projected retracement:
0.382 – 0.5 of Wave (iii)
Target zone: 23,350 – 22,165
💧 Confluence with:
Sell-side liquidity pools
Prior OBs and imbalance zones
⚠️ Reaccumulation phase likely before final rally
🟠 Micro Wave (v) — Final Advance to Complete Supercycle Wave (3)
🕰 Expected top by 2029
🎯 Target range: Above 32,000, possibly toward 35,000+ depending on extensions
🔄 Will mark the peak of Supercycle Wave (3)
📉 Anticipate a major correction in Supercycle Wave (4) after that
📐 FIBONACCI LEVELS OF INTEREST
Structure Key Fib Levels
Supercycle (2) 0.618 retracement of (1)
Micro Wave (ii) 0.50 retracement of (i)
Micro Wave (iii) 2.618 extension of (i) → 30,941–32K
Micro Wave (iv) 0.382–0.5 retracement → 23,350–22K
Micro Wave (v) Possible extension to 38K+
🧠 SMART MONEY CONCEPTS (SMC)
🔓 Break of Structure (BoS) confirmed trend shifts at Wave (i), (ii), and internal impulses
📦 Order Blocks respected at retracement zones (2020 low, 2022 correction)
💧 Liquidity Grabs below previous lows fuel impulsive breakouts
🧱 Price Delivery = Institutional — no euphoric parabolas yet
🎯 Expect engineered liquidity sweep before Wave (iv) reaccumulation
📌 CONCLUSION
We are now nearing the completion of Micro Wave (iii) inside Super Cycle Wave (3) of the DAX. Price is approaching major extension targets (30,941–32,000), from where Wave (iv) correction is due.
This pullback (2026–2027) is expected to offer high-probability re-accumulation opportunities within a Smart Money demand zone before the final macro rally to new ATHs into 2029.
⚠️ After 2029 , expect a larger Supercycle Wave (4) correction phase.
📘 DISCLAIMER: This is a structural, educational market outlook. Not financial advice. Please do your own due diligence and risk management.
$EUINTR - Unchanged Rates (September/2025)ECONOMICS:EUINTR
September/2025
source: European Central Bank
- The European Central Bank kept its three key interest rates unchanged, with the deposit facility at 2.00%, the main refinancing rate at 2.15%, and the marginal lending rate at 2.40%, as expected.
Inflation remains close to the 2% medium-term target, and the outlook is broadly unchanged from June.
New staff projections see headline inflation averaging 2.1% in 2025, easing to 1.7% in 2026 before rising slightly to 1.9% in 2027.
Core inflation (excluding food and energy) is expected at 2.4% in 2025, 1.9% in 2026, and 1.8% in 2027.
Growth is projected at 1.2% in 2025 (up from 0.9%), slowing to 1.0% in 2026, and recovering to 1.3% in 2027.
The Governing Council reaffirmed its determination to anchor inflation at 2% in the medium term, emphasizing a cautious, meeting-by-meeting, data-driven approach.
$EUIRYY -E.U CPI (August/2025)ECONOMICS:EUIRYY 2.1%
August/2025
source: EUROSTAT
- Euro area consumer price inflation rose to 2.1% in August 2025,
slightly above both July’s pace and market expectations of 2.0%, preliminary data showed.
Unprocessed food prices climbed 5.5% from 5.4% in July,
while energy costs fell 1.9%, a smaller decline than the previous month’s 2.4% drop. Services inflation eased to 3.1% from 3.2%, and prices for processed food, alcohol, and tobacco rose at a slightly slower pace of 2.6% versus 2.7%.
Non-energy industrial goods inflation held steady at 0.8%. Core inflation—which excludes energy, food, alcohol, and tobacco—remained unchanged at 2.3%, marking its lowest level since January 2022.
DAX GER40 Technical Analysis: Advanced Weekly Forecast# DAX GER40 Technical Analysis: Comprehensive Multi-Timeframe Trading Strategy & Weekly Forecast
Current Price: 23,939.4 (As of August 30, 2025, 11:54 AM UTC+4)
Asset Class: GER40 / DAX Index
Analysis Date: August 30, 2025
---
Executive Summary
The DAX Index (GER40) continues to showcase remarkable resilience, trading near historic highs at 23,939.4 points. Our comprehensive technical analysis reveals the index has achieved significant milestones, with recent data showing the DE40 reaching 24,084 points on August 28, 2025, despite a monthly decline of 0.55%. The index maintains an impressive 27.35% year-over-year gain, positioning it as one of Europe's strongest performers. Technical confluence suggests potential for further upside toward the 24,500-25,000 zone, contingent on ECB policy support and improving macro conditions.
---
Multi-Timeframe Technical Analysis
Elliott Wave Analysis
The DAX appears to be progressing through a complex corrective pattern within a larger degree bull market:
Primary Count: Wave 5 of (5) within a Grand Super Cycle
Alternative Count: Expanding diagonal formation in final stages
Target Zone: 24,500-25,200 for primary wave completion
Critical Support: 22,800 (Wave 4 low invalidation level)
Long-term Projection: Extension toward 26,000-27,000 in 2026
Wyckoff Market Structure Analysis
Current price action aligns with Wyckoff's Re-accumulation Phase:
Phase: Late Stage Re-accumulation transitioning to Markup
Volume Analysis: Institutional accumulation evident on pullbacks below 23,500
Price Action: Higher lows formation with narrowing consolidation ranges
Composite Operator Activity: Large player absorption at key support levels
W.D. Gann Comprehensive Analysis
Square of 9 Analysis:
- Current price 23,939.4 positioned near critical Gann square resistance
- Next major Gann level: 24,649 (significant 360-degree rotation)
- Time and price confluence: September 21-28, 2025 (Autumn Equinox influence)
- Cardinal squares active at 24,000 and 24,321
Angle Theory Application:
- 1x1 Rising Angle Support: 23,400-23,500
- 2x1 Accelerated Angle: 24,200-24,400 (next resistance cluster)
- 1x2 Support Angle: 22,800-23,000 (major correction target)
Time Cycle Analysis:
- 90-day cycle completion due: Mid-September 2025
- Seasonal Gann Pattern: September-October strength historically favors DAX
- Next major time window: October 15-25, 2025
Price Forecasting:
- Immediate target: 24,200-24,400
- Extended target: 24,800-25,200
- Correction target (if triggered): 22,400-22,800
---
Japanese Candlestick & Harmonic Pattern Analysis
Recent Candlestick Formations (Daily Chart)
Doji Formation: August 28-29 showing indecision at resistance
Long Lower Shadows: Indicating strong buying support below 23,800
Hammer Patterns: Multiple occurrences near 23,500-23,600 support zone
Volume Confirmation: Bullish divergence with increasing volume on rallies
Harmonic Pattern Recognition
Bullish Gartley Pattern: Completion zone 23,200-23,400 (recent support test)
ABCD Extension: Active pattern targeting 24,480-24,650
Butterfly Pattern Potential: Watching for completion near 24,800-25,000
Fibonacci Harmony: 1.618 extension projects to 24,756 from recent swing low
Advanced Pattern Confluence
Three Drives Pattern: Currently in third drive toward 24,200+
Cypher Pattern: Potential reversal zone at 24,500-24,800
Bat Pattern Setup: Monitoring for completion signals above 24,000
---
Ichimoku Kinko Hyo Analysis
Current Cloud Structure (Daily Chart)
Price Position: Solidly above Kumo cloud (strongly bullish)
Tenkan-sen (9-period): 23,847 (short-term trend line)
Kijun-sen (26-period): 23,712 (medium-term trend support)
Senkou Span A: 23,780 (leading span A)
Senkou Span B: 23,445 (leading span B - key support)
Chikou Span: Positioned above price action confirming bullish momentum
Future Kumo (26 periods ahead):
- Thick ascending cloud structure indicating continued bullish bias
- Cloud support zone: 24,200-24,400 (future support levels)
- Kumo twist anticipated: Mid-October 2025
Ichimoku Trading Signals
TK Cross: Tenkan above Kijun (bullish signal active)
Price vs Cloud: Above cloud with strong momentum
Chikou Span: Clear above price history (confirmation signal)
---
Technical Indicators Deep Dive
RSI (Relative Strength Index) Analysis
Daily RSI: 64.8 (healthy bullish momentum, not overbought)
Weekly RSI: 58.3 (room for further upside)
4H RSI: 67.2 (approaching overbought but sustainable)
RSI Divergence: No bearish divergence detected, momentum intact
Bollinger Bands Analysis
Current Position: Price testing upper band resistance
Band Width: Expanding, indicating increasing volatility
BB Squeeze: Recent breakout from squeeze formation
%B Indicator: 0.78 (strong but not extreme reading)
VWAP Analysis (Volume Weighted Average Price)
Daily VWAP: 23,876 (current support level)
Weekly VWAP: 23,654 (key support zone)
Monthly VWAP: 23,423 (major trend support)
Volume Profile: High volume acceptance above 23,500
Moving Average Structure
10 EMA: 23,789 (immediate dynamic support)
20 EMA: 23,712 (short-term trend support)
50 SMA: 23,534 (intermediate support)
100 SMA: 23,287 (key trend support)
200 SMA: 22,845 (major trend support)
Moving Average Signals:
- All major EMAs in bullish alignment
- Golden Cross intact (50/200 cross maintained)
- Price above all key moving averages
---
Support & Resistance Analysis
Primary Resistance Levels
1. R1: 24,000 (psychological and Gann resistance)
2. R2: 24,200-24,400 (2x1 Gann angle cluster)
3. R3: 24,500-24,650 (Harmonic completion zone)
4. R4: 24,800-25,000 (Major extension target)
5. R5: 25,200-25,500 (Long-term Elliott Wave target)
Primary Support Levels
1. S1: 23,712 (Kijun-sen support)
2. S2: 23,500-23,600 (recent swing low zone)
3. S3: 23,200-23,400 (Harmonic support/Weekly VWAP)
4. S4: 22,800-23,000 (1x2 Gann angle/100 SMA)
5. S5: 22,400-22,600 (Major correction target)
Volume-Based Support/Resistance
High Volume Node: 23,400-23,600 (strong support zone)
Low Volume Gap: 24,100-24,300 (potential fast move zone)
Volume Resistance: 24,500+ (historical selling pressure)
---
Multi-Timeframe Trading Strategies
Scalping Strategy (5M & 15M Charts)
5-Minute Timeframe Approach:
Entry Signals: Pullbacks to 10 EMA with RSI <35
Profit Targets: 30-50 points per trade
Stop Loss: 20-25 points maximum risk
Volume Filter: Require above-average volume on entries
Time Window: Focus on 9:00-11:00 AM and 2:00-4:00 PM CET
15-Minute Scalping Strategy:
Range Trading: Current range 23,850-24,050
Breakout Method: Volume spike above 24,050 for continuation
Mean Reversion: Fade moves beyond 2.5 standard deviations from VWAP
Risk Management: Maximum 3 trades per session, 1:2 risk-reward minimum
Intraday Trading Framework (30M, 1H, 4H)
30-Minute Chart Strategy:
Trend Following: Long above 20/50 EMA confluence (23,750)
Pattern Trading: Flag and pennant formations near resistance
Target Methodology: Initial 24,100, extended 24,300
Risk Parameters: 40-60 point stops, 2.5:1 reward-to-risk
1-Hour Chart Approach:
Momentum Trading: MACD bullish crossovers above signal line
Support Bounces: Long positions from 23,650-23,750 zone
Resistance Testing: Monitor price action at 24,000 level
Session Management: European session focus (8:00 AM - 5:00 PM CET)
4-Hour Swing Setup:
Cloud Trading: Long positions on Ichimoku cloud support tests
Elliott Wave: Ride Wave 5 extensions toward 24,500+
Fibonacci Levels: Use 38.2% and 50% retracements for entries
Hold Duration: 2-5 days typical position holding period
Swing Trading Strategy (Daily, Weekly, Monthly)
Daily Chart Methodology:
Breakout Strategy: Long on sustained breaks above 24,000
Pullback Entries: Accumulate on tests of 23,400-23,600
Target Progression: 24,200 → 24,500 → 24,800
Position Sizing: Scale in on multiple time frame confirmations
Weekly Chart Analysis:
Primary Trend: Remains strongly bullish above 23,000
Swing Targets: 24,500-25,000 zone for major profit-taking
Risk Management: Weekly closes below 22,800 signal major reversal
Monthly Chart Perspective:
Long-term Trajectory: Multi-year uptrend intact
Secular Bull Market: Target zones 26,000-28,000 by 2026-2027
Major Support: 21,500-22,000 zone (not expected to test)
---
Day-by-Day Trading Plan: September 2-6, 2025
Monday, September 2, 2025
Market Status: Full trading session (US markets closed - Labor Day)
European Focus: Increased volatility potential due to US absence
Key Levels:
Resistance: 24,000, 24,150
Support: 23,780, 23,650
Trading Strategy:
Morning Session (9:00-12:00 CET): Range trading likely, fade extremes
Afternoon Session (13:00-17:30 CET): Reduced US influence, European-driven moves
Setup Focus: Long 23,750-23,850, Short above 24,100 without volume
Risk Management: Reduced position sizes due to holiday conditions
Tuesday, September 3, 2025
Market Outlook: Full global participation returns
Key Events: German economic data releases, ECB officials speeches
Strategy Framework:
Breakout Focus: Monitor 24,000 level for volume-confirmed breaks
Economic Data: German manufacturing PMI and employment data impact
Entry Zones: Long 23,800-23,900 on pullbacks
Target Areas: 24,150-24,300 on breakout scenarios
Risk Considerations:
- ECB policy communication sensitivity
- German economic data deviation impact
- Post-holiday volume normalization
Wednesday, September 4, 2025
Market Outlook: Mid-week momentum session with ECB focus
Key Events: Potential ECB policy signals, European inflation data
Trading Approach:
Trend Continuation: Above 23,850 favors further upside
Policy Sensitivity: ECB dovish signals bullish for DAX
Technical Setup: Watch for 1-2-3 reversal patterns at resistance
Volume Analysis: Require institutional participation for sustained moves
Thursday, September 5, 2025
Market Outlook: Pre-weekly close positioning
Focus Areas: Technical level respect, institutional flows
Strategy Elements:
Resistance Testing: 24,200-24,400 zone critical
Support Validation: 23,650-23,750 area strength
Pattern Completion: Monitor harmonic pattern developments
Risk-Off Scenarios: Safe-haven flows could pressure DAX
Friday, September 6, 2025
Market Outlook: Weekly close dynamics, position squaring
Key Considerations: NFP impact on global sentiment, weekly technical levels
Trading Framework:
Weekly Close: Above 23,900 maintains bullish structure
Profit-Taking: Expect some long position liquidation
Gap Risk: Prepare for weekend news flow impact
Setup Preservation: Maintain positions with weekly support above 23,700
---
Macroeconomic & Policy Considerations
European Central Bank Policy Impact
The ECB's monetary policy stance remains crucial for DAX performance. Recent ECB decisions show the Governing Council decided to lower the three key ECB interest rates by 25 basis points in March 2025, with domestic price pressures continuing to ease, with wages growing more slowly. This dovish stance supports equity valuations and German corporate profitability.
German Economic Outlook
The German economic environment presents mixed signals. While economic activity is expected to broadly stagnate in 2025 and trade tensions are set to significantly weigh on exports, there are positive factors including Germany's fiscal stimulus supporting better growth prospects.
Eurozone Growth Projections
The broader eurozone context shows Real GDP projected to grow by 0.9% in 2025, 1.1% in 2026 and 1.3% in 2027, with EA GDP growth to average 0.9% in 2025 and accelerate to 1.3% in 2026.
Key Risk Factors
1. Trade Policy Uncertainty: Trade policy uncertainty over recent months is expected to reduce global growth
2. Global Trade Tensions: Ongoing US-China trade dynamics affecting European exports
3. ECB Policy Divergence: Potential policy normalization pressures
4. Geopolitical Risks: Eastern European tensions and energy security concerns
---
Sector Analysis & DAX Components
Best Performing Components
Current analysis shows the champion of GERMAN STOCK INDEX (DAX) is XETR:ENR — it's gained 265.49% over the year, indicating strong sectoral divergence within the index.
Sector Rotation Implications
Technology Sector: Leading performance driving index higher
Industrial Sector: Mixed performance due to export pressures
Financial Sector: Benefiting from ECB policy normalization expectations
Consumer Discretionary: Supported by potential wage growth and consumer spending
---
Risk Management Framework
Position Sizing Guidelines
Scalping Positions: 0.5-1% account risk per trade
Intraday Trades: 1-2% account risk maximum
Swing Positions: 2-3% account risk per position
Maximum Exposure: 8% total DAX-related risk at any time
Stop-Loss Protocols
Scalping: 20-30 points maximum loss
Intraday: 50-80 points based on volatility
Swing Trading: Below key support levels (23,400 for current longs)
Technical Stops: Below major moving averages and pattern invalidation levels
Profit-Taking Strategy
Scaling Approach: Take 40% at first target, 35% at second target, hold 25% for extensions
Trailing Stops: Implement after 2:1 favorable movement
Time-Based Exits: Close positions before major ECB announcements
Pattern-Based Exits: Honor harmonic pattern completion zones
---
Weekly Outlook Probability Analysis
Bullish Scenario (Probability: 65%)
Catalysts:
- ECB maintains dovish policy stance
- German economic data shows stabilization signs
- Technical breakout above 24,000 with volume
- US-Europe trade tensions remain contained
Price Targets:
- Initial: 24,200-24,400
- Extended: 24,500-24,800
- Optimistic: 25,000+
Neutral/Consolidation Scenario (Probability: 25%)
Characteristics:
- Range-bound trading between 23,600-24,200
- Mixed economic signals from Germany
- ECB policy uncertainty
- Technical indecision at resistance levels
Trading Range:
- Upper Bound: 24,100-24,200
- Lower Bound: 23,500-23,600
- Strategy: Range trading, fade extremes
Bearish Scenario (Probability: 10%)
Risk Factors:
- Significant deterioration in German economic data
- ECB hawkish surprise or policy error
- Major geopolitical shock
- Technical breakdown below 23,400
Downside Targets:
- Initial: 23,000-23,200
- Extended: 22,600-22,800
- Crisis: 22,000-22,400
---
Advanced Trading Techniques
Correlation Analysis
EUR/USD Impact: Strong positive correlation (0.72)
US500 Relationship: Moderate correlation (0.58) with divergence potential
Bond Yields: German Bund yields inverse relationship
Commodity Exposure: Energy prices correlation through industrial components
Options Market Insights
Put/Call Ratio: Currently neutral, no extreme positioning
Options Skew: Slight put premium indicating downside hedging
Gamma Exposure: Positive gamma above 23,800, negative below
Key Strike Levels: 24,000 calls, 23,500 puts show high open interest
Institutional Flow Analysis
Foreign Investment: Positive European equity flows from US institutions
Pension Fund Activity: Rebalancing flows supporting DAX components
Hedge Fund Positioning: Net long but not extreme levels
ETF Flows: Consistent inflows into German equity ETFs
---
For individuals seeking to enhance their trading abilities based on the analyses provided, I recommend exploring the mentoring program offered by Shunya Trade. (Website: shunya dot trade)
I would appreciate your feedback on this analysis, as it will serve as a valuable resource for future endeavors.
Sincerely,
Shunya.Trade
Website: shunya dot trade
---
*This analysis is for educational purposes only and does not constitute investment advice. Always implement proper risk management and consult with qualified financial professionals before making investment decisions.* Disclaimer: This post is intended solely for educational purposes and does not constitute investment advice, financial advice, or trading recommendations. The views expressed herein are derived from technical analysis and are shared for informational purposes only. The stock market inherently carries risks, including the potential for capital loss. Therefore, readers are strongly advised to exercise prudent judgment before making any investment decisions. We assume no liability for any actions taken based on this content. For personalized guidance, it is recommended to consult a certified financial advisor.
---
FTSE100 (September 1st - 5th, 2005)FTSE100 Technical anaylsis.
Simlpy you have a bearish trend line (1hour chart) once it break it I am bullish.
Don't forget monday is a holiday in US and Canada (Labor day).
Thank you all
MarketsTitan

CADCHF SELLSI entered a sell on CADCHF that I didn’t share earlier. The reason behind the trade was that price mitigated a Daily inefficiency, which caused the 4H bullish structure to flip. After the flip, price pulled back into a well-defined 4H supply zone. I waited for confirmation on the 15-minute timeframe, and once the structure shifted there, the entry was triggered. Price has returned to the entry area, but the trade remains valid as long as the structure is intact. I'm aiming for a nice swing move if price cooperates, and I’ll definitely take partials at the first significant low.

$EUIRYY -Europe CPI (July/2025)ECONOMICS:EUIRYY
July/2025
source: EUROSTAT
- Eurozone consumer price inflation held steady at 2.0% year-on-year in July 2025, unchanged from June but slightly above market expectations of 1.9%, according to preliminary estimates.
This marks the second consecutive month that inflation has aligned with the European Central Bank’s official target.
A slowdown in services inflation (3.1% vs 3.3% in June) helped offset faster price increases in food, alcohol & tobacco (3.3% vs 3.1%) and non-energy industrial goods (0.8% vs 0.5%).
Energy prices continued to decline, falling by 2.5% following a 2.6% drop in June.
Meanwhile, core inflation—which excludes energy, food, alcohol, and tobacco—remained unchanged at 2.3%, its lowest level since January 2022.
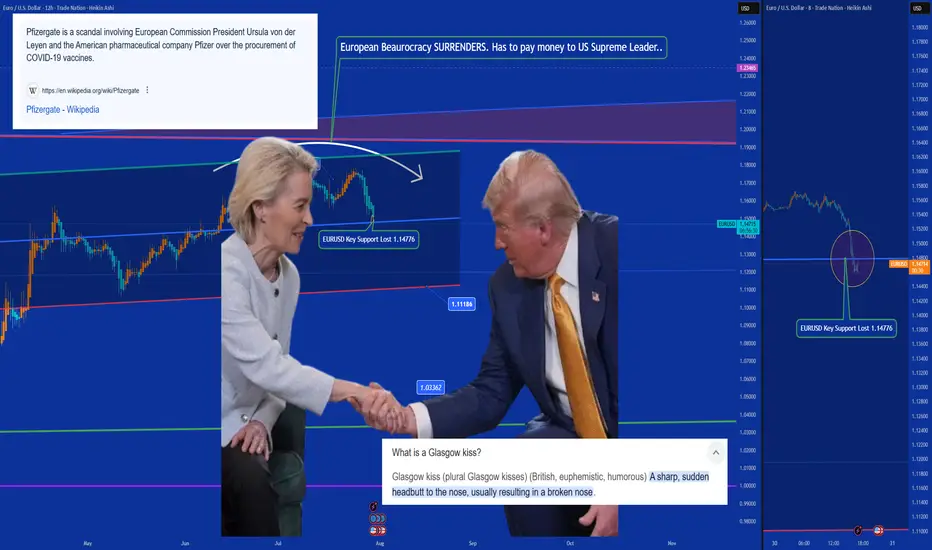
Ursulization = Bureaucracy > Democracy (a.k.a. The Glasgow Kiss)🤝💥 Ursulization – Bureaucracy Replaces Democracy (a.k.a. The Glasgow Kiss) 🇺🇸🇪🇺
📍Background:
The media spun it as a "15% tariff agreement"…
But in reality, this wasn’t diplomacy — it was a disguised capitulation.
And the stage? None other than Scotland, ancestral ground of Donald J. Trump.
So when Ursula von der Leyen came seeking a gentle diplomatic handshake…
What she received instead was the infamous Glasgow Kiss — sudden, sharp, and unmissable.
💥 What’s a Glasgow Kiss?
A British slang term for a violent headbutt to the face —
No grace. No warning. Just raw force.
💬 The Real Story:
Ursula von der Leyen — unelected, unaccountable —
signed off on $1.4 trillion in U.S.-bound capital flows:
💸 $750B to buy American energy
🛠 $600B in U.S. infrastructure, defense & industry
All to sidestep 50% tariffs the Trump team had ready to roll.
But here's the kicker:
She wasn’t acting on behalf of European citizens.
She was speaking for the bureaucracy, not the people.
🔥 Welcome to Ursulization:
Where democracy is sidelined by unelected power.
Where negotiations happen in silence.
Where scandals like PfizerGate get buried while the euro breaks down.
📉 EUR/USD just lost key support at 1.14776 —
The chart shows t he cost of surrender.
💉 PfizerGate Reminder:
Ursula already faced heat for secretive vaccine contracts with Pfizer.
Now, she’s handing over Europe’s industrial backbone —
To Trump. In Scotland. With no public mandate.
📌 Conclusion:
Trump didn’t compromise — he collided.
Europe didn’t resist — it surrendered.
This wasn’t diplomacy.
It was a Glasgow Kiss — a collision between legitimacy and bureaucratic power.
👑 One elected by the people (Trump). One not elected at all (Woke agenda style Ursula).
💰 One walks away with trillions (Trump). The other, with silence (Ursula 'Von der Pfizinen never electenen'').
One Love,
The FXPROFESSOR 💙
ps. Till we can bring Democracy and Europe back.
Disclosure: I am happy to be part of the Trade Nation's Influencer program and receive a monthly fee for using their TradingView charts in my analysis. Awesome broker, where the trader really comes first! 🌟🤝📈
$EUGDPQQ -Europe GDP (Q2/2025)ECONOMICS:EUGDPQQ
Q2/2025
source : EUROSTAT
- The Gross Domestic Product (GDP) In the Euro-Area expanded 0.10 percent in the second quarter of 2025 over the previous quarter.
GDP Growth Rate in the Euro Area averaged 0.37 percent from 1995 until 2025, reaching an all time high of 11.60 percent in the third quarter of 2020 and a record low of -11.10 percent in the second quarter of 2020.
$EUINTR - Europe Interest Rates (July/2025)ECONOMICS:EUINTR
July/2025
source: European Central Bank
- The ECB kept interest rates unchanged in July, effectively marking the end of its current easing cycle after eight cuts over the past year that brought borrowing costs to their lowest levels since November 2022.
The main refinancing rate remains at 2.15%, while the deposit facility rate holds at 2.0%. Policymakers struck a wait-and-see stance, as they evaluate the impact of lingering trade uncertainty and the potential fallout from proposed US tariffs on economic growth and inflation.
Inflation hit the ECB’s 2% target in June, adding to the case for a pause in policy adjustments. Speaking at the ECB press conference, President Lagarde said the central bank is “in a good place” but acknowledged the difficulty in assessing how tariffs will affect price outlooks, given the mix of both inflationary and disinflationary pressures.
On the recent euro appreciation, Lagarde reiterated that the ECB does not target exchange rates directly but considers them when forecasting inflation.
$DHER to $40- XETR:DHER i.e Delivery Hero is working towards profitability and exiting markets where it doesn't want to burn on operations.
- Company is becoming leaner, meaner and strategic in areas where it operates and dominates.
- Region MENA is growing (31% YoY)
- It has nice free cash flow per share growth. XETR:DHER posted ~227% YoY growth in free cash flow, putting it in the top 10% of its peers, well above its 3‑year average of ~32% .

$EUIRYY - Europe CPI (June/2025)ECONOMICS:EUIRYY 2%
June/2025
source: EUROSTAT
- Eurozone consumer price inflation rose slightly to 2.0% year-on-year in June 2025, up from May’s eight-month low of 1.9% and in line with market expectations, according to a preliminary estimate.
The figure aligns with the European Central Bank’s official target.
Among major economies, inflation in Germany unexpectedly declined, while France and Spain saw modest increases and Italy’s rate held steady.

$EUINTR - Interest Rates Cut (June/2025)ECONOMICS:EUINTR
(June/2025)
source: European Central Bank
- The ECB cut key interest rates by 25 bps at its June meeting,
based on updated inflation and economic forecasts.
Inflation is near the 2% target, with projections showing 2.0% in 2025 (vs 2.3% previously), 1.6% in 2026 (vs 1.9% previously), and 2.0% in 2027.
Core inflation (excluding energy and food) is seen at 2.4% in 2025, then easing to 1.9% in 2026–2027.
GDP growth is forecast at 0.9% in 2025, 1.1% in 2026 (vs 1.2% previously), and 1.3% in 2027, supported by higher real incomes, strong labour markets, and rising government investment, despite trade policy uncertainties weighing on exports and business investment.
Scenario analysis shows trade tensions could reduce growth and inflation, while resolution could boost both.
Wage growth is still high but slowing, and corporate profits are helping absorb cost pressures.
President Lagarde said that the central bank is approaching the end of a cycle, suggesting a pause may be on the horizon following today’s reduction.

$EUIRYY - Europe CPI below 2% Target (May/2025)ECONOMICS:EUIRYY 1.9%
May/2025
source: EUROSTAT
- Eurozone CPI eased to 1.9% year-on-year in May 2025,
down from 2.2% in April and below market expectations of 2.0%.
This marks the first time inflation has fallen below the European Central Bank’s 2.0% target since September 2024, reinforcing expectations for a 25 basis point rate cut later this week and raising the possibility of additional cuts.
A key driver of the deceleration was a sharp slowdown in services inflation, which dropped to 3.2% from 4.0% in April, its lowest level since March 2022.
Energy prices continued to decline, falling by 3.6% year-on-year, while inflation for non-energy industrial goods held steady at 0.6%.
In contrast, prices for food, alcohol, and tobacco accelerated, rising 3.3% compared with 3.0% the previous month.
Meanwhile, core inflation, which excludes volatile food and energy components, slipped to 2.3%, the lowest reading since January 2022. source: EUROSTAT
