Coinbase, weekly hidden bullish divergence NASDAQ:COIN has been getting rekt alongside Bitcoin.
It has now closed below its weekly 200EMA and below the weekly pivot, a very bearish sign and it must recover to feel bullish again. Wave 2 of 5 now sits at he 0.786 fibonacci, a deep retracement for this stock.
If price falls below $141, hidden bullish divergence will be negated and the Elliot wave count is invalidated and a macro wave 2 is in play.
Price has fallen out of the multiyear uptrend line.
Ugly
Safe trasing
Exchange

COIN Short-term analysis | Trading and expectationsNASDAQ:COIN
🎯 Price continued lower, ignoring all bullish divergences, though another is forming. Price has filled the gap and sits in the golden pocket. The bears are in control.
📈 Daily RSI has printed bullish divergence from oversold, a strong bottoming signal.
👉 Analysis is invalidated above $263, suggesting a major bottom is in
Volatility analysis | Expected range & extremities
🎯COIN behaving as expected. Price tested the SD+2 threshold 3 times and was rejected to fv each time. No momentum took hold despite COIN’s big run. Price is at fv.
👉Fair value is ~$225
Safe trading

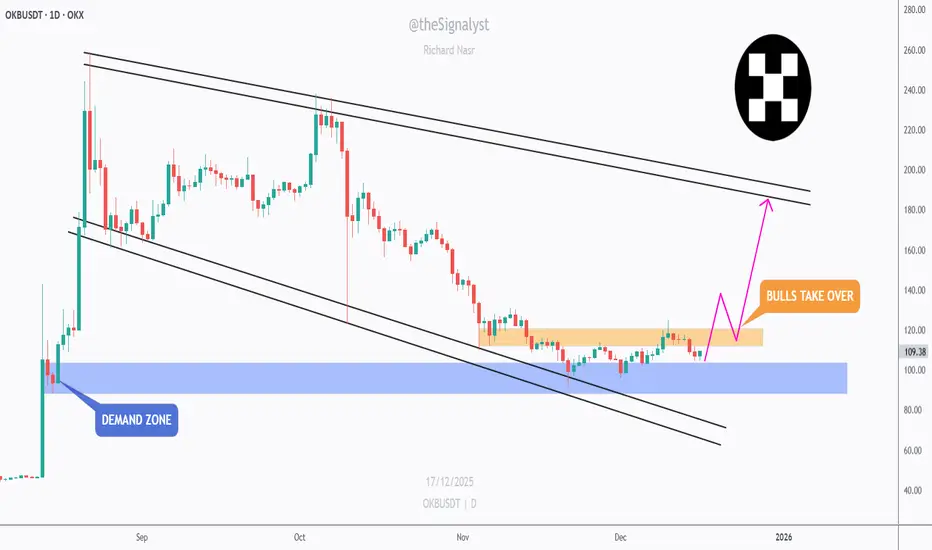
OKB - The 100 Level TestThis one is pretty straightforward.
OKB is still trading inside a clear range, and price is now pushing into the lower bound of that range, right around the $100 round number.
That area matters. It has acted as support before, and it’s doing so again....
As long as:
• the lower range support holds
• and $100 remains intact
➡️ I’ll be looking for long setups , targeting a move back toward the upper bound of the range.
If $100 fails, the idea is invalid.
If it holds, the range trade remains in play.
⚠️ Disclaimer: This is not financial advice. Always do your own research and manage risk properly.
📚 Stick to your trading plan regarding entries, risk, and management.
Good luck! 🍀
All Strategies Are Good; If Managed Properly!
~Richard Nasr

Exchange Tokens and What the Market Often Realizes Too LateToday in Davos, Changpeng Zhao (CZ) once again stated a simple but important idea:
the crypto industry has already proven its effectiveness at scale.
If you strip away noise and emotions, one fact becomes obvious:
exchanges are among the most resilient and profitable businesses in crypto.
___________________________________________
📌 A note on context and timing
For additional context, I want to point out that this is not a new thesis for me.
I already wrote about cryptocurrency exchanges as a core growth layer back on April 17, 2020 — almost six years ago — and shared a dedicated chart at that time.
What’s important here is not the post itself, but what happened after.
If you now open that historical chart and review each native exchange token that was included back then, you’ll notice an interesting detail:
Almost all of them have outperformed Bitcoin over time — on a relative basis.
Some did it by 1x, some by 2x or more, but the key point remains the same:
at today’s levels, their performance relative to BTC has increased.
That outcome was not driven by hype.
It was driven by:
growing volumes
expanding functionality
and exchanges evolving into full-scale platforms
Which is exactly why this topic keeps returning every cycle.
___________________________________________
🔍 What matters here
On the chart, you see native tokens of centralized and decentralized exchanges.
No marketing narratives. No promises. Just long-term performance.
There is a clear pattern:
volumes → fees
fees → business sustainability
sustainability → native token valuation
In essence, a native exchange token reflects the real state of the exchange itself.
___________________________________________
🔁 Why this topic is relevant again
Over recent cycles, the market has already seen:
strong performance from perpetual DEX tokens GETTEX:HYPE SEED_WANDERIN_JIMZIP900:ASTER and other
token distributions based on activity and trading volumes
situations where users gained exposure before any public announcements
One important point is often overlooked:
Exchange tokens are usually distributed (Airdrop) not for waiting,
but for actually using the platform.
Trading activity, volumes, account engagement, and interaction with features
are what historically determine future allocation.
Many people are actively doing this now, building volumes on their accounts to receive a drop in the form of future exchange tokens.
Using diversification, they open positions in different directions on different exchanges.
___________________________________________
🧠 A subtle point many miss
The market currently has:
- exchanges with existing tokens
- and exchanges without tokens yet, but with rapidly growing activity
Historically, this second category often provides:
- better risk-to-reward asymmetry
- the ability to build exposure early
- exponential upside potential after launch
This is not about short-term trades.
This is about long-term accumulation over months.
___________________________________________
⚠️ Look closely at the charts
The overall structure is surprisingly consistent —
and that consistency itself is a signal.
The market consistently rewards:
- infrastructure
- liquidity
- real business models
Not narratives.
💬 Question to you
I’m curious about your perspective.
Share in the comments:
- which CEXs or DEXs you actively use
- whether you track exchanges without native tokens yet
- if you consider activity and volume important long-term factors
- which segments currently look most undervalued to you
I read the comments carefully,
and if there’s interest, I’ll continue this topic in future posts.
This post is for those who think one cycle ahead,
not just about the next price move.
Best regards EXCAVO

OKB - The Level Everyone Is Watching!OKB is currently sitting at a very strong rejection zone , and this one is hard to ignore.
Price is reacting around the $100 round number, which lines up perfectly with a clear demand zone. This area has already proven its importance in the past, and once again, buyers are stepping in.
Structurally, OKB is still trading inside a falling wedge, which is typically a bullish formation when defended from below.
As long as this demand + round number confluence continues to hold, I’ll be looking for trend-following long setups, targeting a move back toward the upper bound of the falling wedge.
⚠️ Disclaimer: This is not financial advice. Always do your own research and manage risk properly.
📚 Stick to your trading plan regarding entries, risk, and management.
Good luck! 🍀
All Strategies Are Good; If Managed Properly!
~Richard Nasr

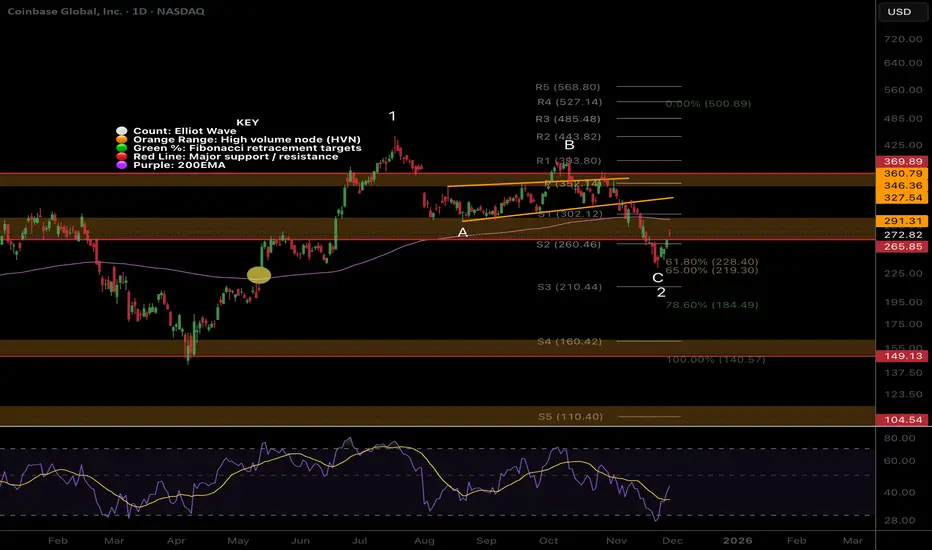
COIN Macro analysis | The bigger picture | Long-term holdersNASDAQ:COIN
🎯 Coinbase is still in a wave 2 (V), finding support at the orange trend line and weekly 200EMA, just below the weekly pivot, in the golden pocket. There is a lot of confluence here to suggest a bottom will form. Wave (v) has a target of the R3 weekly pivot at $701.
📈 Weekly RSI is below the EQ with room to fall, though it often bottoms around this area and never reaches oversold.
👉 Analysis is invalidated below wave (IV), $149
Safe trading

COIN Short-term analysis | Trading and expectationsNASDAQ:COIN
🎯 Price appears to have completed wave C of 2, a corrective pattern to the downside, filling the gap left in May 2024. Coin recovered above the daily pivot, but below the daily 200EMA so direction is ambigous.
📈 Daily RSI has printed bullish divergence from oversold, a strong bottoming signal.
👉 Analysis is invalidated below wave C, $220, keeping the downtrend alive.
Safe trading

OKB - Quiet Accumulation Before the Next Move?OKB has been through a long corrective phase, grinding lower inside a descending channel.
What stands out now is context.
Price is sitting on a major demand zone, a level that previously sparked strong upside momentum.
Since tapping this area, sellers have clearly slowed down, and price has started to compress rather than continue lower. That’s usually the first sign that selling pressure is getting absorbed.
At the same time, OKB is now pushing back toward the key structure above. This is the line in the sand.
As long as we’re holding above demand, I’m not interested in chasing shorts down here.
🏹For bulls to truly take over , we’ll need a clean break and acceptance above the orange structure zone. That’s when momentum shifts from defensive to offensive.
Until then, we wait :)
⚠️ Disclaimer: This is not financial advice. Always do your own research and manage risk properly.
📚 Stick to your trading plan regarding entries, risk, and management.
Good luck! 🍀
All Strategies Are Good; If Managed Properly!
~Richard Nasr

BNB Macro analysis | The bigger picture | Long-term holdersCRYPTOCAP:BNB
🎯 Price completed a macro wave 3 with bearish divergence on the RSI. Wave 4 is expected to end at the 0.382 Fibonacci $640, and can not extend below the 0.5 Fib, $506. Crypto assets can overextend in wave 5, which I believe we will see in 2026, with a terminal target of the R5 weekly pivot target, $2000, a psychological milestone where heaving selling may begin.
📈 Wave 4 is still underway, testing the previous all-time High Volume Node, 0.236 Fibonacci retracement, $760. Weekly RSI is at the EQ, where a bottom was found the previous two times and the price returned to an all-time high.
👉 Analysis is only invalidated if price falls below the 0.5 Fib, $506.
Safe trading

UNI - Long idea.BINANCE:UNIUSDT.P
I am waiting for a reaction at this level. The nearest target is to break through the $6.1 high.
Add it to your watch list. Set alerts and wait for the price to approach the level.
I will not short. I will work strictly from the level.

OKB - Are Bulls About to Flip the Script?📉After a prolonged corrective phase, OKB is starting to show early signs of structural stabilization. Price has respected the major demand zone, where selling pressure slowed down and downside momentum clearly weakened.
⚔️What stands out now is the tight consolidation above demand, combined with a gradual reclaim of higher levels. This type of behavior often signals a shift from distribution to accumulation, especially after a long bearish channel.
📍The key focus is the orange resistance band. A clean break and hold above this area would be a strong confirmation that bulls are taking control, opening the door for a larger recovery move toward the upper bounds of the broader structure.🏹
Until that breakout happens, patience is key. Let price prove strength before committing aggressively. But structurally, this is one of those zones where risk starts favoring the upside, not the downside.
Is this the quiet phase before expansion? 🤔
⚠️ Disclaimer: This is not financial advice. Always do your own research and manage risk properly.
📚 Stick to your trading plan regarding entries, risk, and management.
Good luck! 🍀
All Strategies Are Good; If Managed Properly!
~Richard Nasr
USD/ZAR Outlook: Strategic Stability vs. Structural RisksThe US Dollar to South African Rand (USD/ZAR) exchange rate remains a critical barometer for emerging market sentiment, closing recently around 17.32. While UBS forecasts "limited upside" for the pair, implying Rand resilience, strategic analysis across multiple domains reveals a complex tug-of-war between fiscal consolidation and persistent structural headwinds.
Macroeconomics: The Fiscal Anchor
South Africa’s 2025 Medium Term Budget Policy Statement signaled a turning point in fiscal management. The National Treasury projected a consolidated budget deficit of 4.7% of GDP, a figure better contained than earlier fears suggested. This improved discipline, driven by solid revenue collection, supports the Rand by reducing sovereign risk premiums. Furthermore, the decision to lower the inflation target to 3% demonstrates the Reserve Bank’s assertive commitment to price stability, theoretically strengthening the currency's purchasing power parity over the long term.
Geopolitics and Geostrategy: The FATF Catalyst
A pivotal geostrategic victory was South Africa’s removal from the Financial Action Task Force (FATF) grey list in October 2025. This milestone reduces transaction costs for cross-border capital flows and reintegrates domestic financial institutions into the global high-trust network. Consequently, the risk premium embedded in the USD/ZAR exchange rate has diminished, limiting the Dollar’s upside potential. However, global trade fragmentation and protectionist policies in major trading partners (the US, China) remain latent geopolitical risks that could swiftly reverse these gains.
Industry Trends and Patent Analysis: Mining Innovation
The Rand’s performance is inextricably linked to the mining sector. Recent patent trends in Platinum Group Metals (PGM) extraction technologies indicate a shift toward more efficient, lower-energy recovery processes. As global demand for green hydrogen technologies—reliant on PGMs—accelerates, South African mines are positioning themselves to capitalize on this secular trend. UBS notes that the fiscal benefits of higher metal prices have yet to fully materialize, suggesting a delayed but potentially potent tailwind for the Rand heading into 2026.
Cyber Resilience and Financial Infrastructure
In the digital domain, the integrity of South Africa's financial infrastructure is paramount. The South African Reserve Bank’s cyber-resilience frameworks have fortified the banking sector against an escalating threat landscape, including ransomware and state-sponsored actors. This robust cyber-defense posture maintains foreign investor confidence in the JSE (Johannesburg Stock Exchange), preventing capital flight that would otherwise weaken the Rand.
Management and Leadership: Governance of National Unity
The formation of the Government of National Unity (GNU) has introduced a new dynamic in public sector leadership. The shift toward "coalition management" has enforced stricter checks and balances on public spending, mirroring corporate governance best practices. This cultural shift within government departments is reducing wasteful expenditure, directly supporting the Treasury’s deficit reduction goals, and stabilizing the currency.
Conclusion: Limited Upside for USD
UBS tactically favors selling USD/ZAR upside, viewing the pair as capped near current levels. The confluence of fiscal discipline, geostrategic reintegration (FATF), and resilient mining exports creates a formidable defense for the Rand. Unless global risk sentiment deteriorates sharply, the structural improvements in the South African economy suggest the path of least resistance for USD/ZAR is sideways to lower.

COINBASE Still looks strong!NASDAQ:COIN Coinbase appears to have printed completed 2 of (V), extending the targets to the upper boundary trend-line and R4 weekly pivot, $718.
Price found support at the weekly pivot just above the weekly 200EMA and lower trend-line.
🎯 Terminal target for the business cycle could see prices as high as $718 based on the weekly pivots
📈 Weekly RSI has reset below the EQ.
👉 Analysis is invalidated below wave (IV)
Safe trading

COIN bottom forming? Wave 4 changed to wave 2NASDAQ:COIN Price appears to be completing wave C of IV, a corrective pattern to the downsid,e expected to be shallow
Wave 4 was invalidated due to the retracement depth becoming wave 2 of V, which actually presents a bigger target for the wave 3 move to come. Price stopped at the golden pocket reflecting its higher cap characteristics.
📈 Daily RSI has printed a confirmed bullish divergence from oversold.
👉 Continued downside has a target of the S2 pivot at $210
Safe trading
OKB - Demand Holding Strong… Correction on the Horizon?📉OKB is currently trading inside a broad falling channel , but price has just reacted from a major demand zone, which also aligns with the lower bound of the black channel. This confluence creates a strong oversold area where buyers typically step in.
⚔️As long as this demand zone continues to hold, we will be looking for bullish correction setups toward the upper bound of the falling channel. This would be the natural corrective wave after an extended sell-off.
🏹However, for the bulls to fully confirm control, price must break and hold above the orange high. A breakout above that structure would signal a shift in momentum and open the way for a larger trend reversal.
For now, demand is holding, the channel is intact, and the market is positioned for a potential rebound… will OKB deliver the correction we’re waiting for? 🤔
⚠️ Disclaimer: This is not financial advice. Always do your own research and manage risk properly.
📚 Stick to your trading plan regarding entries, risk, and management.
Good luck! 🍀
All Strategies Are Good; If Managed Properly!
~Richard Nasr
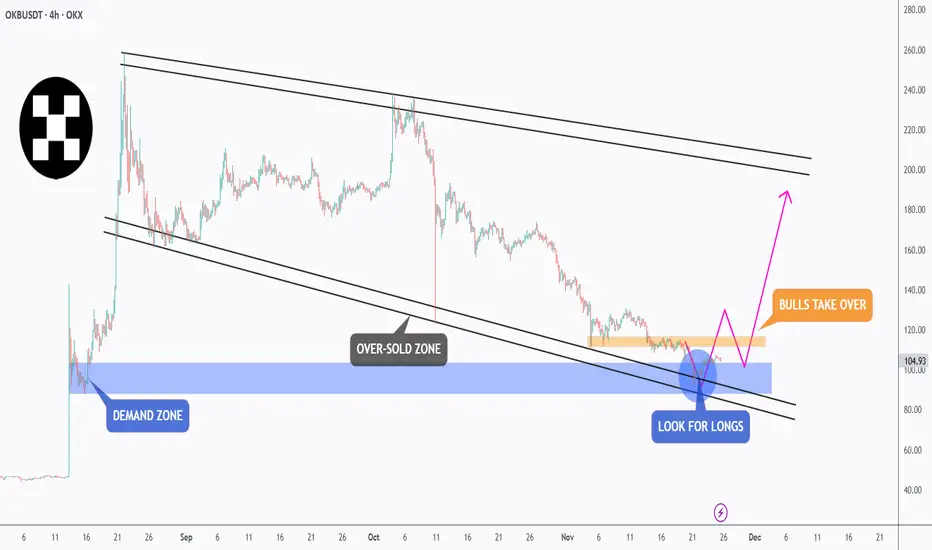
OKB - Entering the Oversold Zone!📉OKB has been steadily correcting within a descending channel , but the price is now approaching a massive confluence area, the intersection of the blue demand zone, lower black trendline, and the oversold region.
⚔️This area has historically acted as a strong accumulation zone, where buyers tend to step back in and drive the next impulsive wave. From here, I’ll be looking for long opportunities, ideally after a clear bullish confirmation or a break above the short-term red channel.
🏹If the bulls manage to defend this zone, we could see a strong push toward the upper bound of the black channel, around the $200 mark.
⚠️ Disclaimer: This is not financial advice. Always do your own research and manage risk properly.
📊All Strategies Are Good; If Managed Properly!
~Richard Nasr

Coinbase wave C underway NASDAQ:COIN Price appears to be completing wave C of IV, a corrective pattern to the downside expected to be shallow.
Wave IV are often shallow ending no further than the 0.5 Fibonacci retracement. This is just below the S2 pivot and High Volume Node support. 0.382 is the higher probability target for the end of the downwards move aligning with a swing below the daily 200EMA and S1 pivot.
Daily RSI has room to fall.
Breaking wave B would suggest a new bull move is underway.

COIN Much higher to comeCoinbase had a shallow pullback in wave (II) after running 10x in wave (I). Wave (II) was expected to reach the 0.618 Fibonacci retracement but was front run above the 0.5 demonstrating long term strength.
R5 weekly pivot target is now $841 which is expected to be hit if we get tailwind momentum in wave (III). Price appears to be finding a bottom locally and preparing for the next leg up into price discovery.
RSI has plenty of room for months of overextension in price.
🎯 Terminal target for the business cycle could see prices as high as $800 based on the weekly pivots
📈 Weekly RSI is oversold with no divergence and can remain here for months as price keeps increasing.
👉 Analysis is invalidated below wave (II), $148

Coinbase Bottom in, new all time high coming?NASDAQ:COIN had a deep pullback after its recent bullish move but caught a large bid by the end of the week leaving a long lower wick. It appears the bottom is in but investors should be cautious as price is below resistance major resistance High Volume Node and R1 weekly pivot.
If the pullback is complete then we have a very shallow wave 2 within wave (II) and can expect much higher targets perhaps in the $1000s before the end of this business cycle. There will resistance at the upper boundary and R3 weekly pivot around $600 and a breakout above that area will signal we go higher.
RSI has plenty of room for months over overextension in price.
I will be looking to add a long so look out for the signal in my Trade Planning Substack.
Safe trading

COIN Still following the plan.... nothing changedNASDAQ:COIN was expected to test the High Volume Node and channel upper boundary after its breakout as support. That happened Friday and touched it precisely during the market chaos we expect to reverse back to trend this week.
Wave V is underway, wave IV completed at the 0.382 Fibonacci retracement and High Volume Node - a high probability area for a bottom.
RSI tapped overbought but no bearish divergence.
The gap has been filled and could market a reversal point lower on the macro and we should watch carefully but the trend is up for now.
Safe trading

Exchange Rate Secrets1. What Are Exchange Rates and Why They Matter
An exchange rate is simply the price of one currency in terms of another. For instance, if $1 = ₹84, that means one US dollar can buy eighty-four Indian rupees.
But this number isn’t just a conversion figure — it’s a snapshot of economic power.
When a country’s currency strengthens, imports become cheaper but exports turn costlier.
When it weakens, exports surge but inflation might rise.
Exchange rates influence:
Global trade balances
Investment decisions
Inflation and interest rates
Tourism and remittances
Stock and commodity markets
Understanding these hidden levers is the first step to decoding the secrets of exchange rate movements.
2. The Real Players Behind the Curtain
Contrary to popular belief, exchange rates don’t move by chance. They’re often influenced — directly or indirectly — by a select few economic giants:
a. Central Banks
Institutions like the US Federal Reserve, European Central Bank, and Reserve Bank of India hold the real levers.
They manipulate interest rates to attract or repel foreign capital.
They intervene in forex markets to stabilize or deliberately weaken their currency.
They issue monetary policies that send shockwaves through global markets.
For example, when the Fed raises interest rates, the US dollar usually strengthens — because higher returns attract global investors.
b. Institutional Traders and Hedge Funds
Major hedge funds trade billions in currencies daily. They anticipate policy changes and use leverage to amplify profits — creating massive short-term moves that can destabilize weaker economies.
c. Governments
Sometimes, governments quietly “manage” their exchange rates for strategic reasons. China, for example, has often been accused of keeping the Yuan undervalued to make its exports more competitive — a tactic dubbed “currency manipulation.”
d. The Market Psychology
Beyond data and policy, market sentiment — the collective emotion of traders — drives currencies. Fear of recession, geopolitical tensions, or even rumors can send exchange rates spinning faster than any spreadsheet can predict.
3. The Core Secrets Behind Currency Movements
Now let’s unlock the deep, often hidden mechanisms that move currencies. These are the five pillars of exchange rate secrets:
1️⃣ Interest Rate Differentials
Currencies tend to flow toward countries with higher interest rates.
If India’s rates are 6% while the US offers 4%, investors may convert dollars to rupees to earn better returns.
This inflow strengthens the rupee.
But here’s the twist: expectations matter more than reality. Even a hint that the Fed may raise rates can trigger massive dollar inflows — long before the actual hike happens.
2️⃣ Inflation and Purchasing Power
Currencies are mirrors of purchasing power.
If inflation is high in one country, its money loses value faster.
Low inflation, on the other hand, indicates stability and boosts confidence.
This is why nations with consistent inflation control — like Switzerland and Japan — often see their currencies appreciated as “safe havens.”
3️⃣ Trade Balances
Countries that export more than they import tend to have stronger currencies.
Why? Because foreign buyers must purchase the exporter’s currency to pay for goods.
For instance, Japan’s trade surplus has historically supported the yen.
Conversely, a nation running persistent trade deficits (like the US) faces downward pressure — unless offset by investment inflows.
4️⃣ Political Stability and Global Confidence
Political chaos often sends investors fleeing.
A coup, election turmoil, or policy uncertainty can cause sudden devaluations.
Meanwhile, stable governments with clear fiscal policies attract long-term investors — strengthening the currency.
When Russia invaded Ukraine in 2022, the ruble initially collapsed. Yet, with aggressive capital controls and energy exports, it later stabilized — showcasing how government measures can rewrite currency fate.
5️⃣ Speculation and Market Manipulation
The most guarded secret: exchange rates aren’t always fair reflections of fundamentals.
Short-term volatility is often fueled by speculation — big money betting on future trends.
Speculators can move billions in seconds, pushing prices away from equilibrium.
Sometimes, their combined power even forces central banks to retreat — like in 1992’s “Black Wednesday”, when George Soros famously broke the Bank of England and earned over $1 billion in a single day.
4. The Hidden Mechanisms: Pegs, Floats, and Hybrids
Every country chooses how “free” its exchange rate should be.
A. Fixed (Pegged) Exchange Rate
Here, the value is tied to another currency, like the US dollar.
Example: Saudi Arabia pegs its riyal to the dollar to stabilize oil revenues.
Advantage: predictability for trade.
Disadvantage: vulnerability to external shocks.
B. Floating Exchange Rate
The value fluctuates based on market demand and supply.
Example: The US dollar, euro, and Indian rupee are managed floats.
Advantage: market-driven flexibility.
Disadvantage: volatility during crises.
C. Managed Float (Dirty Float)
Most modern economies use this hybrid system — allowing markets to move rates but stepping in occasionally to maintain stability.
These systems reveal another secret — that exchange rates are both economic tools and political weapons.
5. Currency Wars and Global Power Play
When one country weakens its currency intentionally, others often retaliate — sparking a currency war.
The logic is simple: a cheaper currency boosts exports and jobs.
But when multiple nations do this simultaneously, it can spiral into global instability.
2010s: The US accused China and Japan of undervaluing their currencies.
2020s: Nations quietly use quantitative easing (printing money) to keep currencies weak.
2025: As emerging markets like India, Brazil, and Indonesia grow, they’re joining this silent battle — balancing competitiveness with credibility.
6. The Psychological Side of Exchange Rates
Money is emotional. Exchange rates reflect not just economic numbers, but confidence.
When investors “believe” in a country’s future — its leadership, innovation, and growth — its currency rises.
Example:
The US dollar thrives during crises — seen as a “safe haven.”
The Swiss franc and Japanese yen surge when global uncertainty spikes.
The Indian rupee strengthens when foreign investors see long-term growth potential.
This psychological dance creates cycles — optimism, panic, correction — that drive exchange rate volatility beyond fundamentals.
7. Modern Secrets: Digital Currencies and Forex Algorithms
The 21st century has introduced new players and tools that redefine how currencies behave.
a. Algorithmic Trading
Over 70% of forex volume now runs on algorithms — automated systems that execute trades based on millisecond data.
These algorithms can amplify moves, creating sharp spikes or sudden reversals within seconds.
b. Cryptocurrencies
Bitcoin and stablecoins have disrupted the concept of “sovereign money.”
Some nations fear them; others embrace them.
El Salvador adopted Bitcoin, while China banned it and launched its own digital yuan — a step toward controlling cross-border transactions.
The secret here: digital currencies could one day bypass traditional exchange rates altogether.
8. The Indian Rupee in the Global Context
India’s exchange rate journey is a fascinating case study:
Pre-1991: A fixed regime tied to the pound, later the dollar.
Post-liberalization: A managed float system with RBI intervention.
Today: The rupee reflects both domestic fundamentals and global capital flows.
Hidden truth?
The RBI quietly smoothens volatility through buying or selling dollars — maintaining competitiveness for exports while protecting inflation targets.
Future outlook:
Stronger digital economy
Growing exports (IT, pharma, energy)
Controlled fiscal deficit
All point toward a more resilient rupee in the long run — though short-term fluctuations will remain.
9. How Traders and Investors Decode Exchange Rate Secrets
Smart investors don’t just watch the numbers — they watch the forces behind them.
Here’s how they stay ahead:
Monitor central bank statements — “forward guidance” often signals currency direction.
Track bond yield differentials — a widening gap means a stronger high-yield currency.
Follow geopolitical developments — sanctions, wars, or trade deals often move currencies overnight.
Use Volume Profile and Market Structure — to identify institutional footprints in forex charts.
Analyze capital flow data — especially FII (Foreign Institutional Investor) movements in emerging markets like India.
By understanding these undercurrents, traders can align with the smart money — not against it.
10. The Future of Exchange Rates: Toward a Digital Reset
Global monetary systems are entering a new era.
The next decade may witness a “global currency reset”, where traditional paper currencies evolve into central bank digital currencies (CBDCs).
This shift could:
Reduce transaction costs
Increase surveillance and control
Challenge the dominance of the US dollar
Create new “exchange rate ecosystems” driven by technology rather than trade alone
In short, the secrets of tomorrow’s exchange rates may lie not in central banks alone, but in blockchain codes and algorithmic governance.
Conclusion: The Art and Science of Exchange Rates
Exchange rates are far more than numbers flashing on a trading screen.
They are reflections of economic strength, political will, psychological trust, and technological evolution.
The secret to understanding them lies in reading between the lines — connecting data with direction, policies with perception, and numbers with narratives.
As global markets evolve, those who grasp these hidden forces won’t just convert currencies — they’ll convert opportunities into fortune.
Because in the end, exchange rates aren’t just about money — they’re about power. 🌍💰
COIN Wave III underway into all time high!Elliot Wave (III) is still underway after wave (II) completed at the weekly 200EMA. Coinbase had a huge bullish engulfing candle this week, closing price above the High Volume Node and R1 weekly pivot - a strong bullish signal!
Price first tested the High Volume Node support and 0.382 Fibonacci retracement, $270. Characteristic of wave 3 shallow pullbacks.
Weekly RSI has reset to the channel EQ and crossing bullishly giving price room to extend upwards!
Safe trading

COIN wave 5 Underway!NASDAQ:COIN wave 4 appears complete at the expected Fibonacci retracement 38.2 and High Volume Node support.
A local channel has formed which could be a bear pennant so bulls should watch out. A breakout of this would hit resistance at $360 High Volume Node and the first take profit area from my recent trade. Clearing this Nose will confirm wave 5 is underway to new all time highs $500+
RSI is flipping bullish from oversold and the dail 200EMA continues to rise.
Safe trading
