Copper reach new highAs we enter 2026, the copper market is undergoing a structural transformation driven by a collision of geopolitical trade shifts and the accelerating green energy transition. The historic price peaks seen in late 2025 were a direct result of "inventory migration," where massive amounts of physical metal moved into the U.S. to preempt 2027 tariffs. This has left global LME stocks dangerously depleted while demand from renewable energy and EV sectors continues to grow at a projected 7–10% annually.
Beyond traditional green tech, the rapid expansion of AI-driven data centers has emerged as a critical new pillar of consumption. These high-intensity sectors are placing unprecedented pressure on a supply chain already burdened by a decade-long exploration drought and declining ore grades in major producing regions, such as Chile. With a projected deficit of nearly 600,000 tonnes for 2026, the market is facing a chronic shortage that cannot be quickly resolved.
The primary challenge for the coming years is the significant lead time required for new production. It takes nearly 15 years to bring a new mine online, meaning the current supply gap is essentially locked in for the foreseeable future. Consequently, we anticipate a sustained era of elevated pricing, where the strategic focus for industrial consumers will shift from managing price volatility to securing physical supply in an increasingly scarce global market.
Technical view:
XCUUSD briefly tested the previous record high and pulled back, trending upward with the expanding EMAs and strong momentum. Prices are traded between EMAs, indicating that they may consolidate in the short term.
If XCUUSD breaches the last swing high, the price can reach the Fibonacci 227.2% at 6.4370.
By Van Ha Trinh - Financial Market Strategist at Exness
Exness

Silver fail to break the record highSilver prices recently surged as escalating geopolitical risks between the US and Venezuela prompted a flight to safe-haven assets. Concurrently, a persistent supply deficit remains a primary concern while industrial demand from the solar PV, EV, and physical investment sectors has accelerated amid structural supply constraints. Expectations that the Fed may implement additional rate cuts in 2026 provide further upside momentum for silver prices.
We now see that XAGUSD has a high correlation with XAUUSD within a 6-month period, at 0.98, but with higher volatility, indicating a higher risk and return. Besides, the incoming NFP tomorrow could heighten volatility due to the surprise of new employment hires, which are expected to increase by 65k in Dec 2025.
Technically, the XAGUSD broke below the EMA21 and traded between both EMAs, signaling consolidation, but remained in the uptrend.
If the price breaks above the EMA21 at 77.5, it could encounter resistance around the last swing high at 81.5. This scenario could be triggered by the weak NFP or an increase in the unemployment rate.
Inversely, price could break below the 75.00 to find support at the 70.57 level.
By Van Ha Trinh - Financial Market Strategist at Exness

DXY rebounded slightly due to the expectation more hawkish FedThe US dollar rebounded after the recent weakness due to increased odds of a rate hike at tomorrow's meeting.
Meanwhile, today's US October JOLTS data may offer further clarity on the labor market following the delayed October NFP. Markets are anticipating the JOTLS to fall to 7.2 million, which could contract the job openings per unemployment rate under the 1.0 level and add further concern about the labor market, despite a low unemployment rate.
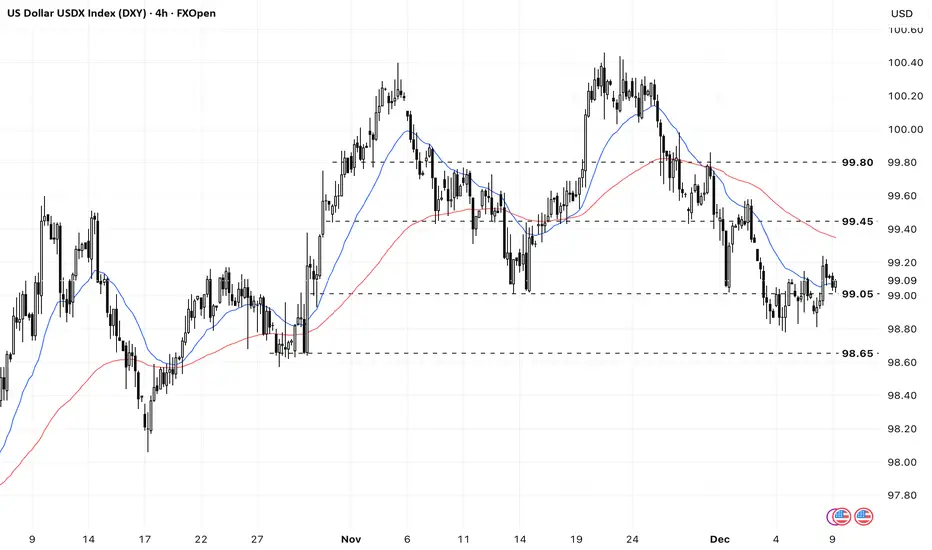
DXY breached 99.00 and EMA21. The index remains between the bearish EMAs, indicating potential consolidation.
If DXY breaks below 99.00 again, the index could retreat toward the next support at 98.65.
Conversely, if the DXY moves above the EMA78, the index may advance toward the next resistance level at 99.45.
Silver prices surge due to the supply tightnessSilver briefly hit another record high at 78, then stabilized at above 57 due to the concern over the lack of supply in LME and SHFE. Meanwhile, demand from not only Solar PV but also EV and data center continues to surge, putting more pressure on the storage.
Meanwhile, China’s silver exports hit a record 660 tons in Oct, underscoring strong demand amid tightening global supply.
However, the gold/silver ratio fell to 74, near the average 25-year of 69, which could limit the rally.
XAGUSD rebounded from EMA21 and formed higher swings within the ascending channel. Diverging bullish EMAs reinforce its uptrend.
A break above the channel’s upper bound near 60.00 could prompt a rally toward the potential resistance at 63.00.
By Van Ha Trinh - Financial Market Strategis at Exness

Gold price rose, awaiting the majors data resumeThere were signs of a resuming US government, which could resume the major data release, especially in the labor market. The labor market has weakened recently, and private data indicate a contraction in companies being watched, driving investors to seek safe havens like gold. Besides, the central bank continued to accumulate gold, with a 28% annual growth in Q3, projected to reach above 1000 tons per year in the latest four years, supporting gold prices.
The XAUUSD briefly tested the 4150 level, with the Golden Cross EMAs signaling stronger bullish momentum. However, the price could hover around 4150 before breaching to test the next resistance at the 4200 level.
By Van Ha Trinh - Financial Market Strategist at Exness

Gold trade in a narrow range with lack of majors dataGold is consolidating within a range of 3900-4500 due to geopolitical easing, but the US government's prolonged shutdown has now reached its longest duration, which could cost the US economy $15 billion per week and cloud the economic data, such as the labor market, which is currently weakening.
Meanwhile, the ADP Employment Change shows the private sector gained 50k jobs in October, easing concerns over the labor market. However, the ADP number usually diverges from the official NFP data, and it might not provide a clearer picture of the US labor market.
Gold prices could become more volatile when US government operations resume, providing clearer data.
Elsewhere, central banks are expected to build up their gold reserves in 3Q 2025 with an annual growth rate of 28%, providing support for the gold price.
Technically, after a long rally since Aug, the XAUUSD tends to retreat and trade in a narrow range to absorb the profit-taking pressure. XAUUSD breaches the EMA21, and trading between both flattening EMAs signals further consolidation.
By Van Ha Trinh - Financial Market Strategist at Exness

Gold facing pressure ahead of US - China meetingChina's purchase of its first US soybean cargo this year, ahead of a meeting with the US, signals expectations for a constructive dialogue and a positive outcome on the sidelines of the APEC summit.
Optimism over a potential trade breakthrough may continue to pressure gold prices.
However, the ongoing data blackout leaves the Fed cautious, heightening volatility in the near term.
XAUUSD failed to breach the EMA, but the higher swing low signaled diminishing bearish momentum. If XAUUSD holds above 3900, the price may retest the resistance at 4020.
Conversely, if XAUUSD closes above 4020, the price may retest the next resistance at 4150 and reverse the trend.
By Van Ha Trinh - Financial Market Strategist at Exness.


Gold facing pressure but still open for further surgeFollowing a recent rally, the gold price met significant profit-taking pressure. Prices reached a record high of 4381, signaling an easing of US-China trade tensions.
China confirmed trade talks with the US will occur tomorrow in Malaysia alongside the ASEAN summit. However, both sides are escalating tensions pre-talks to gain bargaining power, potentially complicating a final agreement.
Meanwhile, the prolonged US government shutdown, combined with a weakened Labor Market and a lack of data, has obscured the Labor Market's current situation. This uncertainty fueled market concern and drove investors toward safe-haven assets.
Concurrently, expectations place the US CPI at 3.1% YoY, accelerating from 2.9%. This increase raises stagflation concerns in the US economy, further supporting the gold price.
Technically, XAUUSD hovers slightly above the EMA78. Both EMAs are consolidating, signaling continued flattening momentum.
However, the long-term trend remains to the upside, suggesting investors may buy the dips amid the remaining uncertainty.

Exness: The Convergence of Tech GiantsThe initial phase of the artificial intelligence (AI) rebound was driven by narrative and momentum; merely being associated with AI was enough to push up valuations. Now, we are entering a more mature phase where investors will demand tangible results and will penalize specific strategic missteps or unmitigated risks.
Although the AI theme remains dominant, news from specific companies is now triggering significant and differentiated reactions. For example, Apple is adjusting its entire AR/VR strategy due to product-specific difficulties, while Meta is grappling with an existential regulatory battle unrelated to its AI development. This differentiation means the market is beginning to distinguish between "AI beneficiaries" and "AI players who need to prove themselves."
Simply being among the "Magnificent Seven" is no longer enough; companies must now demonstrate their ability to navigate their unique challenges—be they competitive, regulatory, or operational.
Therefore, the next phase of the Nasdaq 100's performance will depend on how these individual giants execute their specific strategies, making company-level analysis more critical than ever.
NVIDIA's AI Empire: Solidifying the Moat or Building a House of Cards?
Nvidia recently announced a strategic cooperation intent, planning to invest up to $100 billion in OpenAI. This investment is closely linked to the deployment of at least 10 gigawatts of Nvidia systems, aimed at supporting OpenAI's next-generation AI infrastructure, with the first phase using its Vera Rubin platform by 2026. This is not just an investment; it's a self-reinforcing business cycle. Nvidia provides funding to OpenAI, and OpenAI then uses these funds to purchase Nvidia's core products (GPUs, networking systems), thereby effectively securing a large and long-term order channel, injecting strong momentum into both parties' revenue growth.
However, this arrangement has also drawn critical perspectives, arguing that it constitutes "The Infinite Money Glitch." Analysts have compared it to Cisco Systems' practices during the dot-com bubble, when Cisco provided funding to telecom companies to purchase its routers, a strategy that amplified the subsequent market collapse.
The risk is that Nvidia may be artificially inflating its own demand, which would make it very vulnerable if the AI capital expenditure boom slows down or OpenAI's business model encounters problems.
This investment can also be seen as a defensive move, aimed at preventing OpenAI from developing its own custom chips or deepening its cooperation with competitors like Broadcom, with whom OpenAI has already signed a $10 billion order.
Apple's Pragmatic Shift: From Vision to Sight
Recent reports confirm that Apple is pausing its planned overhaul of the Vision Pro headset to reallocate resources and accelerate the development of AI-powered smart glasses. The logic behind this strategic shift is that the Vision Pro, launched in February 2024, has struggled to maintain sales momentum due to its high price of $3,499, physical weight, and limited content ecosystem, leading to waning consumer interest.
This shift is a pragmatic admission by Apple that the path to the mass market lies in a different product form factor. According to the new roadmap, Apple is reportedly developing at least two models: a simpler display-less version (N50) that connects to the iPhone, and a more advanced version with an integrated display that directly competes with Meta's products. The development timeline is being accelerated, with a possible release as early as next year.
This strategic shift is less about abandoning spatial computing and more about finding a viable mass-market vehicle to counter its "AI laggard" label and establish a new, Apple-controlled AI platform.
Despite the launch of "Apple Intelligence," Apple is still widely considered to be playing catch-up in the generative AI field compared to Google and OpenAI.
Meta's Ambitious: Software to hardware while defending the core.
In this race, Meta is clearly in the lead. It has collaborated with Ray-Ban to launch multiple generations of smart glasses, and has introduced the $800 Ray-Ban Display, its first consumer model with a built-in screen. They are setting the pace, forcing Apple to react. However, at the same time, Meta's core advertising business is facing unprecedented and escalating legal attacks in the EU. This includes a €550 million lawsuit filed by over 80 Spanish media organizations, accusing it of unfair competition; similar lawsuits exist in France; and its "consent or pay" model faces fundamental challenges under GDPR and the Digital Services Act (DSA).
Meta's aggressive push in smart glasses and the metaverse is not just a pursuit of new growth, but a strategic necessity driven by the existential threat to its underlying advertising business model. Meta's primary revenue and profit engine – personalized advertising based on user data – is facing fundamental, systemic challenges in one of its largest markets (the EU). This regulatory pressure creates a powerful incentive for it to develop new platforms (such as smart glasses operating systems) where Meta can control the ecosystem, set data collection rules, and build new, diversified revenue streams (e.g., hardware sales, AR app stores).
Therefore, succeeding in this new hardware race is not only an offensive growth strategy, but also a crucial defensive move to reduce the company's reliance on a business model that is increasingly untenable from a regulatory perspective.
Microsoft's Quiet Restructuring for the Future of its AI Center
Microsoft has undergone a major internal reorganization to strengthen its focus on AI. This includes the appointment of Judson Althoff as CEO of the commercial business, a move explicitly aimed at allowing CEO Satya Nadella to focus on high-level technical work in AI, data center architecture, and product innovation. Meanwhile, the company has for the first time since 2018 unified its Windows engineering division under one leader, Pavan Davuluri. The clear goal is to accelerate the realization of Windows as an "Agentic OS" – an AI-driven operating system that can proactively perform tasks for users.
Microsoft's strategy is fundamentally different from Apple's and Meta's. Instead of chasing new consumer hardware categories, Microsoft is doubling down on its existing enterprise and operating system strongholds, deeply integrating AI into the fabric of its core products to increase user engagement and drive consumption within its ecosystem. Recent news from Microsoft is not about novel gadgets, but about organizational structure and a long-term operating system vision. The changes in commercial leadership are to optimize the sales process for AI-enhanced enterprise services (such as Azure AI and Microsoft 365 Copilot). The changes in Windows are to redefine the core PC experience in the age of AI.
This is a lower-risk, more defensive strategy. They are not trying to create a new market from scratch, but rather are using AI to fortify their existing multi-trillion-dollar enterprise and consumer software moats. The measure of Microsoft's success will not be hardware sales units, but rather Azure consumption growth, Copilot subscription numbers, and increased enterprise license value.
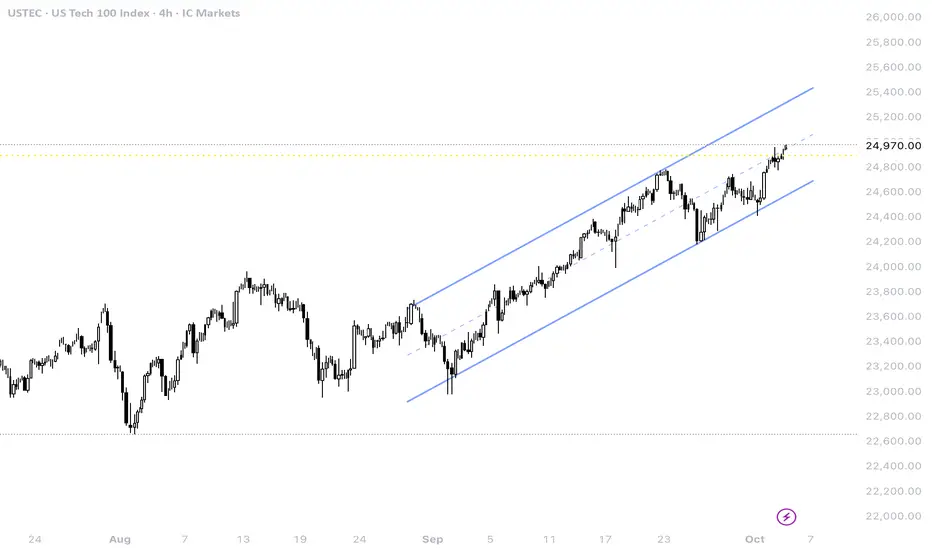
USTEC reached the 100% Fibonacci Extension at around 24955 before retracing. The index awaits a potential breakout from the range of 24800-24955.
If USTEC breaks above 24955, the index may test the 161% Fibonacci Extension at around 25265.
Conversely, returning below 24700-24800 may lead to a retest of EMA21 and the channel’s lower bound.
Combining the above analysis, the performance of the Nasdaq 100 index will be the ultimate resultant force of these competing powers. This ecosystem is interconnected: Nvidia's ability to execute its large-scale infrastructure construction is the foundation for the AI ambitions of companies like Microsoft and Meta. The success of Apple's and Meta's hardware battle will define the next major consumer computing platform and create new ecosystems. Microsoft's solid position in the enterprise sector provides a stabilizing force, while Meta's regulatory battles in Europe remain the most significant idiosyncratic risk facing a major component of the index.
This is not a prediction, but a guide to what matters most in the coming quarters:
For Nvidia: Track gross margins for its Blackwell and upcoming Vera Rubin platforms and any comments on pricing power. Watch for any official regulatory investigations initiated by the US or EU regarding its partnership with OpenAI and its ecosystem impact.
For Apple and Meta: Sales data in the first 6-12 months after the launch of any new smart glasses, and more importantly, user engagement metrics will be crucial. The quality and capability of Apple's revamped Siri (Project Linwood) upon full release will be a key leading indicator of its AI competitiveness.
For Meta (EU): Rulings in media lawsuits in Spain and France will be key (the trial in Spain is scheduled for October 2025). Any decision invalidating the "consent or pay" model would force a fundamental restructuring of its European operations and could have significant financial implications.
For the Macro Environment: Monthly non-farm payroll reports are key data points. A sustained trend below expectation would significantly increase the probability of a recession and could outweigh the positive sentiment from potential interest rate cuts, shifting market focus from valuation support to fundamental earnings risk.
By Eric Chia, Financial Market Strategist at Exness
Exness: Japanese Yen Hawkish Shift Intertwined with Fed Rate CutExness: Japanese Yen Hawkish Shift Intertwined with Fed Rate Cut Expectations: What Lies Ahead?
The signals from the Bank of Japan's policy meeting on September 18-19 mark a potential turning point. Although the decision was made to keep the policy interest rate at 0.5% with a 7-2 vote, the internal details revealed growing hawkish pressure. Policy board members Hajime Takata and Naoki Tamura voted against maintaining the interest rate, advocating for an immediate 25 basis point hike to 0.75%. This is the first dissenting vote since Governor Kazuo Ueda took office, clearly indicating a growing call for tighter policy within the central bank.
Even more surprisingly, the Bank of Japan simultaneously announced that it would begin preparations to sell its holdings of exchange-traded funds (ETFs) and Japanese Real Estate Investment Trusts (J-REITs). Although the planned pace of sales is relatively modest, this is seen as a substantive step towards policy normalization, with its signaling significance far outweighing its actual market impact.
The "Summary of Opinions" from the September meeting, just released today (September 30), provides decisive evidence of this hawkish shift. The document shows that there was a serious and in-depth debate within the policy board on the "possibility of a near-term rate hike." Several members believed that the conditions for another rate hike were maturing, with one opinion explicitly stating, "Given that it has been more than six months since the last rate hike, perhaps it is time to consider raising the policy interest rate again." Even Asahi Noguchi, a deliberation committee member usually considered dovish, stated in a speech on September 29 that the necessity of adjusting the policy interest rate is "greater than ever."
This series of signals quickly reshaped market expectations. Currently, market pricing reflects that the probability of the Bank of Japan raising rates by 25 basis points at its next meeting on October 29-30 has surged to about 60%.
In stark contrast to the Bank of Japan's increasingly firm stance, the Federal Reserve is on a clear path of easing, primarily driven by concerns about a cooling US labor market. Key inflation data released last week on September 26 further solidified this expectation.
Data shows that the Federal Reserve's most favored inflation indicator, the core Personal Consumption Expenditures (PCE) (Chart 1) price index for August, increased by 2.9% year-on-year, remaining consistent with July and fully meeting market expectations. This "as expected" report is widely interpreted by the market as "non-threatening" inflation, suggesting it will not hinder the Federal Reserve's interest rate cuts and instead bolsters investor confidence in future rate reductions.
The Tug-of-War Between Inflation and Growth
The fierce debate within the Bank of Japan between hawks and doves stems from the contradictory signals sent by Japan's domestic economic data. On the one hand, persistently above-target inflation provides a reason for raising interest rates; on the other hand, recent signs of slowing growth call for the central bank to remain cautious. This tug-of-war between inflation and growth makes the Bank of Japan's decision-making path full of uncertainty.
Inflation Outlook: The Hawks' Confidence
Hawkish officials who support interest rate hikes primarily base their arguments on persistent inflationary pressures in Japan. The national core Consumer Price Index (CPI) (Chart 2) for August, released on September 18th, rose by 2.7% year-on-year. Although this is a slowdown from July's 3.1%, it marks the 29th consecutive month that this data has been above the Bank of Japan's 2% target.
What is even more noteworthy is that the "Core-Core CPI", which excludes fresh food and energy and is regarded by the Bank of Japan as a measure of underlying inflation trends, remained stubbornly high at 3.3% in August. This persistent underlying price pressure is the core argument for hawkish members who believe the inflation target has been "largely achieved." In addition, the Tokyo core CPI for September (released on September 25), which is a leading indicator for national inflation, remained stable at 2.5% year-on-year, further indicating that inflationary pressures are not rapidly dissipating.
Growth Outlook: Dovish Concerns
However, just when the hawkish arguments seemed fully substantiated, the latest series of economic activity data released this week cast a shadow over the outlook, providing strong support for a dovish, cautious stance.
Data released on September 29th and 30th showed that preliminary industrial output for August decreased by 1.2% month-on-month (Chart 3), significantly worse than the market expectation of -0.8% and also weaker than the previous figure of -0.4%. This indicates that production activities are contracting in manufacturing, a crucial pillar of the Japanese economy, possibly due to the negative impact of US tariff policies and a slowdown in global demand.
At the same time, retail sales data for August, a key indicator of domestic demand, was also disappointing.
This data unexpectedly fell by 1.1% year-on-year, a significant departure from market expectations of a 1.0% increase; it even saw a substantial 1.6% month-on-month decrease. This clearly indicates that Japanese household consumption power is being eroded, and domestic demand is beginning to show weakness, against a backdrop of inflation consistently higher than wage growth.
In addition, the preliminary Manufacturing Purchasing Managers' Index (PMI) (Chart 4) for September fell to 48.4, marking the fastest contraction in six months and further confirming the downward pressure on the economy.
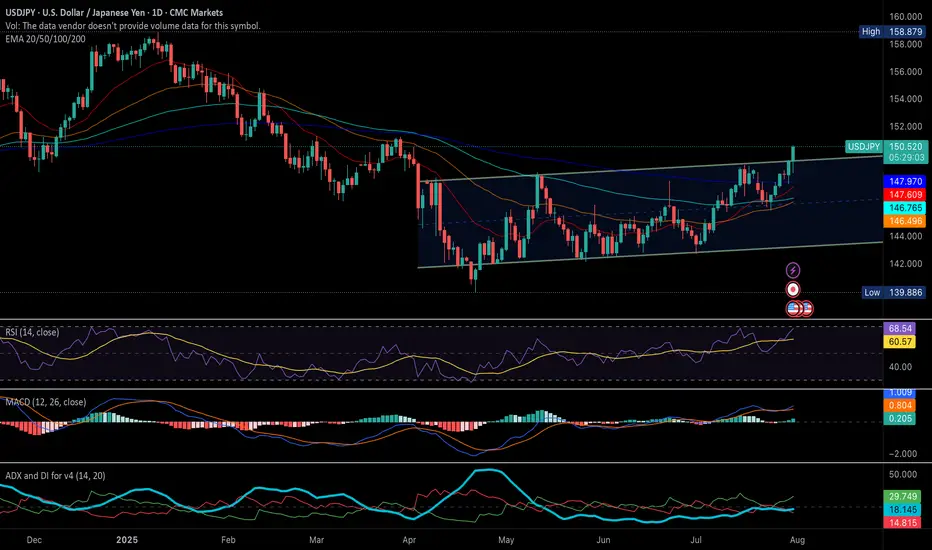
From a technical perspective, USD/JPY is at a critical crossroads. Recent price movements show a fierce struggle between bulls and bears around important technical levels, reflecting fundamental uncertainties. USD/JPY failed to reach the key 150.00 level, then fell back below 149.00 and the EMA21. The price is still fluctuating within the 148.00-149.00 range, indicating possible consolidation. If it stays below 149.00, the price may consolidate further within the 148.00-149.00 range. Conversely, if it returns above the EMA21 and 149.00, it may retest the key 150.00 level.
Integrating the above fundamental and technical analysis, a core conclusion can be drawn: the previous one-sided short-yen trading environment has ended. The market is entering a new phase that is more balanced but potentially significantly more volatile.
The movement of USD/JPY is no longer dominated by a single factor, but depends on the interplay between the hawkish potential of the Bank of Japan and the dovish reality of the Federal Reserve. The short-term direction of the exchange rate will be determined by which central bank's actions (or inactions) surprise the market more.
The future path will be largely determined by two key economic data releases scheduled for this week:
Japan Tankan Survey (October 1): Can this report give the Bank of Japan's hawks enough confidence to act in October?
US Non-Farm Payrolls (October 3): Will this data confirm the weakening of the US labor market, thereby "paving the way" for the Federal Reserve's rate cut path?
The outcome of these two events will likely determine whether USD/JPY breaks key support and tests lower levels, or whether it can hold its ground here and gather strength to challenge the strong resistance area of 150 again.
In any case, what is certain is that the era of one-sided yen depreciation is over, and a new phase full of strategic reassessment and uncertainty has arrived.
By: Eric Chia, Financial Market Strategist at Exness

Gold spike when the US government shutdown is loomingGold prices advanced firmly above the 3800 level, driven by escalating concerns surrounding the US government funding negotiations. A prolonged government shutdown could delay the release of key economic indicators, such as NFP and CPI, and potentially lead to a spike in unemployment from federal job losses. Conversely, the passage of a new funding agreement, ensuring continued US government operations, would likely exert significant downward pressure on gold prices. Consequently, the market anticipates heightened volatility pending the outcome of these fiscal discussions.
From a technical standpoint, XAUUSD is trading above the former resistance level of 3800, which now acts as key support. An expanding divergence between the 21 and 78-period EMAs signals robust bullish momentum. Nevertheless, with the Relative Strength Index (RSI) exceeding 70, short-term overbought conditions may introduce headwinds for XAUUSD.
By Van Ha Trinh, Financial Market Strategis at Exness

Gold faces pressure with data-dependent stanceGold prices increased after the Fed cut the rate by 0.25%, bringing the Fed fund rate to 4.0 - 4.25%. The dot plot showed two more cuts in 2025 by 0.5% and only a 0.25% cut in 2026 and 2027 each.
The Fed also indicated the inflation risk and forecast inflation to be up to 3.1% by the end of this year. It stressed that the labor market is weakening now amid an elevated unemployment rate that has remained low.
However, the gold price fell after Fed Chair Powell's speech, which emphasized a data-dependent stance and raised expectations of more aggressive action from the Fed.
Markets need to observe the next labor data to evaluate how bad the labor market is, which could affect concerns over the US economy's stagflation, which could support the gold price in the medium term.
Technically, the XAUUSD broke down under the EMA21 but remains above the EMA78, indicating that the bullish momentum is weakening. If the XAUUSD closes under 3660, it may prompt a retest of the next support at 3600.
By Van Ha Trinh, Financial Market Strategist at Exness

Gold hit another record highGold hit another record high due to concerns over the Fed's independence and the recent weak US labor market. Yesterday evening, the US Senate officially confirmed Stephen Miran as President Trump's new nominee to the Federal Reserve Board in an incredibly tight 48-47 vote, raising concern that he will follow the US President and draw down the Fed's independence.
Meanwhile, the US labor market has recently raised concerns about the stagflation situation, which is the best environment for gold as a safe-haven asset. Although the Sahm Rule is not triggering, weak immigration could understate the unemployment number and the break event number.
Elsewhere, the expectation of an accelerated Fed rate cut could dampen the US dollar, reducing the opportunity cost of holding gold.
Technically, XAUUSD surpassed the Fibonacci Extension of 2.168 and tends to test the 3.800 level. Expanding EMAs (21,78) indicate strong bullish momentum.

Weak US labor market drive gold higherGold Price and the US CPI
This week's US CPI data could drive gold prices higher through two distinct scenarios. A higher-than-expected CPI print may fuel concerns of stagflation in the US economy, an ideal environment for gold. Conversely, a lower-than-expected CPI could prompt the Fed to pursue further interest rate cuts, which would reduce the opportunity cost of holding a non-yielding asset like gold, but the support could be weaker than in the stagflation scenario.
The current labor market remains a key headwind, with recent Non-Farm Payrolls data showing a meager gain of only 22k new jobs in Aug, while the Jun figure was revised downward. Additionally, the Job Openings and Labor Turnover Survey (JOLTS) report now indicates that the number of job openings has fallen below the number of unemployed individuals, suggesting a potential surplus of labor. This could quickly impact consumer spending, which is a primary driver of the US economy.
Technical Outlook for Gold
From a technical standpoint, Gold (XAUUSD) has reached another record high. The expansion of the 21 and 78 EMAs signals a continuation of the bullish momentum.
A break above the 261.8% Fibonacci Extension at 3680 could see the price approach the resistance at 3820.
Conversely, a retracement could lead to a retest of the EMA21 and the support level at 3580.
By Van Ha Trinh - Financial Market Analyst at Exness

Swiss GDP weakened as expected The GDP data released today shows that Switzerland's GDP grew by 0.1% QoQ in 2Q2025, following a stronger expansion of 0.8% in 1Q2025. This result confirms weak growth for the Swiss economy in the latest quarter, as gains in the services sector were offset by a downturn in industrial activity and export pressures, especially related to recent US tariffs. Weak GDP growth and deflation increase the likelihood of continued dovish SNB policy. Any signs of further slowdown or persistent deflation could trigger additional easing, possibly even negative rates again.
Meanwhile, the USD fell due to uncertainty about the Fed's independence, which drove the CHFUSD higher when Trump called to fire Fed Governor Cook.
Technically, the pair is trading near 1.2474, with price action consolidating just above several moving averages (EMA 20/50/100/200), indicating a possible emerging bullish bias if the pair maintains above these levels
Price recently broke above previous resistance at 1.2450–1.2460, pointing toward a short-term bullish trend continuation, with next resistance seen at 1.2500 and support at 1.2400.
By Van Ha Trinh - Financial Market Strategist at Exness

Expectation of Fed rate cut and BoJ rate hike dampen the USDJPYDue to the recent softer US CPI print and weakening labor market data since the start of the month, market expectations for a Fed rate cut have increased. According to the CME FedWatch Tool, markets are pricing in three rate cuts for this year, with the earliest likely to occur in September.
Meanwhile, in Japan, inflation has also eased, while concerns about US demand have diminished. Japan's 2Q GDP is expected to rebound to 0.4%, avoiding a technical recession. As a result, markets anticipate the BoJ may hike rates further, which would lend additional support to the yen against the US dollar.
Technically, USDJPY has formed a downtrend, characterized by lower swing low and a bearish extension of its EMAs. If USDJPY falls below the 146 support level, the currency pair could test the next support at 145. Conversely, if USD/JPY recovers above both the 21 and 78 EMAs, the price may surge toward the resistance at 149.00.
By Van Ha Trinh - Financial Market Analyst at Exness.

Will the US Inflation Data Drive a Breakout for USDCAD?Macro approach:
- USDCAD edged higher this week amid softer Canadian labor data, boosting BoC cut odds and pre‑CPI caution that kept the USD supported as traders eyed key US inflation prints.
- Canada shed 40.8k jobs in Jul while unemployment held at 6.9%, reinforcing expectations for a 17 Sep BoC cut and pressuring the loonie.
With Canada's calendar light, focus shifted to the US, where Jul CPI/PPI and Retail Sales are set to steer Fed cut probabilities that sit near 85–90% for Sep, anchoring USD tone into the data.
- In short, US inflation and activity data could drive USDCAD direction, while oil's resilience may cushion CAD. A softer US CPI/PPI may weigh on USD and support CAD, but it is limited (Oil trend and Sep rate cut), whereas sticky prints could extend USD firmness into the week.
Technical approach:
- USDCAD formed a Triple-Bottom pattern and broke the descending channel to make a swing high at around 1.3878. The price retraced and retested the support at around 1.3755 and bounced to close around EMA78. The price is captured within a tight trading range of 1.3755-1.3850, awaiting an apparent breakout to determine the trend.
- If USDCAD closes above both EMAs and the resistance at 1.3850, the price may retest May's resistance area at around 1.4000.
- On the contrary, closing below the support at 1.3755 and the ascending channel may prompt a correction to retest the key support at 1.3567.
PS: I also provide a quick view on DXY regarding US CPI data today via Wall Street Journal: www.wsj.com
Analysis by: Dat Tong, Senior Financial Markets Strategist at Exness

XAU move sideways, awaiting US CPI todayGold prices declined amid the extended US-China tariff truce, yet they remain highly volatile ahead of today's US CPI data.
The market anticipates the July US CPI to rise to 2.8% from May's 2.7%, with Core CPI also expected to increase to 3.0% from 2.9%. Higher inflation could reduce the odds of a Fed rate cut, strengthening the dollar and pressuring gold. Conversely, a larger-than-expected inflation increase could fuel stagflation concerns, potentially supporting gold prices.
Another factor that could support gold is the meeting between US President Trump and Russian President Putin this week in Alaska. A lack of a final agreement to end the war in Ukraine could prompt the US to increase sanctions on Russian goods, which could further exacerbate gold prices.
Technically, XAUUSD is trading in a tight range, holding above the 3345 support level and below its EMAs (21, 78), suggesting a continuation of sideways movement. A breach below 3345 could see the price retest next support at 3285, while a sustained hold above this level could prompt a correction towards the 3402 resistance.
By Van Ha Trinh - Financial Market Strategis at Exness

Pound break despite the MPC meeting is comingWhile a BoE rate cut of 0.25% is widely anticipated today, the market's focus will be on the post-meeting guidance, which could clarify the future path of monetary policy. The decision is influenced by a weakening labor market and a significant government deficit of 51 bln USD. A dovish stance could lead to a faster pace of cuts, dampening the pound.
From a technical perspective, the GBPUSD pair has broken above the EMA78, signaling further potential gains. However, it is currently facing resistance at 1.33800. A break above this level could see the pair test the next resistance at 1.3440. Conversely, a failure to hold this level could lead to a fall toward the support at 1.3150.
By Van Ha Trinh - Financial Market Strategis at Exness

BoJ keep interest rate unchanged, yen weakeningFollowing the July meeting, the BoJ maintained its interest rate at 0.5%, citing prevailing uncertainties from trade tariffs. Concurrently, the BoJ revised its inflation forecast upward to 2.7% YoY from 2.2%. The central bank's language on economic uncertainty has become less pessimistic, downgrading trade policy risks from "extremely high" to "high uncertainties remain," which signals a growing, albeit cautious, confidence in the economic outlook.
In the US, the June PCE surged to 2.6% YoY, surpassing the 2.5% prev. cons. The increase was attributed to tariff impacts, with Goods prices rising 0.4% MoM, the fastest pace since January, while Services prices held steady at 0.2% MoM.
The higher-than-expected US PCE data and the BoJ's decision to hold interest rates have continued to drive further appreciation of the USDJPY.
USD/JPY Technical Analysis
The USD/JPY pair is trading above its EMAs extensions, signaling a continuation of the bullish momentum. The price has successfully breached the ascending resistance trendline. However, the RSI is in overbought territory, suggesting that the current rally may be extended, and a potential pullback could be imminent.
The pair could continue to test the resistance level at 151.367. Should it fail to break this level, a rebound could see the USD/JPY pair test the support at 149.65.
By Van Ha Trinh - Financial Market Strategist at Exness
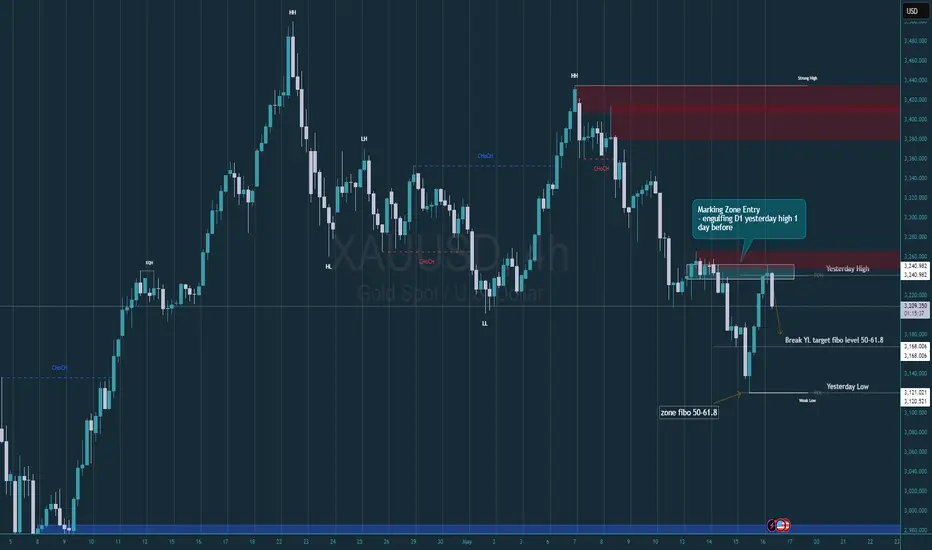
Gold in Strong Resistant D1🧠 Chart Summary:
Pair: XAUUSD (Gold Spot)
Time Frame: H4
Market is clearly in a downtrend – you can spot those Lower Highs (LH) and Lower Lows (LL).
Price hit a supply zone (marked in red) and instantly got rejected – clean bounce.
It also touched the “Yesterday High” and then dropped – nice sign of strong resistance.
Now price is heading down toward Fibonacci retracement levels (50% and 61.8%) and “Yesterday Low.”
🔻 SELL Trade Breakdown
Factor Notes
Trend Bearish – structure shows LH and LL
Entry Zone Price rejected hard from that supply zone (red area)
Candle Confirmation Bearish engulfing setup around that resistance zone
Stop Loss Just above the red zone / “Yesterday High” (around 3,250–3,260)
TP 1 Around 3,168 (Fibo 50%)
TP 2 Around 3,121 (Fibo 61.8% + Yesterday Low)
Momentum Solid bearish pressure – broke minor support, looks ready to drop
📈 SELL Plan Summary:
Sell Entry: Current level or wait for a retest around 3,240–3,250
Stop Loss: Above 3,260 (above that red zone)
Take Profits:
TP1: 3,168 (50% fibo)
TP2: 3,121 (61.8% fibo + previous day’s low)
BTC/USDT Breakdown: Bearish Momentum Ahead?📉 Bitcoin (BTC/USDT) 4H Chart Analysis
🔻 Trend Breakdown:
BTC is in a descending triangle pattern, with lower highs forming resistance.
The price has broken below the trendline, indicating bearish momentum.
📊 Key Levels:
📍 EMA 200 (Red Line): 100,411.25 USDT – Acts as major resistance.
📍 Current Price: 97,815.98 USDT – Trading below the 200 EMA, confirming bearish sentiment.
📍 Support Zone: 95,000 USDT – A retest could occur before further downside.
📍 Target: 89,351.53 USDT – The chart suggests a potential drop to this level.
⚠️ Bearish Signals:
✅ Price rejected from descending resistance.
✅ Below the 200 EMA – Bearish confirmation.
✅ Breakout from the structure, signaling further downside.
💡 Conclusion:
If BTC stays below the resistance zone, expect further decline toward 89,350 USDT.
If bulls regain control above 100,400 USDT, trend reversal could happen.
🚨 Trade Caution: Monitor volume and price action near the key support! 🧐
