Trend Continuation DOTDOT - Trend Continuation Setup
In my previous post, I outlined the primary scenario in which we had already seen an A- and B-wave, followed by a C-wave completing within the 23.6% to 38.2% Fibonacci retracement zone.
This scenario has now played out as expected.
From the bottom of the (C)-wave, I currently assume that we have already seen an impulsive Wave (1) of a new 5-wave impulse structure.
However, this move only slightly exceeded the level of the previous Wave (3), which is why I do not yet consider the trend fully confirmed.
For proper trend confirmation, I would now like to see a shallow / flat Wave (2) correction. Such a controlled pullback would allow price to build energy and then break the previous high impulsively.
This would also increase the probability of DOT breaking above the Daily 50 EMA, which would further strengthen the bullish case.
As long as this structural scenario remains intact, I consider the higher-timeframe bias to remain on the long side.
Alternative Scenario (Lower Probability)
An alternative - less likely, but still possible - scenario is that the move previously labeled as Wave (3) was in fact already a Wave (5).
If this is the case, the prior impulse would be fully completed.
Under this scenario, we would have to expect a full corrective move of the entire impulse before any sustainable trend continuation can develop.
Key confirmations would be a clear break in structure and a lack of impulsive behavior on the upside.
At the moment, this is not my preferred scenario. However, if price action and structure start to shift in this direction, I will publish a separate post including a full visual breakdown of this alternative count.
F-DOT

1W Polkadot (DOT): Full updates & thoughts on the chain Technical situation (chart)
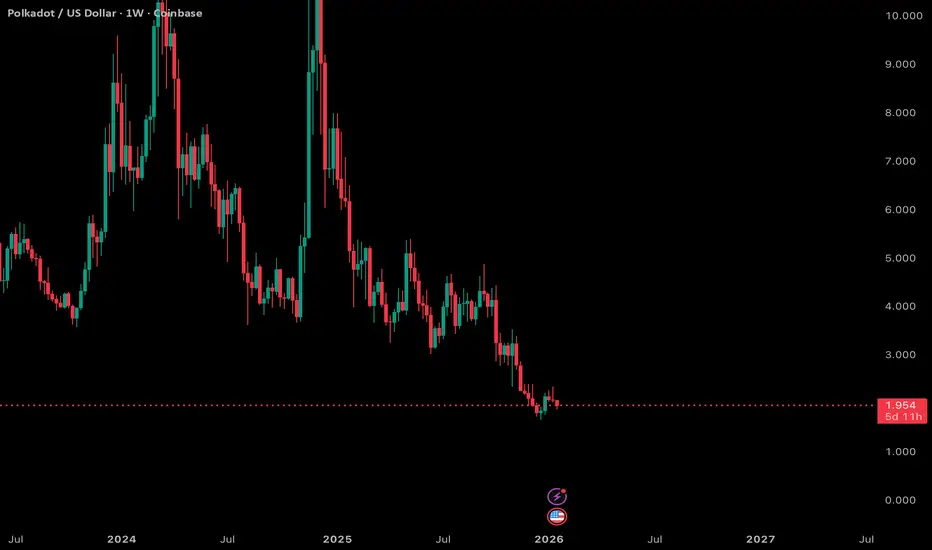
On the weekly, DOT is still struggling to show sustainable strength. Price continues to sit near the low end of the range around ~2.0, failing to make meaningful higher highs or clear range expansion. This looks like more consolidation and distribution pressure rather than a clean breakout, and recent candles confirm a bearish tone with lower peaks and no strong follow-through. Price action is choppy and defensive, reflecting weak conviction from buyers.
Regarding upgrades and fundamentals
Polkadot has a long roadmap of structural upgrades that are intended to boost the network’s utility and developer appeal. The ecosystem is transitioning to Polkadot 2.0 with features like Agile Coretime, Async Backing, and Elastic Scaling fully rolling out, which are designed to improve performance and flexibility for parachains. A hard cap on DOT supply and stepped-down issuance is also being introduced starting in 2026, reducing inflation over time. Smart contract support and increased Ethereum compatibility are targeted, potentially lowering friction for dApp developers and deployment.
CoinMarketCap
+1
Additionally, the Join-Accumulate Machine (JAM) architecture and new identity (“Individuality”) tooling are part of the broader 2026 roadmap, making Polkadot more scalable and feature-rich.
CoinMarketCap
There are also ecosystem developments like bridges (e.g., Hyperbridge enabling multi-chain connectivity) and improvements to developer tooling, which bolster long-term fundamentals.
Wikipedia
So what does that mean right now?
I looked at the chart through the lens of these upcoming upgrades to see whether news flow is already reflected in price. The short answer: not really — at least not yet. Despite strong on-chain activity and a clear roadmap, DOT price has been weak and range-bound. In fact, it’s down significantly over the past year even as the protocol continues to build out features.
Nasdaq
This divergence between fundamentals and price action is typical in environments where upgrades are slow to translate into actual adoption and utility — especially when broader market sentiment is range-bound or bearish for altcoins.
Overall take
From a technical perspective, DOT looks a bit bearish and indecisive right now, trapped at lows with no clear breakout structure. The long-term fundamental backdrop (protocol upgrades, supply cap, smart contract support) is constructive, but price isn’t yet reflecting that optimism. It’s a classic case of tech building ahead of price action, and until the market starts valuing those upgrades — likely via adoption, volume growth, or real activity metrics — the chart remains choppy and tilted bearish near current levels.
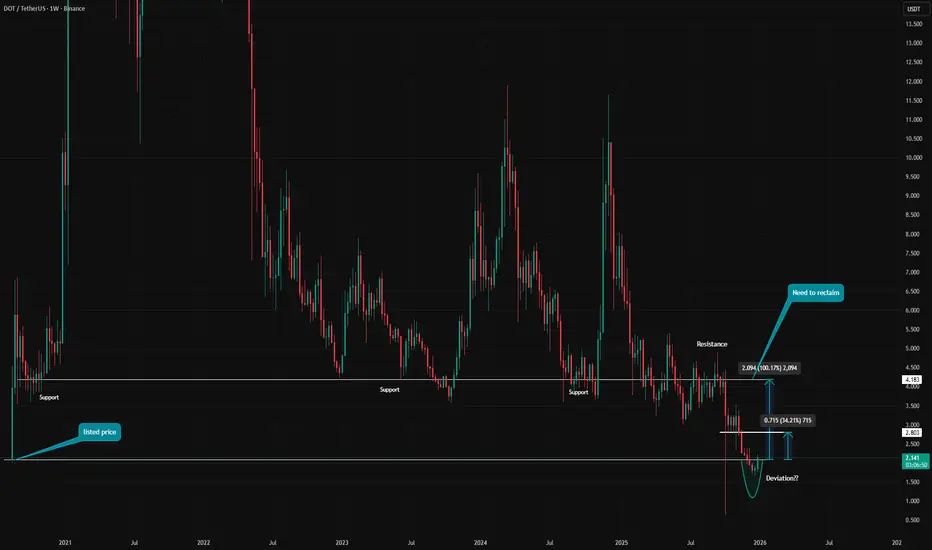
DOT / USDT – Weekly Structure Price is currently reacting around the listed price / origin level
This level has limited historical validation as support and should be treated as a reaction zone, not a confirmed long-term support.
Recent price action shows a strong move below this level followed by a reclaim, suggesting a possible deviation.
However, deviation alone does not confirm a structural shift.
From here, a short-term continuation toward local resistance is possible.
For any meaningful bullish continuation, price needs to reclaim and hold above that resistance.
As long as price remains below resistance, this move should be treated as a reactive bounce within a broader bearish structure, not a confirmed reversal.
This is a key decision area.
Let acceptance and structure confirm the next move.
Do you see this as a deviation reclaim, or just a temporary reaction?
MrC
DOTUSD -> Potential Wyckoff Accumulation DOTUSD -> Potential Wyckoff Accumulation
This looks like a Model 1 Wyckoff Accumulation to me. It is evident on the monthly timeframe, but more clear on the weekly.
If this is the case, currently we would be in the wyckoff spring phase.
What do you think?

DOT: locally long ideaThe dot looks long, both locally and structurally. We need to eliminate the accumulated long-term liquidity, and then we can take off. That's the idea! It's not a setup. If we create this model, we're in. If we fail, we'll just skip it!
BINANCE:DOTUSDT.P

#DOT/USDT Ready to go higher#DOT
The price is moving in a descending channel on the 1-hour timeframe. It has reached the lower boundary and is heading towards breaking above it, with a retest of the upper boundary expected.
We have a downtrend on the RSI indicator, which has reached near the lower boundary, and an upward rebound is expected.
There is a key support zone in green at 1.77. The price has bounced from this zone multiple times and is expected to bounce again.
We have a trend towards stability above the 100-period moving average, as we are moving close to it, which supports the upward movement.
Entry price: 1.80
First target: 1.83
Second target: 1.86
Third target: 1.90
Stop loss: Below the support zone in green.
Don't forget a simple thing: capital management.
For inquiries, please leave a comment.
Thank you.

#DOT/USDT : BUY LOW#DOT
The price is moving in a descending channel on the 1-hour timeframe. It has reached the lower boundary and is heading towards breaking above it, with a retest of the upper boundary expected.
We have a downtrend on the RSI indicator, which has reached near the lower boundary, and an upward rebound is expected.
There is a key support zone in green at 1.72. The price has bounced from this zone multiple times and is expected to bounce again.
We have a trend towards consolidation above the 100-period moving average, as we are moving close to it, which supports the upward movement.
Entry price: 1.76
First target: 1.75
Second target: 1.82
Third target: 1.88
Don't forget a simple principle: money management.
Place your stop-loss below the support zone in green.
For any questions, please leave a comment.
Thank you.

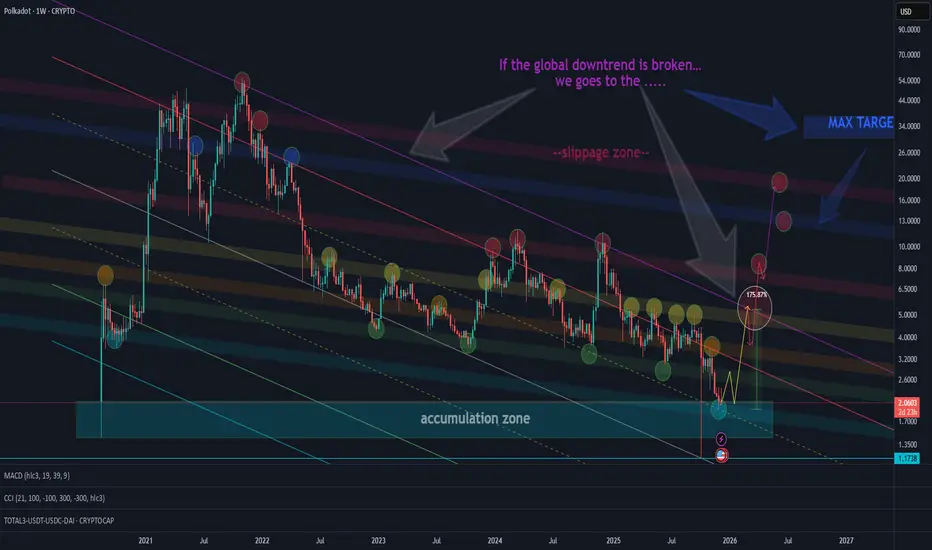
POLKADOT DOT DOTUSD 1W TFThe chart shows support and resistance levels as well as the targets up to the global descending channel.
If the global downtrend is broken - the maximum target is the blue zone.
The red zone represents a short-squeeze area originating from the blue zone — which may or may not occur and the squeeze could also happen earlier.
At the moment we are in the accumulation zone of the asset.
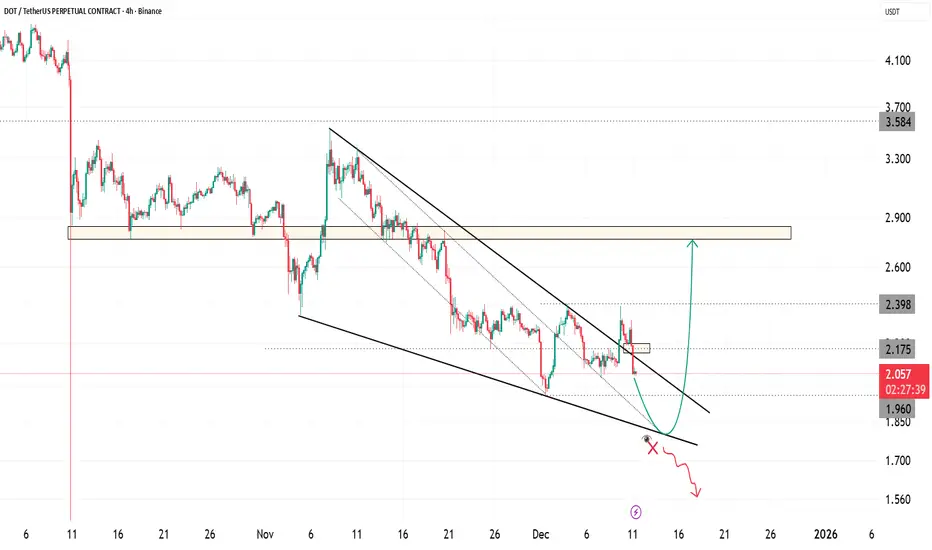
DOT Preparing for a Potential Relief Wave from Demand ZoneDOT continues to trade inside a well-defined falling wedge that has been guiding the market since early November. Price recently rejected from the mid-range and is now heading toward the lower boundary of the wedge. This area has acted as a liquidity pocket and a reaction zone several times in the past.
If price reaches the lower trendline and shows a stable reaction, a clean relief wave can start from this point. The next major objectives sit at two zones. The first is the mid-channel resistance near two point one seven. The second is the broader bearish rejection zone around two point nine where price failed multiple times during previous attempts.
A breakdown of the lower channel support will invalidate this bullish scenario and may open space toward deeper lows. The reaction near the wedge floor will decide the next directional leg.
This setup focuses on market structure, trendline behavior, channel dynamics, and liquidity sweeps. It remains a reaction-based outlook rather than a prediction.
Trade management and risk control remain essential in this environment.
POLKADOT ($DOT) Polkadot (DOT) Weekly Chart (1W) Technical Analysis
Examining the Polkadot (DOT) weekly chart, we can see that the asset is at a highly critical and historic juncture. From the perspective of a technical analyst, let's detail this chart regarding market cycle, critical support/resistance levels, and trend structure.
1. General Market Structure and Cycle Analysis
The chart clearly illustrates a classic "Boom and Bust" cycle.
Full Cycle Reset: The price has returned to the exact starting point of the massive bull run that began in late 2020 (approximately $1.98). This means the price action of the last 5 years has been effectively erased, returning the market to "ground zero."
Trend Outlook: The main structure is currently dominated by a Bear Market. The major ascending trendline (dashed line) was broken in early 2022, and the price has remained suppressed below this trend ever since.
2. Critical Price Levels
The most significant technical zones on the chart are as follows:
🟢 Major Support: $1.98 - $2.00 Zone (The "Kiss of Life")
This region is the "Make or Break" level for DOT.
Historical Significance: This is where the historic rally of 2020 originated. Returning to this level suggests we may be at a point of total seller exhaustion (capitulation).
Technical Expectation: A strong reaction/bounce from this level is technically highly probable. However, weekly closes below this level would drag the price into "price discovery" to the downside (unknown territory).
🔴 Major Resistance: $10.67 (Red Line)
Marked as "$10" on the chart, this is the most critical resistance barrier.
Price attempted to breach this level in 2022, 2023, and 2024, but was rejected every single time (as indicated by the red down arrows).
It is technically impossible to speak of a new bull trend until this level is decisively reclaimed.
⚠️ Intermediate Resistance and Broken Trendline
Broken Ascending Trend: The dashed black line now acts as strong diagonal resistance. Every bullish attempt hits this line or horizontal resistance and retraces.
Intermediate Targets: In a potential reversal, the $4.50 - $5.00 band would likely act as the first intermediate resistance.
3. Technical Formation and Interpretation
Round Trip (Cycle Completion): The drop from $55 levels back to $2 indicates a massive cycle completion. Usually, the end of such large drops is followed by a prolonged "Horizontal Accumulation" phase.
Triple Top / Rejection: The multiple rejections at the $10 level (seen around 2024) prove there is a significant supply (seller) block in that region.
4. Investor Strategy and Scenarios
As a market analyst, two main scenarios can be constructed based on this chart:
Scenario A: "Bottom Fishing" (Bullish Reversal)
Thesis: Price is at historic support ($1.98). The Risk/Reward (R/R) ratio is at its most attractive point for buyers.
Strategy: Gradual accumulation can be attempted in the $1.98 - $2.10 range, with a stop-loss strictly placed below $1.80.
Target: The first reaction target is the $4-5 band. Long term, the +$10 limit could be tested again. And Maybe old ATH = 50$

#DOT/USDT :BUY LOW#DOT
The price is moving within an ascending channel on the 1-hour timeframe and is adhering to it well. It is poised to break out strongly and retest the channel.
We have a downtrend line on the RSI indicator that is about to break and retest, which supports the upward move.
There is a key support zone in green at the price of 2.22, representing a strong support point.
We have a trend to stabilize above the 100-period moving average.
Entry price: 2.27
First target: 2.33
Second target: 2.41
Third target: 2.51
Don't forget a simple money management rule:
Place your stop-loss order below the support zone in green.
Once the first target is reached, save some money and then change your stop-loss order to an entry order.
For any questions, please leave a comment.
Thank you.

POLKADOT – LONG SETUP - LOADING SHORT SQUEEZE POTENTIALTraders,
$Polkadot is close to forming a high probability long setup, but it is not confirmed yet.
Here is the compact breakdown.
WHY DOT IS SETTING UP
Since 08 November price has been grinding down
Spot CVD, Coin Margined CVD and Stablecoin Margined CVD all fell with price which confirms real sell pressure
On 21 November the lows were swept
Today price tapped 2.220, the pivot level, and reacted
But we are still trading below 2.250, which means the squeeze setup is not active yet
Why the sweep matters
On Bybit around 915k Coin Margined short contracts opened into the low.
Coin Margined shorts use DOT as collateral which means when DOT rises they take a double hit.
The short loses value and their collateral also loses value.
This makes them far easier to liquidate once price reverses.
But price must reclaim the key level to trigger this effect.
THE KEY LEVELS
2.220 = the pivot
This is where price reacted
This is the 1.113 extension of the 04 November to 08 November move
This marks the completion of the downside rotation
2.250 = the trigger
This is the level price must reclaim and trade above
Above 2.250 shorts begin to go underwater
Above 2.250 the squeeze becomes active
Until $Polkadot trades above 2.250 the setup remains unconfirmed.
GAMEPLAN
Wait for two 30 minute candle closes above 2.250
This confirms the reclaim and activates the long setup
Look for a retest of the 2.240 to 2.250 zone
If buyers defend that retest it is the clean entry
As long as DOT stays below 2.250 this is only a potential setup
Falling back under 2.200 weakens the idea and requires reassessment
TARGETS IF CONFIRMED
If $Polkadot reclaims 2.250 the upside targets are:
3.675
3.877
4.063
4.327
Each level is a point to reassess momentum and structure.
FINAL VIEW
DOT swept the lows and trapped a large block of Coin Margined shorts.
The pivot at 2.220 has been touched, but the real trigger is 2.250.
Only once price reclaims and trades above 2.250 does the squeeze structure become active.
Until then it remains a potential high probability setup that requires confirmation.
Until the candles speak again,
ThetaNomad
-----------
If this helped you read the flow, drop a like and a comment
None of this is financial advice

DOT: Bullish Swing SetupIn this chart, the main focus is on the clear bullish divergence forming on the RSI, signaling a possible shift toward buyers regaining control. To find upside targets, I’ve added Fibonacci levels from recent swing highs to lows, marking key price zones where DOT could encounter resistance and potential breakout acceleration.
If momentum builds, the target is the golden ratio at $2.93, which historically acts as a strong magnet for price in retracement moves.
Another confluence is USDT.D at major resistance and soon a new fed cut will be priced in until 10th of December

DOT forming dual flag structure with supportDOT has formed a bullish flag on the global chart, and a similar pattern has formed more locally.
DOT's attempt to consolidate above the MA50 and MA200 was unsuccessful, but given these patterns, we are more likely to see a retest of them in the near future
Currently, we are at support at $2.668
A reversal and a breakout of the MA50 and MA200 resistance levels are more likely to occur
A move below the purple area will indicate a continuation of the downward movement
More detailed analysis, additional charts, and key levels to watch are available on our site

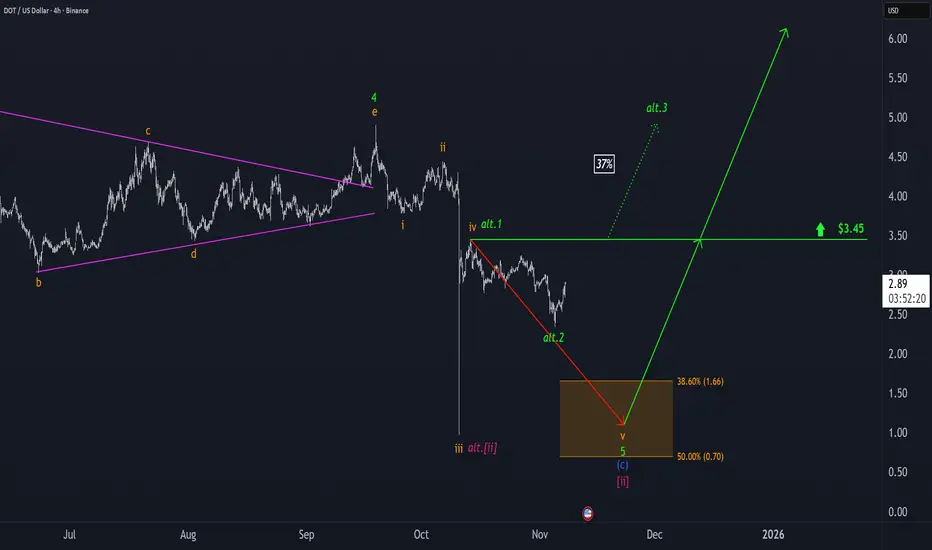
Polkadot: Ready to Bounce Straight Back Up?For now, we continue to expect that DOT will be sold off into our orange Target Zone between $1.66 and $0.70—which could offer attractive long entry opportunities – and complete magenta wave . However, we estimate there’s a 37% chance that the significant low is already in place and that the altcoin could break out directly above resistance at $3.45; in this scenario, our Target Zone would no longer be relevant.
DOTUSD | Bearish Rejection at Overlap ResistanceDOT/USD is rising towards the sell entry, which is an overlap resistance and could reverse from this level to the downside.
Sell entry is at 3.065, which is an overlap resistance.
Stop loss is at 3.277, which is a swing high resistance that aligns with the 161.8% Fibonacci extension.
Take profit is at 2.806, which is an overlap support.
Stratos Markets Limited (tradu.com ):
CFDs are complex instruments and come with a high risk of losing money rapidly due to leverage. 68% of retail investor accounts lose money when trading CFDs with this provider. You should consider whether you understand how CFDs work and whether you can afford to take the high risk of losing your money.
Stratos Europe Ltd (tradu.com ):
CFDs are complex instruments and come with a high risk of losing money rapidly due to leverage. 70% of retail investor accounts lose money when trading CFDs with this provider. You should consider whether you understand how CFDs work and whether you can afford to take the high risk of losing your money.

Polkadot: Short-Term Rally Before Potential Drop into Target ZonDOT is currently expected to move toward the high of wave iv in orange, according to our primary scenario. We continue to anticipate that this move will remain below the resistance level at $3.78. Afterward, we are primarily preparing for a wave v sell-off into the orange Target Zone ($1.66 – $0.70). In this range, we expect to see the low of wave in magenta, which should signal a potential long-term trend reversal to the upside. There is still a 30% probability that the correction low has already been completed as wave alt. in magenta. However, this alternative would only be definitively confirmed by a significant breakout above the $3.78 level.

DOTUSD Can this Channel save it from complete obsolescence?Polkadot (DOTUSD) has been trading within a Channel Down since the December 26 2022 Low and it only broke momentarily during last Friday's flash crash. Having recovered instantly above it and closing the 1W candle inside the pattern, it technically counts as a Lower Low.
The last two Lower Lows (both inside 2025), delivered rebound that hit tested the 1W MA50 (blue trend-line). As a result, the obvious technical Target on the medium-term is the 1W MA50 and our (a but more conservative) estimation is $4.600, which is right on the 0.382 Fibonacci Channel level. Of course that's assuming the market doesn't close any 1W candles below the Channel Down. The current price levels offer an excellent Risk/ Reward ratio on this.
If the 1W MA50 breaks, we can see an even more aggressive extension towards the top (Lower Highs trend-line) of the Channel Down. The best indicator for a Sell Signal in that scenario is the 1W RSI Resistance Zone. It has priced the last three major Highs since 2023. Naturally the 1W MA200 (orange trend-line) is the obvious long-term Resistance and potential Target in that scenario but can go even as high as 9.5000 if we repeat the previous +225.10% Bullish Leg.
-------------------------------------------------------------------------------
** Please LIKE 👍, FOLLOW ✅, SHARE 🙌 and COMMENT ✍ if you enjoy this idea! Also share your ideas and charts in the comments section below! This is best way to keep it relevant, support us, keep the content here free and allow the idea to reach as many people as possible. **
-------------------------------------------------------------------------------
💸💸💸💸💸💸
👇 👇 👇 👇 👇 👇

$DOT WEEKLY CHART UPDATE #DOT is showing a strong long-term CRYPTOCAP:DOT WEEKLY CHART UPDATE
CRYPTOCAP:DOT is showing a strong long-term accumulation pattern around the $3-4 zone. This level has acted as a solid historical support since 2022. If it holds, we could see a major reversal ahead with potential upside targets around $10–$20 by 2026.
The structure looks bullish, and early accumulation here could pay off big in the next cycle. 🚀

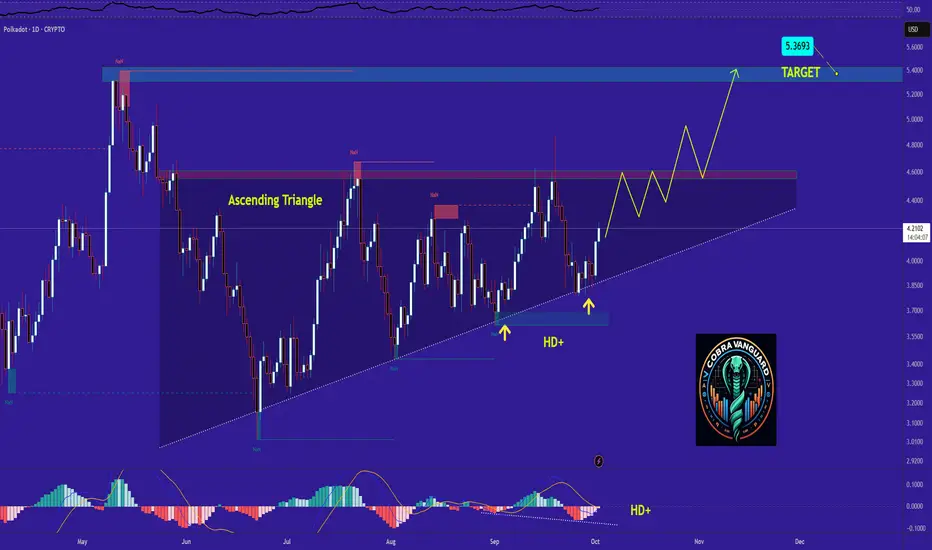
DOT's situation+next targets and expected movementsThe price on the daily timeframe is within an ascending triangle, which can be promising. If the price breaks this pattern with bullish candles, it could easily rise by the distance of AB=CD, If my view is correct, DOT will rise to $5 .
And if this pattern is correct and breaks, higher targets are possible.

$DOT \ PolkadotCRYPTOCAP:DOT \ Polkadot 🔃
Polkadot has been accumulating for a long time in both USD and CRYPTOCAP:BTC pairs and is gathering strength above the demand zone.
With the RSI supporting this movement, DOT is preparing for a new upward phase. The sleeping giant, which has been quiet for a long time, seems to be waking up soon.

DOTUSD H4 | Bearish Drop in Progress”DOT/USD is reacting off the sell entry which is a pullback resistance that aligns with the 50% Fibonacci retracement and could drop from this levle to the downside.
Sell entry is at 4.165, which is a pullback resistance that aligns with the 50% Fibonacci retracement.
Stop loss is at 4.420, which is a pullback resistance.
Take profit is at 3.878, which is an overlap support that aligns with the 61.8% Fibonacci retracement.
High Risk Investment Warning
Trading Forex/CFDs on margin carries a high level of risk and may not be suitable for all investors. Leverage can work against you.
Stratos Markets Limited (tradu.com ):
CFDs are complex instruments and come with a high risk of losing money rapidly due to leverage. 65% of retail investor accounts lose money when trading CFDs with this provider. You should consider whether you understand how CFDs work and whether you can afford to take the high risk of losing your money.
Stratos Europe Ltd (tradu.com ):
CFDs are complex instruments and come with a high risk of losing money rapidly due to leverage. 66% of retail investor accounts lose money when trading CFDs with this provider. You should consider whether you understand how CFDs work and whether you can afford to take the high risk of losing your money.
Stratos Global LLC (tradu.com ):
Losses can exceed deposits.
Please be advised that the information presented on TradingView is provided to Tradu (‘Company’, ‘we’) by a third-party provider (‘TFA Global Pte Ltd’). Please be reminded that you are solely responsible for the trading decisions on your account. There is a very high degree of risk involved in trading. Any information and/or content is intended entirely for research, educational and informational purposes only and does not constitute investment or consultation advice or investment strategy. The information is not tailored to the investment needs of any specific person and therefore does not involve a consideration of any of the investment objectives, financial situation or needs of any viewer that may receive it. Kindly also note that past performance is not a reliable indicator of future results. Actual results may differ materially from those anticipated in forward-looking or past performance statements. We assume no liability as to the accuracy or completeness of any of the information and/or content provided herein and the Company cannot be held responsible for any omission, mistake nor for any loss or damage including without limitation to any loss of profit which may arise from reliance on any information supplied by TFA Global Pte Ltd.
The speaker(s) is neither an employee, agent nor representative of Tradu and is therefore acting independently. The opinions given are their own, constitute general market commentary, and do not constitute the opinion or advice of Tradu or any form of personal or investment advice. Tradu neither endorses nor guarantees offerings of third-party speakers, nor is Tradu responsible for the content, veracity or opinions of third-party speakers, presenters or participants.

DOT is bullish now & many Traders don't see it !!!The price on the daily timeframe is within an ascending triangle, which can be promising. If the price breaks this pattern with bullish candles, it could easily rise by the distance of AB=CD, If my view is correct, DOT will rise to 5$ .
And if this pattern is correct and breaks, higher targets are possible.