GOLD – Bullish Above 4011 Ahead of Tariff TensionsGOLD – Outlook
Gold remains supported by bullish momentum ahead of the renewed tariff tensions between the U.S. and China.
These developments are expected to strengthen safe-haven demand, keeping gold on track toward new all-time highs if momentum continues.
Technically, as long as the price trades above 4011, the bullish trend is likely to extend toward 4040 and 4058, with potential continuation toward 4092.
A bearish correction would require a 1H candle close below 4011, which could trigger a move down to 3980, and below 3965 the decline may extend to 3944.
Gold will likely trade sensitively in the short term, reacting to any new statements from President Trump or updates on the tariff situation between Washington and Beijing.
Pivot Line: 4011
Resistance Levels: 4040 / 4058 / 4092
Support Levels: 3980 / 3965 / 3944
📈 Summary:
Bullish bias remains above 4011, targeting 4058 → 4092, while a close below 4011 may trigger a short-term correction.
F-XAU

GOLD BULLISH CONTINUATION EXPECTED|LONG|
✅XAUUSD confirms a clean breakout above the key level, shifting order flow bullish under ICT principles. A retest may follow before continuation, with price expected to seek buy-side liquidity near 4,030$. Time Frame 1H.
LONG🚀
✅Like and subscribe to never miss a new idea!✅

GOLD Free Signal! Buy!
Hello,Traders!
GOLD breaks above a key horizontal level, confirming bullish momentum as Smart Money drives price toward premium zones. The breakout suggests continuation to the 4,035$ target while respecting liquidity structure.
-------------------
Stop Loss: 3,993$
Take Profit: 4,035$
Entry: 4,016$
Time Frame: 1H
-------------------
Buy!
Comment and subscribe to help us grow!
Check out other forecasts below too!
Disclosure: I am part of Trade Nation's Influencer program and receive a monthly fee for using their TradingView charts in my analysis.

Gold Is on Fire: Can XAU/USD Hit $4130 Gold’s price is really strong right now. As long as gold stays above $4000, it can move up to $4130. But if gold drops below $4000, it could slow down or even start to fall.
What do you think will happen next, do you think gold will keep going up or fall back down? Have you ever watched gold make a big move before?
If you want to know what to do or have any questions, just ask me! Sometimes a simple question can help you learn something new about trading gold. What do you want to know about gold today?
Mindbloome Exchange
Trade Smarter Live Better

XAUUSD M30 | Bullish riseGold (XAU/USD) is reacting off the buy entry at 4,000.37, which is a pullback support and could potentially rise from this level to the upside.
Stop loss is at 3,950.65, which is a multi-swing low support.
Take profit is at 4,056.76, which is a multi swing high resistance.
High Risk Investment Warning
Trading Forex/CFDs on margin carries a high level of risk and may not be suitable for all investors. Leverage can work against you.
Stratos Markets Limited (tradu.com ):
CFDs are complex instruments and come with a high risk of losing money rapidly due to leverage. 65% of retail investor accounts lose money when trading CFDs with this provider. You should consider whether you understand how CFDs work and whether you can afford to take the high risk of losing your money.
Stratos Europe Ltd (tradu.com ):
CFDs are complex instruments and come with a high risk of losing money rapidly due to leverage. 66% of retail investor accounts lose money when trading CFDs with this provider. You should consider whether you understand how CFDs work and whether you can afford to take the high risk of losing your money.
Stratos Global LLC (tradu.com ):
Losses can exceed deposits.
Please be advised that the information presented on TradingView is provided to Tradu (‘Company’, ‘we’) by a third-party provider (‘TFA Global Pte Ltd’). Please be reminded that you are solely responsible for the trading decisions on your account. There is a very high degree of risk involved in trading. Any information and/or content is intended entirely for research, educational and informational purposes only and does not constitute investment or consultation advice or investment strategy. The information is not tailored to the investment needs of any specific person and therefore does not involve a consideration of any of the investment objectives, financial situation or needs of any viewer that may receive it. Kindly also note that past performance is not a reliable indicator of future results. Actual results may differ materially from those anticipated in forward-looking or past performance statements. We assume no liability as to the accuracy or completeness of any of the information and/or content provided herein and the Company cannot be held responsible for any omission, mistake nor for any loss or damage including without limitation to any loss of profit which may arise from reliance on any information supplied by TFA Global Pte Ltd.
The speaker(s) is neither an employee, agent nor representative of Tradu and is therefore acting independently. The opinions given are their own, constitute general market commentary, and do not constitute the opinion or advice of Tradu or any form of personal or investment advice. Tradu neither endorses nor guarantees offerings of third-party speakers, nor is Tradu responsible for the content, veracity or opinions of third-party speakers, presenters or participants.

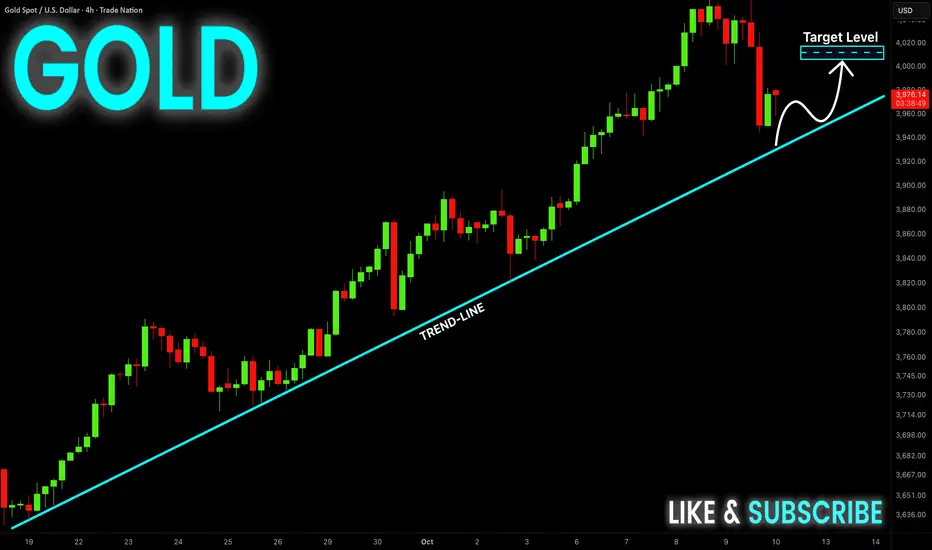
GOLD Long From The Trend-Line! Buy!
Hello,Traders!
GOLD is expected to retest the ascending trendline as Smart Money accumulates around dynamic support. Liquidity has been swept above prior highs, and a correction into discount pricing could spark a bullish continuation toward 4,000$. Time Frame 4H.
Buy!
Comment and subscribe to help us grow!
Check out other forecasts below too!
Disclosure: I am part of Trade Nation's Influencer program and receive a monthly fee for using their TradingView charts in my analysis.
Gold/USD: Bullish Climb to $4100?OANDA:XAUUSD is showing a bullish setup on the 1-hour chart , with an entry zone between $3,963-$3,985 near a key support level.
First target at $4,075 marks initial resistance, while the second at $4,100 offers a deeper upside potential. Set a stop loss on a close below $3,940 to manage risk effectively. 🌟
A break above $3,985 with strong volume could confirm this move, driven by safe-haven demand and USD dynamics. Watch economic data trends! 💡
📝 Trade Plan:
✅ Entry Zone: $3,963 – $3,985 (support area)
❌ Stop Loss: Daily close below $3,940
🎯 Targets:
TP1: $4,075 (initial resistance)
TP2: $4,100 (extended target)
Ready for this rally? Drop your thoughts below! 👇

GOLD FREE SIGNAL|SHORT|
✅XAUUSD forms a clean double top at overbought levels, confirming rejection from premium price levels. The neckline breakout signals Smart Money distribution, with downside targets near 3,920$ as liquidity gets drawn lower.
—————————
Entry: 3,988$
Stop Loss: 4,055$
Take Profit: 3,920$
Time Frame: 3H
—————————
SHORT🔥
✅Like and subscribe to never miss a new idea!✅

GOLD Local Long From 4000$! Buy!
Hello,Traders!
GOLD taps perfectly into the 4000$ demand area where Smart Money accumulates long positions after sweeping liquidity below intraday lows. A bullish reaction toward 4,024$ is expected as price rebalances inefficiency. Time Frame 15M.
Buy!
Comment and subscribe to help us grow!
Check out other forecasts below too!
Disclosure: I am part of Trade Nation's Influencer program and receive a monthly fee for using their TradingView charts in my analysis.

Gold Showed the Way... Is Bitcoin Next?Gold began a parabolic run after breaking through the Fibonacci 1.382 – 1.414 zone.
Now Bitcoin is gathering strength at the same threshold...
Historical similarity in setup
Gold broke through and became parabolic.
Next up Bitcoin
History often maps out the future.
Bitcoin, the “digital gold,” is preparing for its own run.
CRYPTOCAP:BTC Vs. TVC:GOLD 🔃

GOLD – Pullback After Gaza Deal, Fed Speech to Steer Next MoveGOLD – Overview | Pullback After Gaza Deal, But Bullish Structure Intact
Gold eased slightly after the announcement of a Gaza ceasefire deal between Israel and Hamas, as geopolitical tensions cooled.
However, prices remain near record highs, supported by expectations of further Fed rate cuts, strong ETF inflows, and persistent concerns surrounding the U.S. economy and the government shutdown.
Investors now await today’s Fed speech, which could set the tone for near-term volatility in the metal.
Technical Outlook
The price stabilized below the pivot line at 4,041, signaling mild bearish pressure in the short term.
As long as gold trades below this zone, momentum may continue toward 4,026 → 4,010, and a confirmed 15M close below 4,010 could extend the move toward 3,987.
On the other hand, a 15M close above 4,041 would shift momentum back to the upside, opening the way toward 4,058 → 4,072 → 4,092, with the 4,100 area marking the next key bullish target.
Pivot Line: 4,041
Resistance: 4,058 · 4,072 · 4,092
Support: 4,026 · 4,010 · 3,987
Summary:
Gold remains fundamentally supported by global uncertainty and Fed rate-cut bets, even as short-term corrections play out.
Watch for volatility around the Fed speech—a dovish tone may reignite bullish momentum above 4,041, while a hawkish tone could trigger deeper correction below 4,010.

Gold Futures – Pre-Killzone WatchPrice spent all of yesterday grinding bullish with strong impulsive legs, but things are finally slowing down near the highs. We’re now seeing signs that the market might be ready for a pullback or liquidity grab before deciding its next leg.
Current Range: 4,005 (D-L) → 4,081 (D-H)
Bias: Bullish overall, but watching for short-term weakness.
Gameplan:
Look for a possible sweep above 4,081 during London or NY Killzone.
If we get a sharp rejection or displacement after that sweep, I’ll be interested in a sell setup targeting the 4,046–4,005 range.
If price holds above 4,046 and forms clean FVGs, continuation to 4,100+ stays on the table.
This is the pause before the next move. No reason to front-run it — I’ll let the killzone reveal where the liquidity really wants to go.
💭 Patience pays — wait for the sweep and shift.
— Woodz | #NOFOMO

Gold ATH – Uncle Jimmy, Silver Momentum & The Market Signal🏆📈 Gold ATH – Uncle Jimmy, Silver Momentum & The Market Signal 🧠🪙
Welcome to Episode 2 of “When Gold Believers Flip.”
Gold has officially broken to all-time highs , and Uncle Jimmy’s quiet rotation into silver suddenly looks like genius…
🟡 GOLD (XAUUSD)
Gold just printed a fresh all-time high at $4,068 🔥
Technically, I still hold a long-term target at $4,489, but the market is overextended.
📉 Game plan:
I’ll only consider shorting below $3,983.
🎯 Short setup:
• Entry: Below $3,983
• Stop-loss: $4,015
Until that trigger hits, bulls remain in control — but risk is rising.
⚪ SILVER (XAGUSD)
Now here’s where it gets juicy.
Remember Uncle Jimmy — the 30-year gold maxi?
This summer, he shocked everyone:
“I’m selling gold to buy silver.” 💬🪙
Guess what? He might’ve nailed it.
Silver is now trading at $48.97, just shy of historical resistance:
🏆 $49.83 (Jan 18, 1980)
✴️ $49.51 (Apr 25, 2011)
🎯 Target: $50.03
But this move is more than a breakout — it’s a sentiment shift.
🧠 The Macro Signal
Yesterday:
🟡 Gold ↑, Silver ↓ = Defensive positioning → not great for markets.
Today:
⚪ Silver ↑, Gold ↓ = Risk appetite returning → bullish tone across assets.
That’s a tailwind for:
• Nasdaq
• Bitcoin
• Broad markets
Silver is part money, part industrial metal — when it leads, optimism rises.
🔁 The Rotation Is Real
📉 Gold looks tired (recent action says not; but my analysis says it is)
🪙 Silver is shining
₿ Bitcoin is waiting
📊 Nasdaq is leading
When hard-money believers like Uncle Jimmy flip...
Pay attention.
Watch the metals.
Watch the sentiment.
This is how macro mood shifts begin.
Mindset Check 🧘
When veterans change conviction, it’s rarely random. Markets evolve — the smartest adapt. Don’t cling to narratives; flow with signals.
One Love,
The FXPROFESSOR 💙
Disclaimer: These charts and analyses reflect my personal opinion only. I am not a financial advisor. Nothing here is financial advice. Trading involves risk, and you are fully responsible for your own decisions. Trade wisely.

Gold will retraceThe last move of Gold hasn't made a good base, and 3600 is the price it may find that base to retrace and retest.

GOLD SHORT FROM ATH 4000$
✅XAUUSD is getting closer to the 4,000$ epic supply level and will soon be forming a potential all-time-high rejection. Liquidity above will be cleared, and Smart Money shows bearish intent toward lower rebalancing levels near 3,920$.
—————————
Entry: 3,982$
Stop Loss: 4,010$
Take Profit: 3,920$
Time Frame: 4H
—————————
SHORT🔥
✅Like and subscribe to never miss a new idea!✅

GOLD – New All-Time High, Bullish Above 3,976 Toward 4,020GOLD – Overview
Gold recorded a new all-time high (ATH) and continues to show strong bullish momentum.
The metal remains supported by expectations of further Fed rate cuts and safe-haven demand, but short-term corrections are possible if price fails to hold above key pivot levels.
Technical Outlook
As long as price trades above 3,976, the bullish trend remains intact, with potential to extend toward 4,008 → 4,020.
A 1H or 15M close below 3,976 would indicate the start of a bearish correction, targeting 3,957 → 3,944.
Pivot: 3,976
Resistance: 4,008 – 4,020
Support: 3,960 – 3,944 – 3,920

Gold - 4H Forecast ☀️ GOLD – 4H Forecast ☀️
Alright gold gang, let’s talk business — XAU/USD is setting up for something clean 👇
🧠 Bias :
Still bullish overall, but we’re chilling in premium territory, and this structure screams “pullback incoming.” Expect a retrace before the next rocket launch 🚀.
🧩 Technical Breakdown:
Price just printed a Buy-Side Liquidity (BSL) grab up top — textbook liquidity sweep before a potential correction.
We’ve got a strong impulsive leg pushing off a 4H + Daily demand confluence around $3,850–$3,880.
The 71% fib retracement zone aligns beautifully with that 4H demand, creating a prime reload area if price dips.
The volume profile gap (POI) also hints at untested liquidity sitting below current highs.
🎯 Trade Idea:
Entry Zone: $3,880–$3,860 (4H & Daily demand overlap)
Target 1: $3,970 (current high retest)
Target 2: $4,010+ (continuation into new impulse)
Invalidation: Below $3,830 (break of structure + demand failure)
⚙️ Risk Management:
Keep risk tight — 1%–1.5% max. If we get a reaction at the 71% level, partials at $3,950 are smart to secure profits before the next leg.
💬 Summary :
Gold just ran buy-side liquidity and looks ready to dip into discount before ripping higher again. If we get a clean 4H or 1H confirmation in the demand, expect another bullish leg to unfold.

GOLD - Up Channel Gold on the Weekly chart.
A channel can be plotted between the lower strong trend line that is respected by many points and a prior peak.
I think a similar motion is in way to that seen before on GOLD this is shown with the green dotted lines
Right now price is testing the middle of the channel. Hopefully the breakout continues.

GOLD signal (15m)Important Note:
Risk only 1% of your total capital to maintain proper risk management.
Sell: 3959 – 3961
Stop Loss: 3963
Take-Profit Targets:
• TP1: 3955
• TP2: 3950
• TP3: 3945
• TP4: 3940

XAUUSD - Will Gold Hit $4,000?!Gold is trading above the EMA200 and EMA50 on the hourly chart and is trading in its medium-term ascending channel. A correction towards the demand zone will provide us with a better risk-reward buying opportunity. It should be noted that these positions are intended to hedge against this uptrend.
In early Monday trading in Asian markets, global gold prices surpassed $3,900 per ounce for the first time, driven by stronger demand for safe-haven assets amid the U.S. government shutdown and rising expectations of further Federal Reserve rate cuts.
Goldman Sachs once again reaffirmed its bullish outlook on gold, calling it its “most favored long-term commodity asset”, even as the precious metal continues to reach new record highs. Analysts at the bank believe the upward momentum remains intact.
Goldman forecasts that gold will reach $4,000 by mid-2026 and $4,300 by December 2026. However, the bank cautioned that upside risks beyond these projections are emerging. Notably, speculative flows account for only about 1% of the recent 14% rally, signaling stronger and more sustainable support from ETFs and central banks.
Marc Chandler, CEO of Bannockburn Global Forex, commented: “Gold has risen for the seventh consecutive week, having declined in only one week since late July. The U.S. government shutdown, Europe’s debate over reusing Russian reserves, and ongoing hybrid tensions across Europe have all contributed to this rally.” He added, “A short-term support level has formed near $3,800, and reaching $4,000 no longer seems far-fetched.”
Similarly, Darin Newsom, senior market analyst at Barchart.com, noted: “The market trend remains bullish. The U.S. economy has not improved—if anything, it has deteriorated further. Central banks and global investors clearly recognize this and continue accumulating gold.”
For this week, considerable uncertainty surrounds the U.S. data release calendar. If Democrats and Republicans manage to reach an agreement on a temporary funding bill early in the week, the September employment report could be released on schedule Friday. Estimates suggest a modest improvement in job creation, with around 50,000 new positions, though the weak ADP private payrolls data paints a more cautious picture. Still, downside risks to employment remain, reinforcing expectations for further rate cuts.
Even if the jobs report is delayed, the ongoing government shutdown alone could drive markets to increase bets on rate reductions, as a surge in furloughed federal workers and reduced economic output from halted government operations may compel the Fed to lower borrowing costs.
Beyond Washington’s political standoff, investors’ focus this week will be on the minutes from the Fed’s September meeting, which could reveal growing divisions among policymakers over the labor market outlook.
The Fed’s latest dot plot highlights a widening gap between hawkish and dovish members, meaning any new clues in the minutes about the timing or pace of rate cuts could spark a strong market reaction.
Toward the end of the week, attention will also turn to the University of Michigan’s preliminary consumer sentiment survey, particularly the inflation expectations component, which holds significant weight for gauging domestic demand. At the same time, the U.S. Treasury market faces a busy schedule of debt auctions, adding another layer of focus for investors.

GOLD H1 | Bullish ContinuationBased on the H1 chart analysis, we could see the price fall to the buy entry at 3,894.11, which is a pullback support that aligns with the 38.2% Fibonacci retracement and could bounce from this level to the upside.
Stop loss is at 3,853.38, which is a pullback support that is slightly above the 78.6% Fibonacci retracement.
Take profit is at 3,946.56, which is a pullback resistance.
High Risk Investment Warning
Trading Forex/CFDs on margin carries a high level of risk and may not be suitable for all investors. Leverage can work against you.
Stratos Markets Limited (tradu.com ):
CFDs are complex instruments and come with a high risk of losing money rapidly due to leverage. 65% of retail investor accounts lose money when trading CFDs with this provider. You should consider whether you understand how CFDs work and whether you can afford to take the high risk of losing your money.
Stratos Europe Ltd (tradu.com ):
CFDs are complex instruments and come with a high risk of losing money rapidly due to leverage. 66% of retail investor accounts lose money when trading CFDs with this provider. You should consider whether you understand how CFDs work and whether you can afford to take the high risk of losing your money.
Stratos Global LLC (tradu.com ):
Losses can exceed deposits.
Please be advised that the information presented on TradingView is provided to Tradu (‘Company’, ‘we’) by a third-party provider (‘TFA Global Pte Ltd’). Please be reminded that you are solely responsible for the trading decisions on your account. There is a very high degree of risk involved in trading. Any information and/or content is intended entirely for research, educational and informational purposes only and does not constitute investment or consultation advice or investment strategy. The information is not tailored to the investment needs of any specific person and therefore does not involve a consideration of any of the investment objectives, financial situation or needs of any viewer that may receive it. Kindly also note that past performance is not a reliable indicator of future results. Actual results may differ materially from those anticipated in forward-looking or past performance statements. We assume no liability as to the accuracy or completeness of any of the information and/or content provided herein and the Company cannot be held responsible for any omission, mistake nor for any loss or damage including without limitation to any loss of profit which may arise from reliance on any information supplied by TFA Global Pte Ltd.
The speaker(s) is neither an employee, agent nor representative of Tradu and is therefore acting independently. The opinions given are their own, constitute general market commentary, and do not constitute the opinion or advice of Tradu or any form of personal or investment advice. Tradu neither endorses nor guarantees offerings of third-party speakers, nor is Tradu responsible for the content, veracity or opinions of third-party speakers, presenters or participants.

Gold Futures (MGC) – Pushing Into New HighsPrice continues to climb into all-new highs with very little pullback, showing clear bullish momentum. However, structure is getting thin, and momentum could begin to exhaust soon.
🔹 Current Bias: Bullish — until 4H structure breaks.
🔹 Key Levels:
‣ W-H: 3928
‣ D-H: 3916
‣ D-L: 3861
‣ Daily FVG: 3820–3720
💡 Notes:
Price has yet to rebalance the large Daily FVG below. If we sweep external liquidity above 3928–3935 and fail to close strong, that could set up a pullback or even a deeper correction into the Daily FVG zone.
Volume profile shows thin structure between 3860–3820 — if momentum fades, that area could act as a magnet for price.
For now, the bullish pressure remains intact — but I’m watching closely for exhaustion signs or a liquidity grab setup at the highs.
#GoldFutures #MGC #FuturesTrading #ICT #PriceAction #SmartMoney #DayTrading #NOFOMO

$BTC / $GOLDCRYPTOCAP:BTC / TVC:GOLD 🔃
2013 | 1 Btc = 1 Gold
2017 | 1 Btc = 16 Gold
2021 | 1 Btc = 37 Gold
2025 | 1 Btc = 31 Gold \ More is coming
In December 2024, 1 Bitcoin was worth 41 gold, but there was no monthly close above the 2021 ATH level.
