EURCAD - Potential LongI am still not 100% sure if this pair has shown signs of a fake breakout, we will need to monitor the price on Monday and wait and see whether or not price wants to continue ot respect the ascending trend line or trade outside it again. Definitely one to keep on your watchlist, lots of potential for an upside move here.
COT Data - 72% Short
Fakeout

GBPJPY - LongWe are currently seeing some pound strength again after the news that EU wont seek to suspend negotiations on Brexit. So I will be waiting for the daily close to asses whats next for GJ, more price action needed for now.

Week 37: FCPOX 2020 is worth a waitWeek 37: 07 to 11 September 2020
FCPOX 2020 analysis
Last week the price broke the resistance level, however it was not a clean break.
It means, it was not really a sign to be bullish yet. We are anticipating two possibilities:
The key to observe is RM 2,740 - 2,750, we will see the behaviour of Price Action in this area.
(1) If the price bounce at RM 2,745 area, then it is a good sign to look for a BUY.
(2) If the price is back inside the previous consolidation zone, we can be sure that the past 2-3 days are just a False Breakout.
We will sell the whole-nine-yard when it happens.
That's why I recommend if we just sit tight and watch first, for now (Monday), no clear direction.
Disclaimer :
The analysis above for educational purposes only, I do not responsible for your losses. Please adjust your own lot sizing according to your appetite.
If you are benefiting from my trade opinion, please buy me coffee .
As always, move your SL when you are in the profit zone.

GBPUSD - Monday TradeWe won't be trading today but this is a potential setup you could take. We may have witnessed a fake breakout of the ascending channel on the 4HR time frame. It is possible that the price could now decline aggresively.

GBP/CAD High Risk SellHigh risk fakeout sell setup. Against the 50EMA (Which its reacting to on the 1HR now) so it's high risk. Also against the overall trend.

Waiting for a clear break outAfter making a nice trend higher on the daily chart, price has stalled into a sideways box pattern.
After trying to make a breakout higher that ended in a fakeout, price is very much stuck at the moment.
The best play looks to be to watch this pair until price makes a clear break out of this congestion and shows some clearer price action.

EURGBP - 1 HRAccording to supply and demand , the price fly from demand zone to this major supply zone and possible fake out could be recognize ,THIS MAY BE A POSSIBLE POSITION

Price Makes False BreakPrice attempted a breakout higher in this pair last week that turned into a fakeout with a daily bearish 2 bar reversal.
Price was looking to breakout higher and through what has been a tight ranging period.
Now price has moved back lower into the range, more sideways price action could play out.
In the short-term the intraday price flip level we discussed last week looks important. If it holds as a new resistance it could contain prices lower.

BITCOIN SELL SIGNAL Hey tradomaniacs,
welcome to a new free trading-setup.
Notice: This is meant to be a preparation for you! As always we will have to wait for a confirmation!
BTC/USD: Daytrade-preparation
Market-Sell: 11870
Stop-Loss: 12500
Target 1: 11200
Target 2: 10895
Target 3: 10425
Stop-Loss: 630 pips
Risk: 0,5 % - 1%
Risk-Reward: 2,33
LEAVE A LIKE AND A COMMENT - I appreciate every support! =)
Peace and good trades
Irasor
Wanna see more? Don`t forget to follow me.
Any questions? PM me. :-)


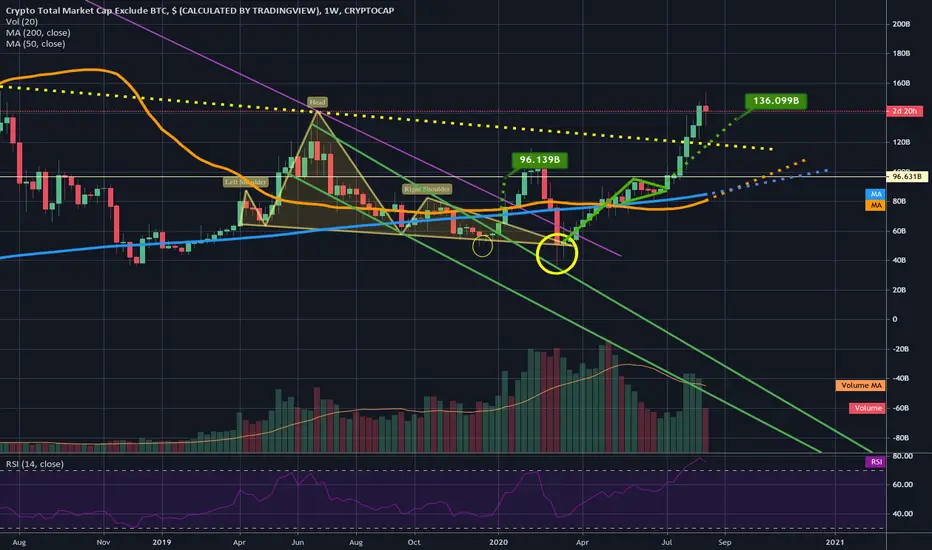
Check out my old weekly chart for the alt market.This one's TA played out like true poetry. I was on my way to post a chart of an exciting double bottom pattern on the TOTAL2 (altmarket) chart and it brought back up some charting I had done on a head and shoulders (in yellow). I was saying in previous ideas over a year ago when we originally formed this big h&s patterns that based on how illogically low the breakout target is we would definitely see this pattern end up being a fakeout which would lead to at best the end of the bear market...many times a bearish head and shoulder pattern is really a bullish falling wedge in disguise and this time was no different. So I have a yellow head and shoulders pattern and a green falling wedge drawn here overlapping eachother you can see I marked the measured move target from where we broke out of the green wedge at $96. we can also see inside the smaller yellow circle, that right before we broke up from the wedge we had price send a wick below the neckline of the h&s likely trapping a bunch of naive bears..it then slingshotted itself out of the wedge and over the breakout target plummeting back into the h&s pattern a few short weeks later for one last fakeout at the neckline (as shown in the larger yellow circle) super interesting how this fakeout candle's lower wick retested the top trendline of the green wedge with absolute precision and the body of the same candle closed perfectly on the support of the neckline. After now confirming the h&s fakeout & the falling wedge breakout simultaneously we shot up to just below the horizontal resistance at 96 but above the 200 and 50 weekly mas until we finally closed a candle above that horizontal resistance after forming a bull pennant of which had a breakout target shown here at $136...upon reaching that target we surpassed our top dotted yellow resistance and will now possible look to retest it as new solidified support. We can see we are mere weeks away from a weekly golden cross which would greatly increase the probability that we maintain the dotted yellow line as solidified support. There is now a bigger pattern on a more macro scale to focus on so immediately after I post this idea I will be posting another one with only the larger pattern which is a double bottom that will also likely trigger and lead to much more upside and a confirmed bull market altseason for the alt market.
Bitcoin Faked The Fakeout? In my last analysis, I was a bit devided by the price action of Bitcoin. Bitcoin broke in and out of its triangle whether it was bullish or bearish. We spotted 2 false breakouts on the downside and one on the upside.
When the price was at the support line of the triangle, I said that Bitcoin had a 55% probability to rise to resistance and possibly break it. Right now, Bitcoin is at resistance again which gives me more confidence Bitcoin will rise to our target of 13k. Because the price is still in the triangle we can't get ahead of ourselves yet. So i raise my probability to 60% for the price to break bullish.
Now, this still is not enough confidence to take the trade. At least you want to be 70% sure that the trade will be successful. For that to happen, Bitcoin needs to get above the red resistance zone again. But for now i am more confident than i was yesterday. However i still am not as confident as i was 2 days ago.
To summarize: I still think it is more probable the price will reach our target of 13k. However I need to be sure for at least 70% before i make that claim again.


USDCHF - Manipulation Done?After a, now confirmed, fake break out of the support, I expect the pair to re-test the support and break out of it's current range

AST- low-cap speculation/gamble. Long if weekly S/R lvl holdAs DEXes trading volume approach or even exceed that of centralized exchanges, speculators are pushing up the price of DEX tokens.
AirSwap has the market cap of around 35 millions and is a speculative DEX token that has a lot of upside potential.
Long now or wait until the weekly S/R lvl is successfully retested.

LEND- Time to cool offMakerDao, Compound and Aave are the three major lending protocols in the DeFi space. I think LEND has run its course and there are better coins to speculate on since it has already gone up more than 35x this year alone.
It may be facing a major pullback soon. Even so, it is never a wise idea to short a high momentum coin until the trend is clearly broken, which hasn't happened for LEND yet.


would you really be surprised if bitcoin did thishow many diag breakouts lead to fakeouts and dumps with bitcoin, it would be ultimate trap for moon boys to 100x long into a supernova style dump and rinse scenario

BTC BREAKOUT OR FAKEOUT?Is amazing to see BTC finally manage to enter the red zone, BTC has been in front of the doorstep three-time( 26/10/2019, 11/02/2020, and 01/06/2020) and unfortunately, BTC backed away.
And I just missed the chance to long BTC, and on a dilemma to take any trade on BTC.
I am still skeptical the BTC will passthrough this red zone and reach another high.
Why? Because:
1. The volume of BTC breaking the Triangle Pattern is so low ( it could be a potential Fakeout)
2. The MACD, although we have a crossover, look at how weak it is.
3. The RSI, if we are on the Overbought zone I would be glad because it indicating the trend is strong.
4. There is no best support to put on.
Thus, I would pass the current opportunity to take any entry, I would rather wait for it pass through this red zone taking entry around 11,4k. IF BTC goes close above the red zone we could put SL on 10k which is the optimal support for the current potential bull run.
We could short on the current price, right? Nah I pass too.
Is tempting but is really really risky, I don't see signs of exhaustion from the bull yet, the bull run is still legit, and taking short is just like standing in front of a rampage, waiting to be killed.
Shorter be patient, be careful of a rampage.

fake outpeople saw eth rise so fomod into btc, but resistance wont be broken, so many altcoins easily replace btc. alt season coming, those who buy btc now will be rekt.
there are some new projects based on elrond. just to give u a hint.


