possible move for fbthis is all my observation now at fb. market break h4 trendline and sing a bearish tone. and market need to a retrace also. FShortby gaziomar1
$FB Look for H&S Throwback retest and possible breakout, low RSI$FB Look for H&S Throwback retest and possible breakout and low RSIFLongby Georgi_Georgiev228
FB 300+Worldwide, there are over 2.74 billion monthly active users (MAUs) as of October 29, 2020. This is a 12 percent increase in Facebook MAUs year-over-year. This is compared to 2.38 billion MAUs for Q1 2019 and 2.38 billion MAUs for December 2019 FACEBOOK MARKET PLACE IS BOOMING NEW LINKEDIN LIKE FEATURES THEY OWN INSTAGRAM YOUTUBE VIDEO LIKE SECTIONS TIKTOK LIKE SHORT FILMS MESSGER + FACETIME ABLE NEW DEVICES SHOULD BE ROLLING OUT SOON THEY SHOULD BE TACKLING ISSUES AS OTHER EMERGING INDUSTRIES ARE !!FLongby trevorrossfeit331
#FB - 1D - DEFINITION ZONE.Perfect uptrend since May. Multiple tests over the past few months. 7 to be exact. Here we are now again. The last session left us with a Doji candlestick pattern just under MA50. This Sunday, Republican and Democratic party leaders announced that a deal had been reached for a new stimulus check. There are enough votes for a majority approval this Monday on congress. We might spect a bullish day tomorrow for all mayor companies of SP500. With this tailwind in favor, the price could break MA50 and cross Ichimoku's cloud at the same time. This will could create the propper impulse to break that pennant triangle and reach ATH as the first target. In this case, we don't have a main support under trendline to act as a safety net. So, I would like to take two approaches: Conservative Strategy: - Open position: USD 276. 40 - Stop Loss: USD 269.54 - Price target: USD 304. - Risk/Reward ratio: +4.6 Risky Strategy: - Open position: USD 276. 40 - Stop Loss: USD 264.46 - Price target: USD 304. - Risk/Reward ratio: +2.53 Risk management is always as important as all research and technical analysis we can make. Long-term profitable trading is about been wrong small and right big.FLongby aoberninger220
FB Analysis Bullish Over: 281.69 Price Target: 291.55 Stop: 273.08 Contract: 12/24 290cFLongby itsCblast5
FB 4hrs FB hrs heading to the desired target 300+ Not ready yet to make a big move but it's starting to show signs of strength no doubts, this week will need to build demand above 277 FLongby FT_Trades0
$FB - Bear Target $271-$253Break below 200 MA confirms downtrend First Target $271-$253FShortby HIDDENImmortal552
FB follow through of ABCDE triangle 12/16Getting ready for move up and possibly breaking out through resistance FLongby retardmaxxxing0
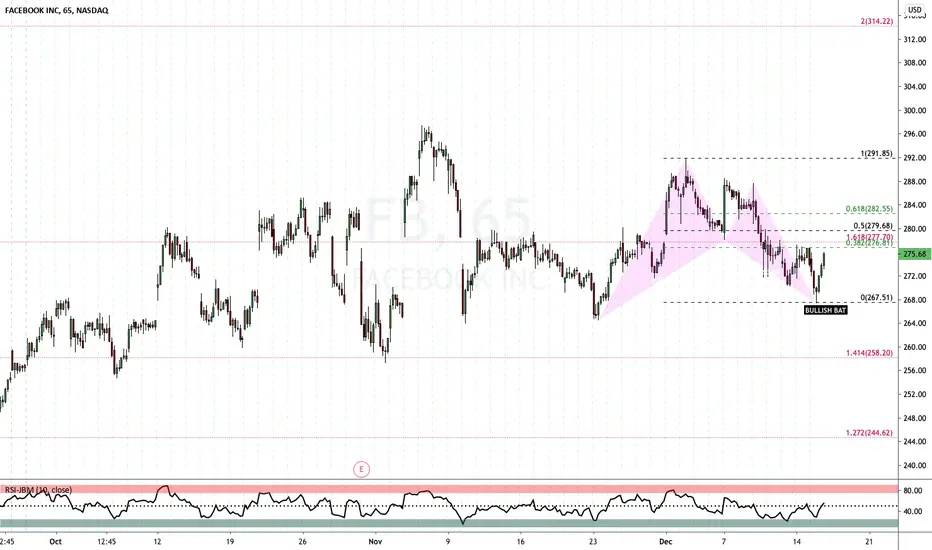
FB Bullish BAT CompletionFB completed a perfect BAT precise D point .886 AXA. Now in take profit mode 1st target 38 fib.. last one for now.. Good luck trading. FLongby Cyphertrades4
FB- triangleShort term bearish hasnt abated. but medium / long term bullish remain bullish as the price within a triangle. FLongby amjoe1
Facebook Potential Upside: Wedge AnalysisFacebook is inside this wedge for several months already, soon it will break out of it. Before the break, I see FB contesting the $287.50 area again. What are your thoughts?FLongby FieryTrading117
The big picture on FacebookToday, we will show you a full analysis of FACEBOOK Let's start on the Daily chart: a) We can see an ascending channel that was formed from the early IPO of Facebook b) Currently, the price is above the channel, showing a clear strength of the bullish trend c) Above the channel, we have a pennant pattern (This type of patterns are known as continuation structures) d) IF we have a breakout above 300. We will take it as a confirmation of the bullish movement towards the next target (TP1) and a final target on (TP2) e) IF the price goes in the expected direction. We think the whole movement can take between 100 and 150 days. 4HS chart: Here its a zoomed view of the current pennant pattern FLongby ThinkingAntsOk24
FB Daily FB daily still holding the 270 support that is crucial, and it also created a falling wedge pattern above 270. all eyes on the 270 if we break it then 260/240 next otherwise if the falling wedge pattern holds true 300-320 next FLongby FT_Trades0
AMZN / SPY (2019)AMZN LAGGING BEHIND SPY REMINDS ME OF LAST YEAR. Any positive news for AMZN can be the catalyst to send it higher. by KevinBurrows118
Big Tech still underperform frm Sep (AAPL, AMZN, MSFT, FB, NFLX)Big Tech still underperforming from Sep (Apple AAPL, Amazon AMZN, Microsoft MSFT, Facebook FB, Netflix NFLX) - with the exception of Google GOOG.Shortby dartde110
TSLA / AMZNAMZN LOOKS LIKE TSLA BACK IN NOV. I WOULD GO LONG OVER 3200, OR YOU CAN WAIT FOR THE 3250 BREAK FOR A BIGGER BREAKOUT. I WOULD GO SHORT UNDER 3075. by KevinBurrows10
FB Finding Support - Followed by Possible BreakoutThis is just speculation. Trading near support within pennant. RSI hidden divergence.FLongby otis_bagshots1
AMZN consolidating; loooking for retest $3500 before march.AMZN has been trading into a consolidation pattern. Looking for bullish price action in the following weeks. PT $3500 (ATH).Longby NorthShoreTech0
$FB #FB Range is getting tight!Facebook triangle pattern is getting tight. Just waiting for the breakout, a stimulus bill would do the trick. FLongby LiCapitalTrading0